

Igor Kutyaev
I recently wrote a contrarian bullish article on the Templeton Dragon Fund (TDF), arguing for a rebound in Chinese equities. I believe the same argument can be made for the iShares MSCI China ETF (NASDAQ:MCHI).
Simply put, the bear case against Chinese equities has become too consensus: housing crisis, tech crackdown, zero-COVID, and U.S. sanctions. Even the slightest improvement in any single factor can spark a large rebound, as we saw from the dramatic moves this past week. While the 1-week percentage gain looks large, in the context of the 60%+ 2-year decline in the MCHI ETF, there is certainly a lot of room for the rebound to continue.
Fund Overview
The iShares MSCI China ETF gives investors convenient exposure to mid to large-cap Chinese equities. MCHI is the largest China-focused ETF in the market place with $5 billion in assets (Figure 1). It also charges one of the lowest expense ratio of the peer funds at 0.57%.
Figure 1 – MCHI ETF overview (Seeking Alpha)
Strategy
The iShares MSCI China ETF achieves its investment objective by tracking the investment results of the MSCI China Index (“Index”). The Index is a free float-adjusted market cap weighted index designed to capture the top 85% market capitalization of the Chinese equity markets. The Index includes H-shares of Chinese companies that are listed on the Hong Kong Stock Exchange (“HKSE”), A and B-shares of Chinese companies listed on the Shanghai Stock Exchange (“SSE”) Shenzhen Stock Exchange (“SZSE”), Red-Chips, which are companies incorporated in foreign jurisdictions but controlled by entities owned by the Chinese government, and P-Chips, which are foreign incorporated companies controlled by Chinese nationals that derive most of its revenues in China.
As of August 31, 2021, approximately 18.6% of the Index was invested in H-shares, 46.3% in P-Chips, 4.9% in Red-Chips, 13.8% in A-shares, 0.1% in B-shares and 16.4% in foreign listed securities.
Portfolio Holdings
The MCHI ETF is broadly diversified and has 622 holdings with a weighted average P/E ratio of 9.2x and trailing 12m dividend yield of 1.85% (Figure 2).
Figure 2 – MCHI portfolio characteristics (ishares.com)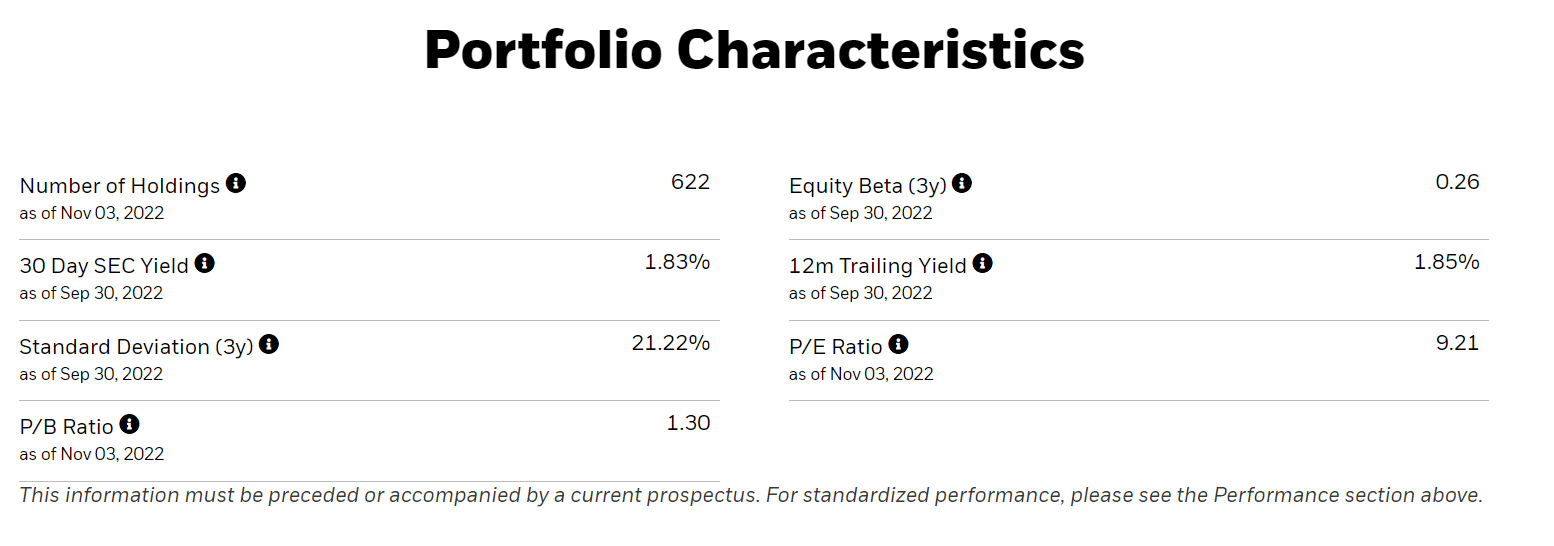
The MCHI ETF’s sector breakdown is shown in Figure 3. The fund’s largest sector weights are Consumer Discretionary at 29.5%, Communications at 16.1% and Financials at 15.9%.
Figure 3 – MCHI sector breakdown (ishares.com)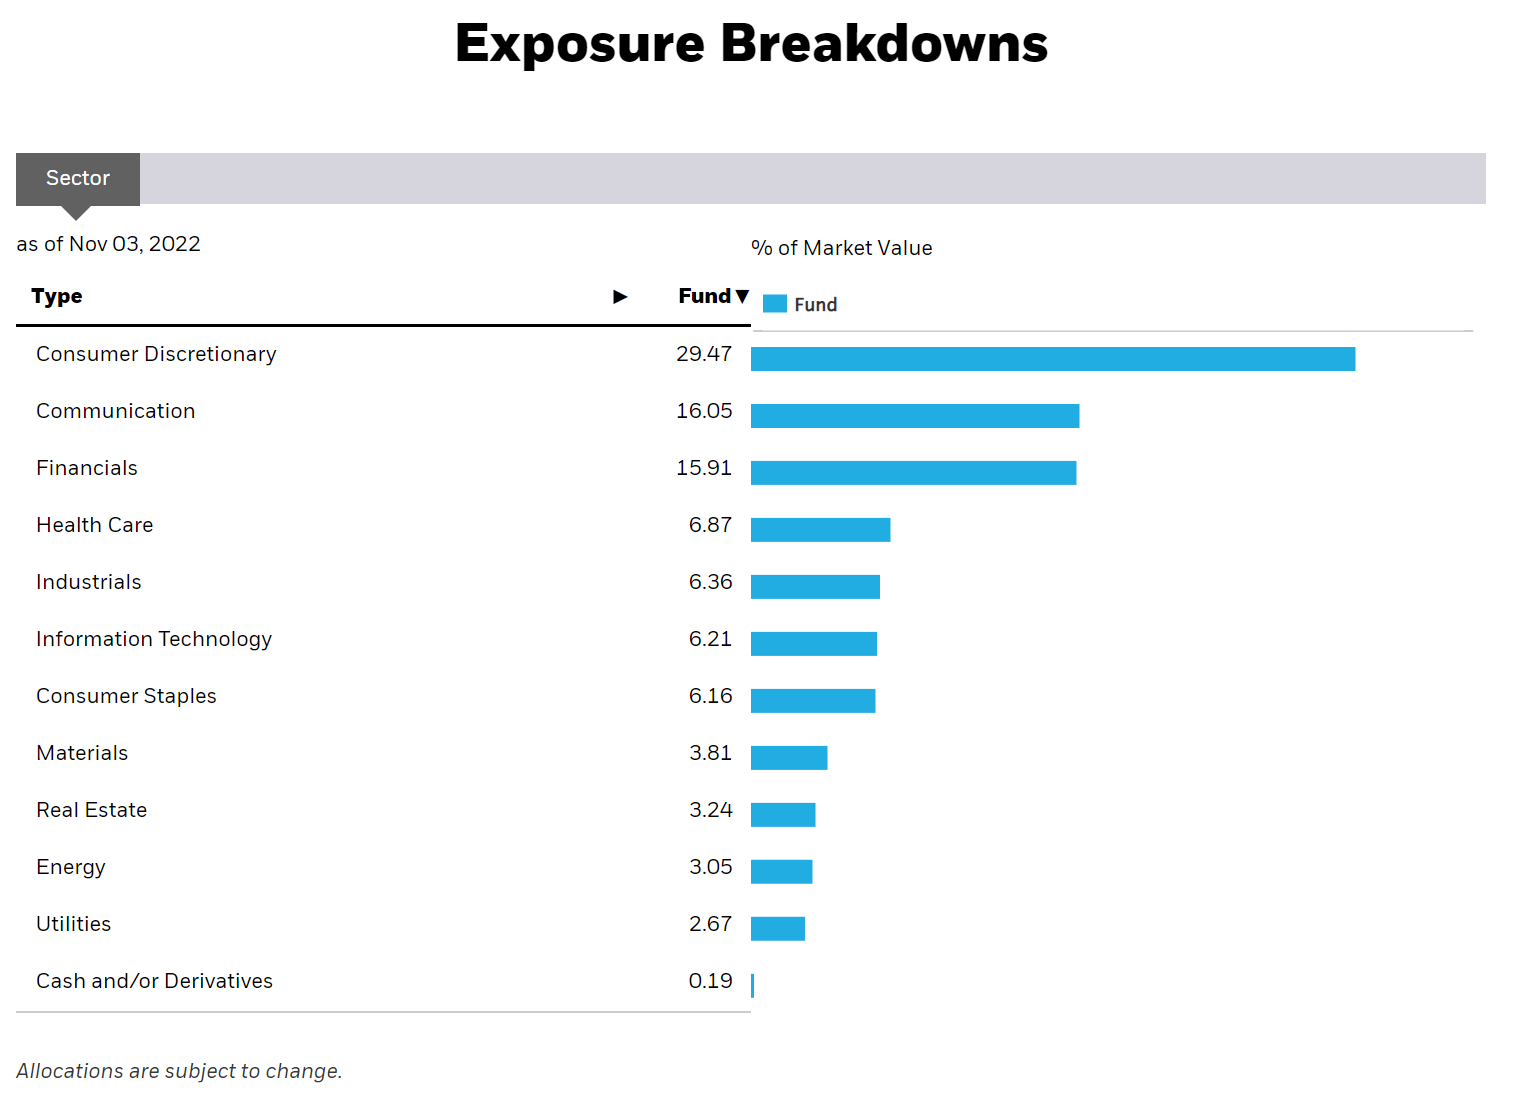
The top 10 holdings of the Fund are shown in Figure 4. They include household names such as Tencent Holdings Ltd. (OTCPK:TCEHY), Alibaba Group Holding Ltd. (BABA), and Meituan (OTCPK:MPNGF).
Figure 4 – MCHI top 10 holdings (ishares.com)
Returns
The past year has not been favourable for Chinese investments and the MCHI ETF, as it has suffered a 36.1% drawdown in the year to September 30, 2022. Longer-term returns have also been very poor for the MCHI ETF, as it has suffered negative 3 and 5 year average annual returns of -7.8% and -6.1% respectively. Even the 10Yr return is barely positive, at only 1.8% per annum.
Figure 5 – MCHI average annual returns (ishares.com)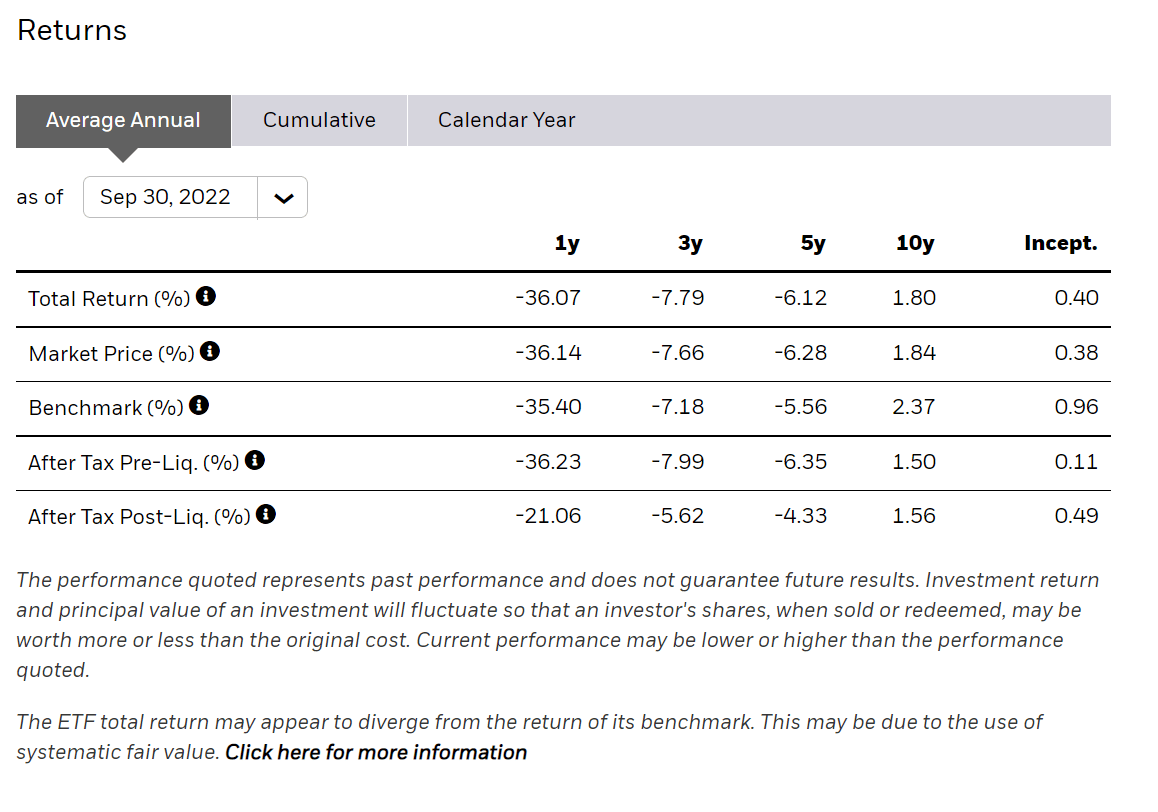
Distribution & Yield
The MCHI ETF paid a trailing 12m distribution of $0.7895 or 1.9% yield (Figure 6). MCHI’s distribution is variable and paid semi-annually.
Figure 6 – MCHI distribution (ishares.com)
Investor Sentiment As Bad As It Can Get
By now, the bear case against Chinese equities is well known. China has been suffering from a 2-year housing crisis that has pushed almost a fifth of its real estate developers into insolvency. The Chinese government have also cracked down heavily against its technology champions in the past few years in a bid to promote ‘common prosperity’. The government’s draconian zero-COVID policies have led to a mass exodus of expats and economic growth far below the official 5.5% rate. Finally, geopolitical risks keep ratcheting higher as the U.S. recently banned the export of high tech semiconductor chips to China. There is also increasing risk/rhetoric that China could invade Taiwan in the near future, with the head of the U.S. Navy saying it could happen before 2024.
Basically, anything that could have gone wrong against Chinese investments seemingly did go wrong in the past few years.
But Is It Time To Be Contrarian?
However, I believe investors may have become overly bearish on China’s prospects and the slightest improvement in any of the negative drivers can cause a massive squeeze as investors rush to cover their shorts.
In the past week, we have seen the beginnings of a thaw in China’s zero-COVID stance. Reputable sources are reporting that China is going to remove penalties against airlines carrying COVID positive passengers. Local governments are also ending free COVID tests. Finally, in recent days, German chancellor Olaf Scholz said that China has agreed to approve the BioNTech (BNTX) COVID vaccine for foreign residents, and may look to approve it for the broader populace.
At the end of the day, China could not remain a closed economy forever. It was always a matter of when and how, not if, the zero-COVID measures will be relaxed. Tactically, the timing of these developments make sense, as President Xi Jinping recently secured a third 5-year term as the leader of the country and can now refocus on restarting domestic economic growth.
Counter-Trend Rebound Underway
In the past few days, all things China-related have been on a tear based on the re-opening news. The Shanghai Composite Index (SHCOMP) gained almost 6% in the past week, while individual equities have rallied even more. The MCHI ETF has been no slouch, gaining 14.1% in the past week. While sharp rallies are prone to pullbacks as speculators take quick profits, I believe there is still a lot of upside left in the theme.
If we take a look at the price chart of the MCHI ETF, we can see technical resistance does not come into play until the multi-year breakdown level at ~$48 / share, which also corresponds to the 150D moving average. This is almost 18% higher from the current price of $40.69.
Furthermore, after a large decline like the one MCHI experienced, from $96 to $35, it is normal for price to retrace 38.2%-50% of the decline, which could see the ETF rebound to $58 to $65 / share in the coming months and still be considered in a ‘downtrend’.
Figure 7 – MCHI still have lots of upside (Author created with price chart from stockcharts.com)
Conclusion
In conclusion, I think investors have gotten too bearish on Chinese equities. Even the slightest improvement in sentiment can spark a large rebound, as we saw from the dramatic equity moves this week. While the 1-week percentage change looks large, in the context of the 60%+ 2-year decline in the MCHI ETF, there is certainly a lot of room for the current rebound to continue.
Be the first to comment