

VladK213/iStock via Getty Images
Introduction
The Toronto-based McEwen Mining (NYSE: NYSE:MUX) released its fourth-quarter and full-year 2021 results on March 1, 2022. On March 10, 2022, the company provided 2022 guidance.
1 – Results Snapshot – Presentation
McEwen Mining counts four producing mines and five development Projects.
MUX: Map assets presentation (McEwen Mining Presentation)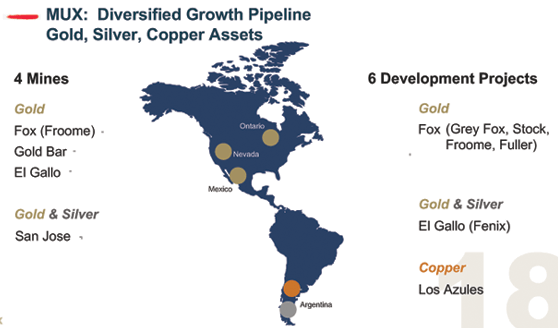
McEwen Mining came out with a fourth-quarter loss of $20.86 million or $0.04 per diluted share.
Revenues were solid at $34.97 million, up from $27.70 million in 4Q20. However, free cash flow from operations was a loss of $7.55 million.
Below are the highlights in 2021:
MUX: Presentation 2021 highlights (McEwen Mining)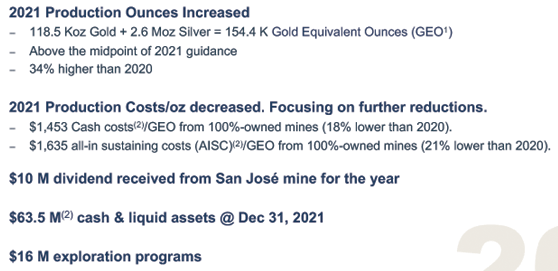
The gold equivalent production at the four producing mines was up 33.4% year over year.
The San Jose, gold bar and Black Fox mines are performing well. The residual leaching activities at El Gallo are expected to wind down in 2022 with approximately 1,500 Au oz left.
MUX: Comparison gold production 4Q20 4Q21 (Fun Trading)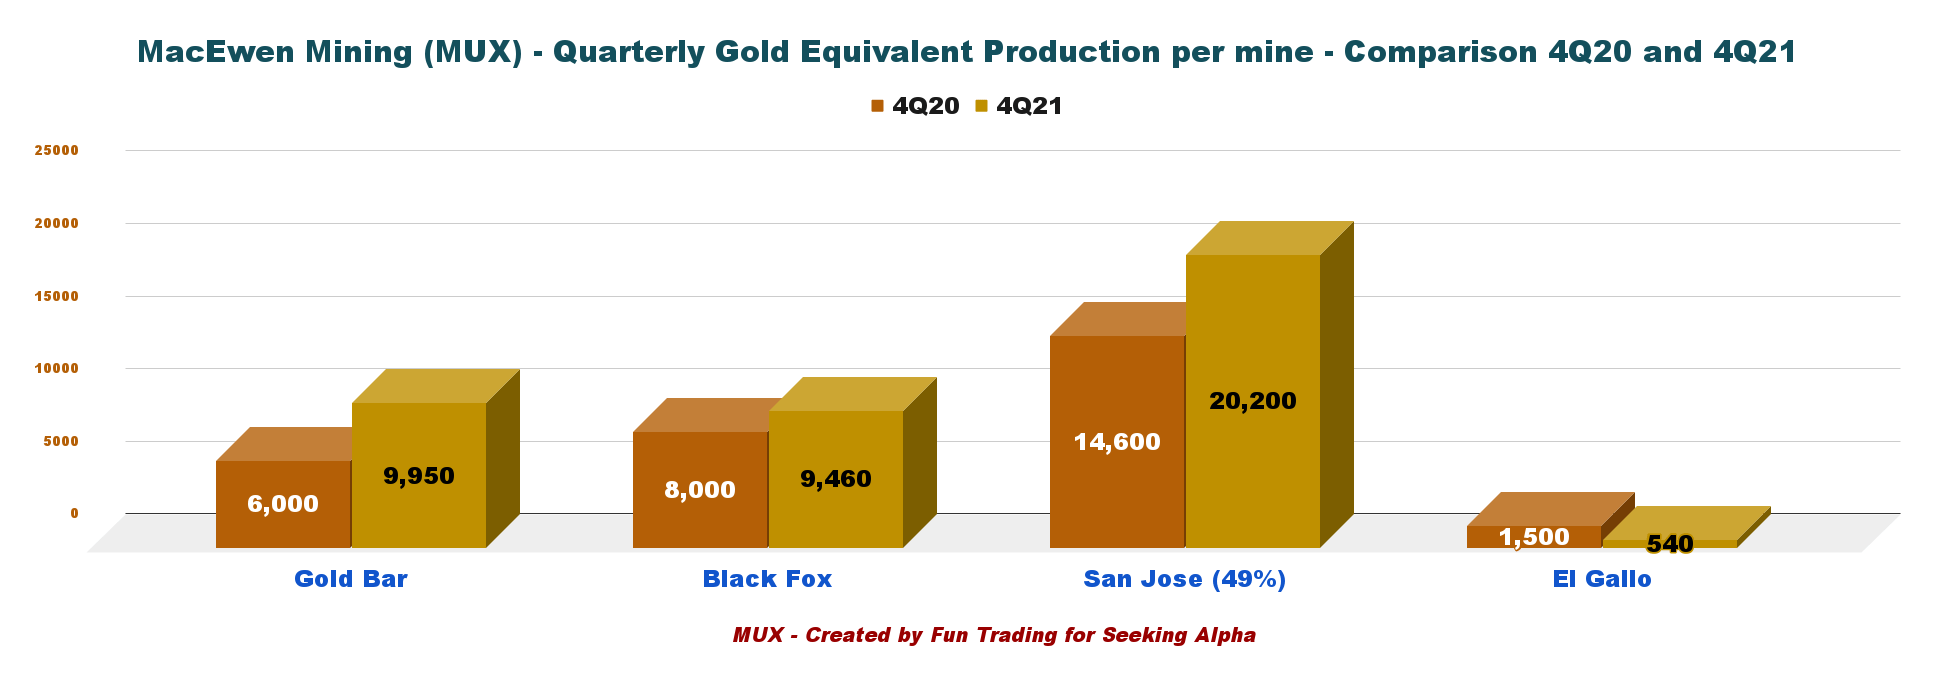
2 – Investment Thesis
The investment thesis for McEwen Mining is a difficult one. I see a lot of potential down the road but the balance sheet is not appetizing, with a free cash flow recurring loss and dismal AISC.
On the bright side, the company is increasing gold production significantly and should generate some free cash flow soon with the gold price now well over $1,900 per ounce.
It is prudent to trade short term the stock here and keep only a small core position long term.
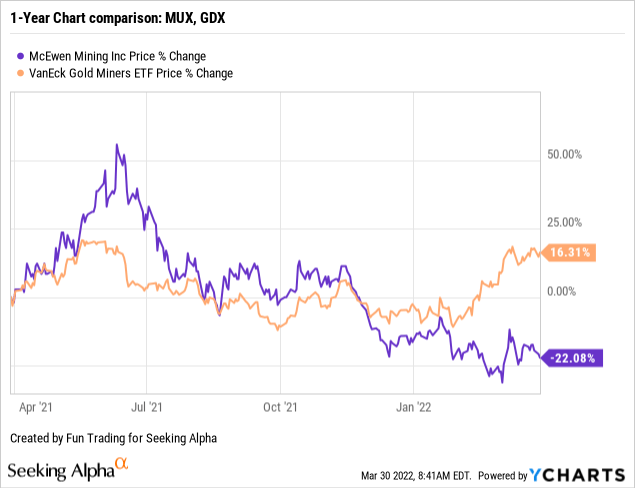
3 – Stock Performance
MUX is down 22%. However, the stock performance has suffered a significant drop since June.
CEO Robert McEwen said in the conference call:
In 2021, we had a number of notable steps of improvement. We increased our production, lowered the cost, cost per ounce at our operations delivered positive exploration results along with a preliminary economic assessment for our Fox complex showing that there’s a 10 year life out in front of there and we created McEwen copper to fund the advancement of our losses of this copper project.
MUX – Financial Snapshot 4Q21: The Raw Numbers
Note: Numbers are indicated in US$.
| MUX | 4Q20 | 1Q21 | 2Q21 | 3Q21 | 4Q21 |
| Total Revenues $ million | 27.70 | 23.74 | 40.71 | 37.13 | 34.97 |
| Quarterly Earnings $ million | -23.54 | -12.47 | -5.99 | -17.40 | -20.86 |
| EBITDA $ million | -14.94 | -9.31 | 0.19 | -10.77 | -12.56 |
| EPS (diluted) $ Per Share | -0.06 | -0.03 | -0.01 | -0.04 | -0.04 |
| Operating Cash Flow $ million | -2.60 | -10.14 | 2.07 | -11.0 | -1.2 |
| CapEx in $ | 4.07 | 10.09 | 10.29 | 8.11 | 6.41 |
| Free Cash Flow | -6.67 | -20.23 | -8.22 | -19.11 | -7.55 |
| Total Cash in $ million | 20.84 | 47.40 | 44.01 | 64.94 | 56.09 |
| Total LT Debt in $ million | 48.16 | 48.33 | 48.50 | 46.68 | 48.87 |
| Shares Outstanding (diluted) | 409.02 | 441cash | 459.19 | 459.19 | 459.24 |
| Gold and Silver Production | 4Q20 | 1Q21 | 2Q21 | 3Q21 | 4Q21 |
| Quarterly Gold Equivalent Oz GEOs | 30,100 | 30,600 | 40,800 | 42,860 | 40,150 |
| Quarterly Au Production Oz | 24,100 | 23,300 | 31,700 | 32,100 | 31,300 |
| Quarterly Silver production Oz | 532,400 | 493,200 | 611,800 | 792,000 | 682,700 |
Source: Company release 10K filing
McEwen Mining – Gold Production and Balance Sheet Details
1 – Revenues and Trends. Revenues were $34.97 million in 4Q21.
MUX: Chart quarterly revenues history (Fun Trading)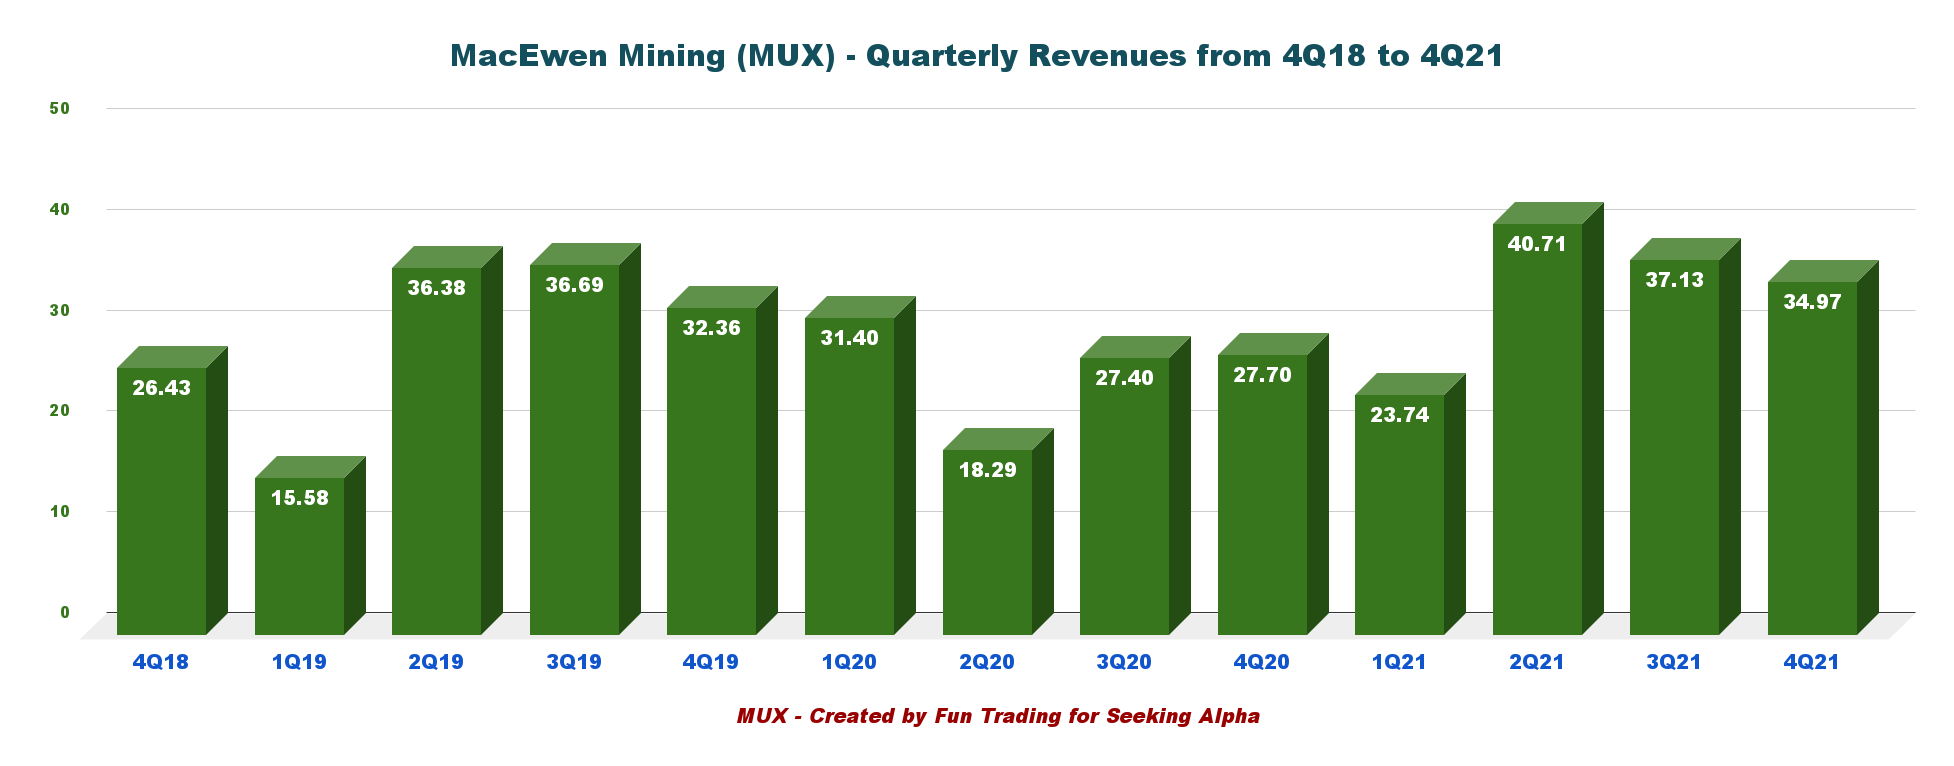
The fourth-quarter revenues were $34.97 million, up from $27.70 million in the same quarter a year ago. Net loss was $20.86 million or $0.04 per diluted share. Cash from operations was a loss of $1.15 million.
McEwen Mining received $2.3 million in dividends in 4Q21 from the San José mine.
The company received $40 million corresponding at the first tranche of the series B private placement for McEwen Copper and another $2.6 million for the second tranche.
We received proceeds in the amount of $40.0 million relating to the first tranche of the series B private placement for McEwen Copper and $2.6 million received in advance from the ongoing second tranche financing. As of December 31, 2021, McEwen Mining controls 81.4% of the common shares outstanding of McEwen Copper.
McEwen Mining will own 69% post-financing:
MUX: Los Azules copper project (McEwen Mining)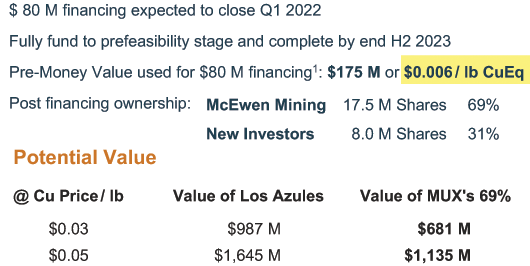
2 – Free cash flow was a loss of $7.55 million in 4Q21.
MUX: Chart Quarterly Free cash flow History (Fun Trading)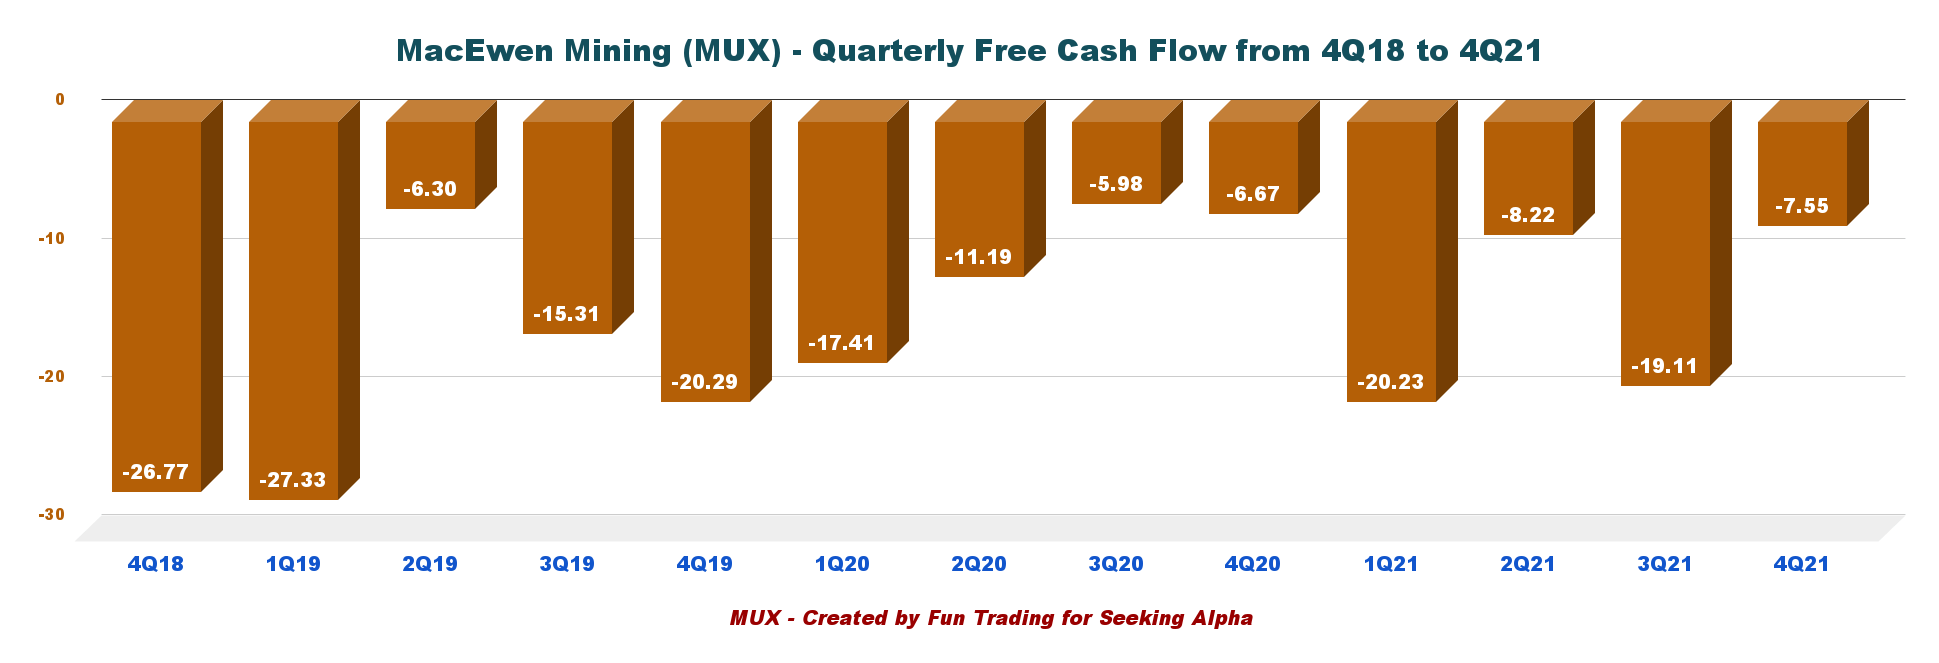
Note: Generic free cash flow is the cash from operations minus CapEx. It may differ from the company calculation.
Trailing 12-month free cash flow ttm was a loss of $55.11 million, and the free cash flow for the fourth quarter was a loss of $7.55 million.
3 – Excellent debt position.
MUX: Quarterly cash versus debt history (Fun Trading)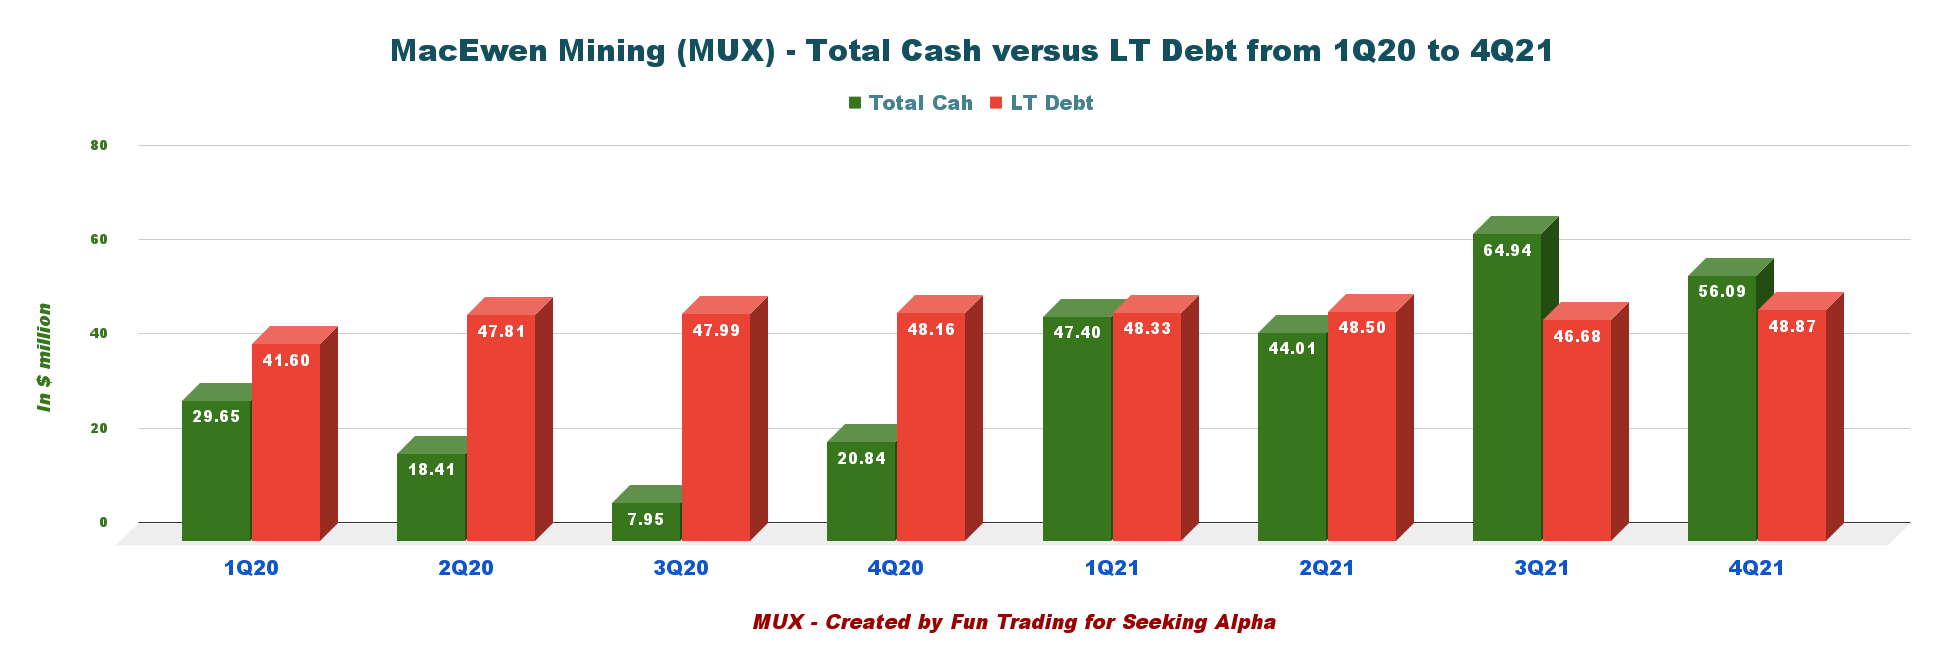
The total cash (including investment of $1.806 million, but not the precious metal owned of about $1.018 million) was $56.09 million at the end of December 2021.
Long-term debt is $48.87 million.
4 – Gold Equivalent production details. The company produced 40,150 GEOs in 4Q21.
MUX: Chart GEO production history (Fun Trading)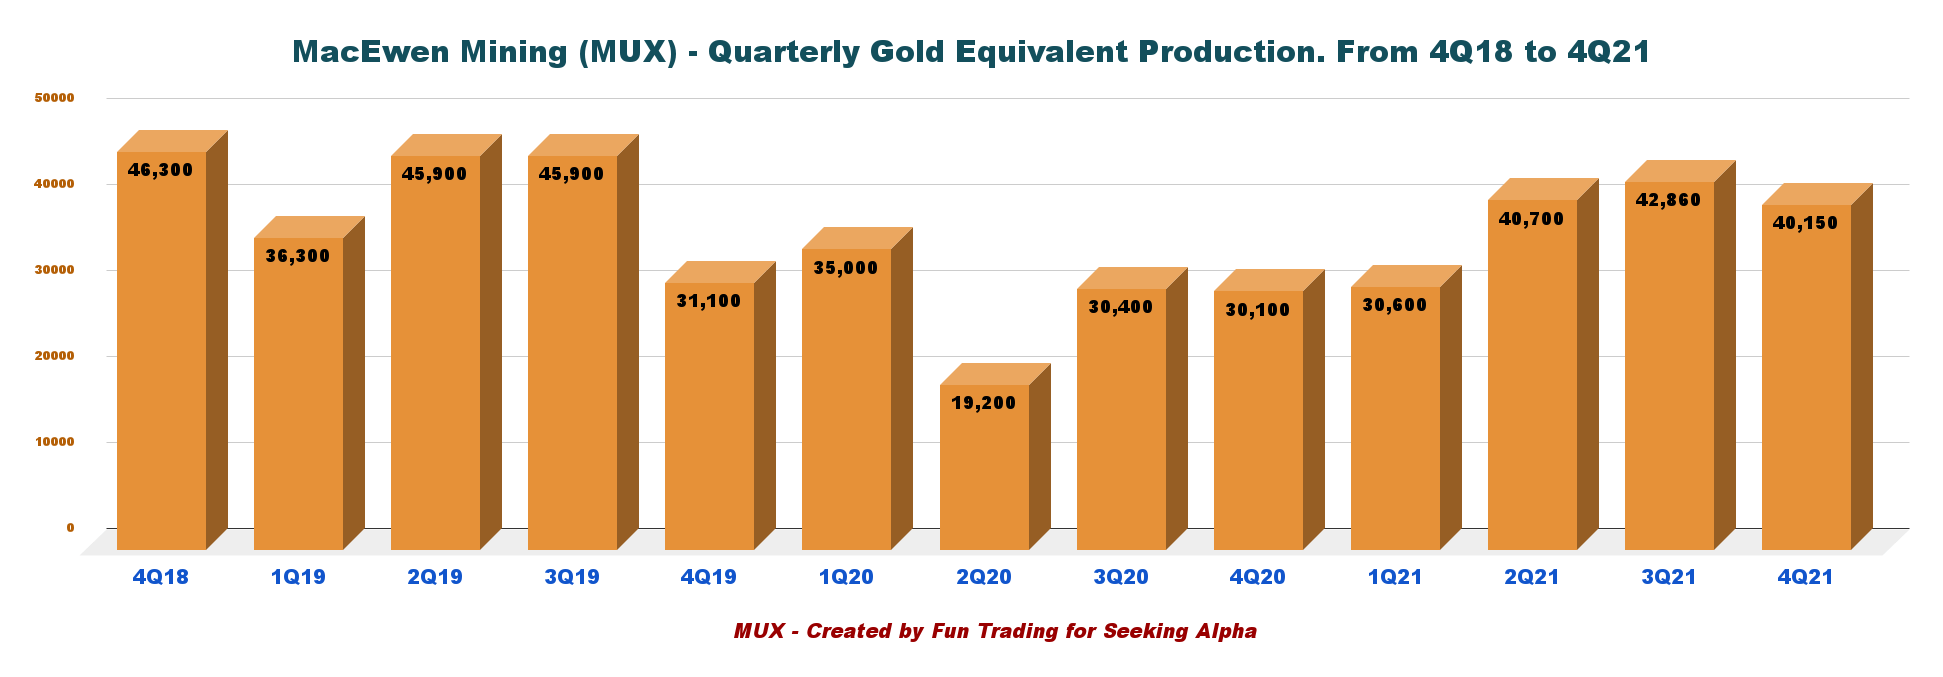
The consolidated production for 2021 was 154,410 GEOs above the midpoint of the guidance for the year and about 34% higher than 2020.
Cash costs per GEO sold in 2021 were $1,453 per GEO, representing an 18% decrease over last year and all-in sustaining costs were $1,635 per GEO or 21% below 2020.
Production details per mine:
MUX: Chart quarterly GEO production per mine history (Fun Trading)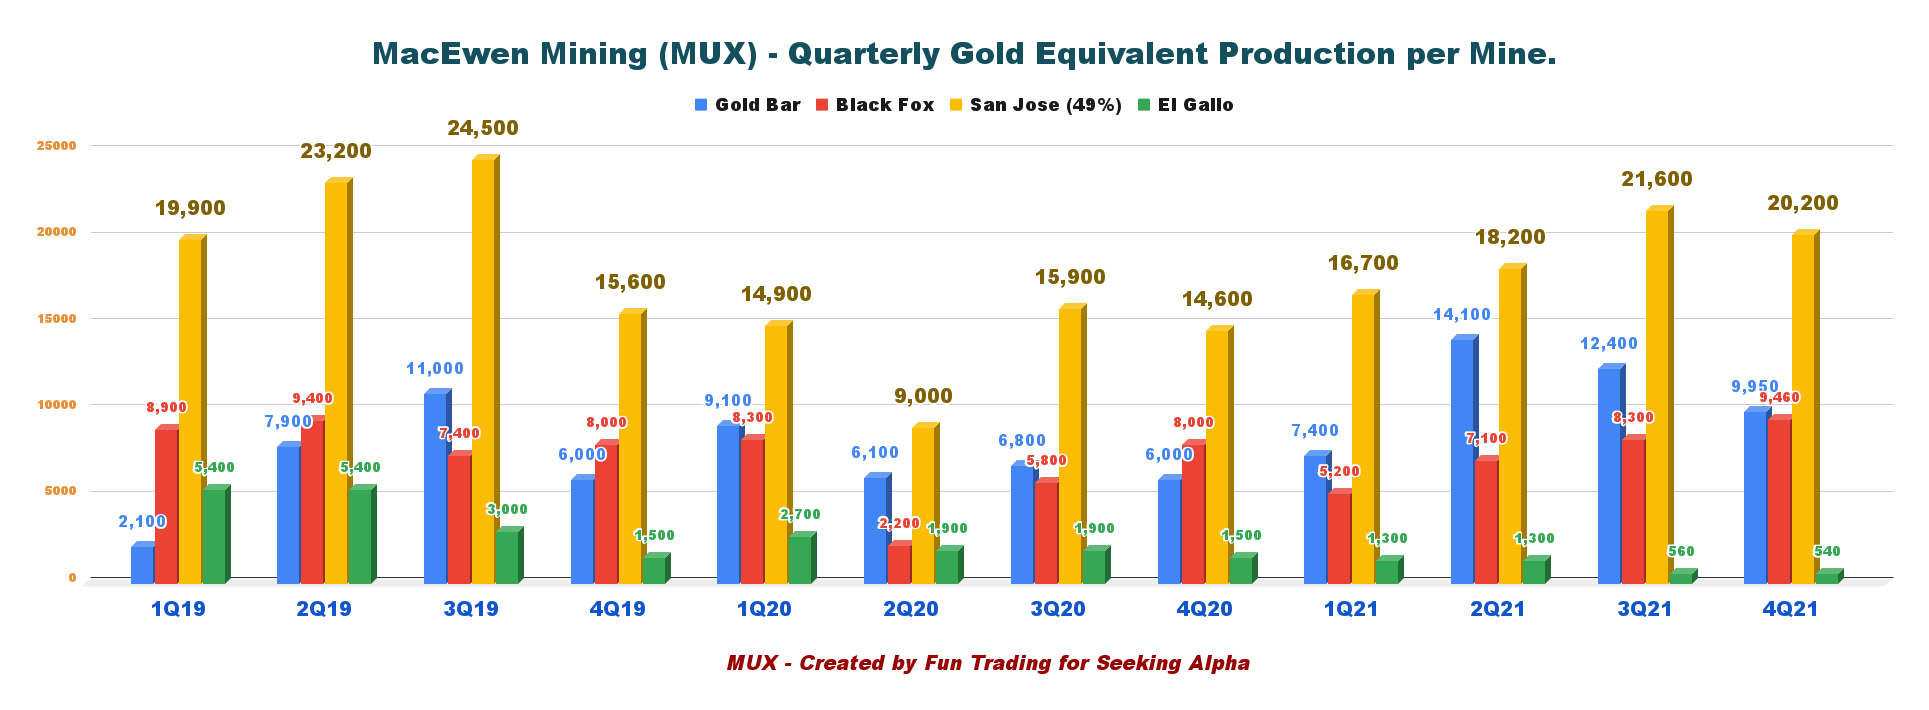
Gold Equivalent production was good with 40,150 Au Eq. Oz, up significantly from 30,100 Au Eq. Oz in 4Q20, as shown in the chart above.
5 – All-in Sustaining costs – AISC and gold price received for 4Q21.
MUX: Chart quarterly gold price and AISC (San Jose) history (Fun Trading)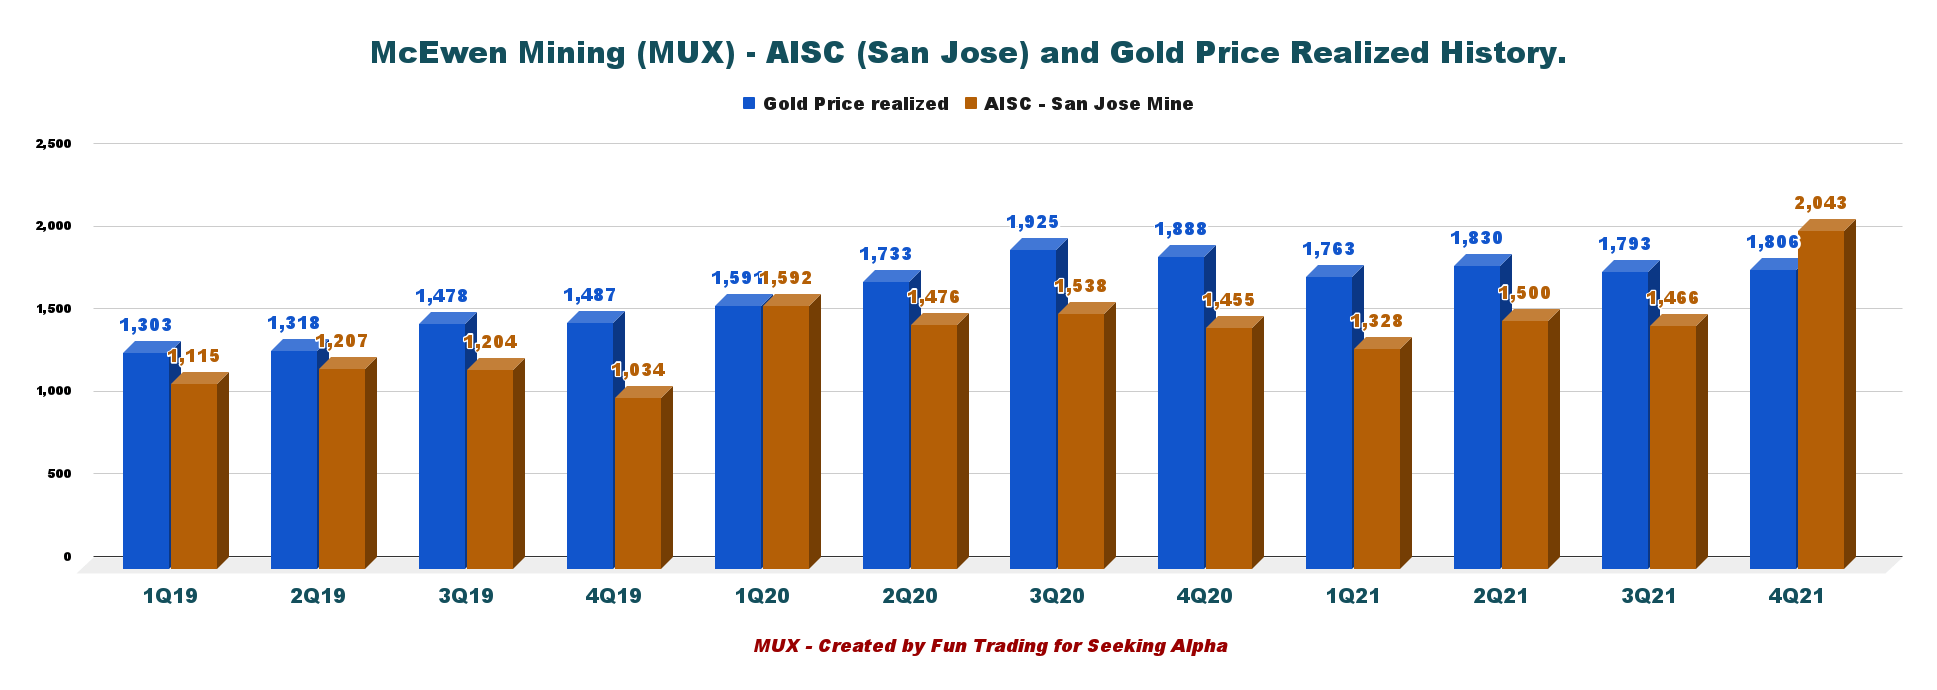
AISC is exceptionally high and is not enticing for a long-term investment. The average AISC of most of MUX’s peers is under $1,000 per ounce. AISC at the San Jose mine was $2,043 per ounce.
The change in Q4/21 compared to Q4/20 arose from a $15.1 million decrease in gross profits largely attributed to the COVID-19 expenditures during Q4/21. (10-K filing)
6 – 2022 Guidance and Fox complex Production/LOM
The company expects production of 153K to 172K GEOs in 2022.
Cash costs and all-in sustaining costs (AISC) per GEO sold for 2022 from the company’s 100%-owned mines (Gold Bar and Fox) are expected to be in the range of $1,310-1,410 and $1,570-1,690, respectively.
At San José, production is estimated to be 69.5K to 77.5K GEOs at an AISC per GEO sold of $1,330-1,370.
MUX: 2022 guidance presentation (McEwen Mining)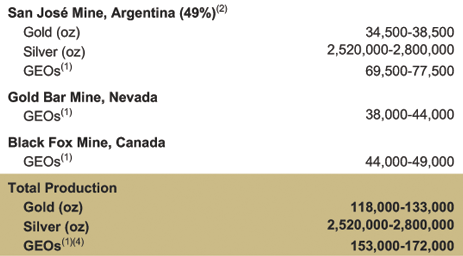
The Fox Complex PEA outlined the potential to extend the mine life by 9 years, generating average annual production of 80,800 gold ounces at average cash costs and AISC per ounce of $769 and $1,246, respectively.
MUX: FOX expansion project presentation (McEwen Mining)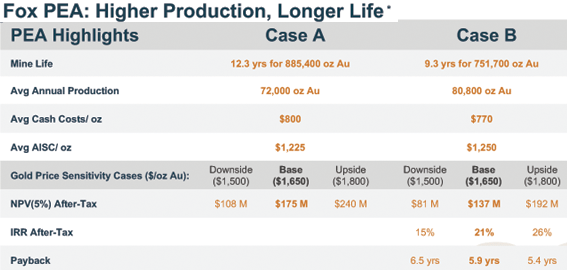
Technical Analysis (short term) and Commentary
MUX: TA chart (Fun Trading)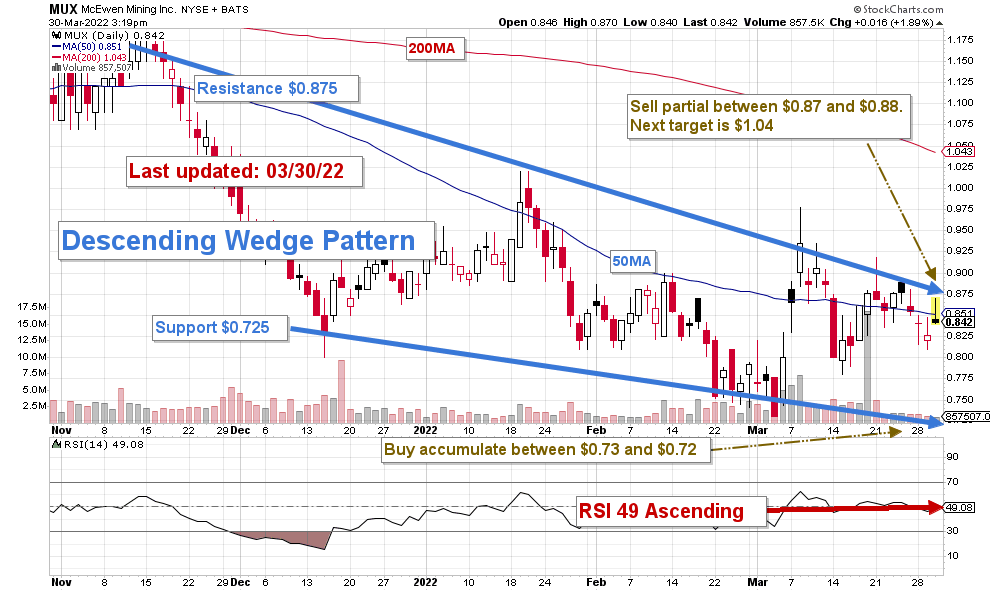
MUX forms a descending wedge pattern with resistance at $0.875 and ascending support at $0.725.
The trading strategy I suggest is selling LIFO about 65% of your position between $0.87 and $0.88. Also, accumulate on any weakness between $0.73 and $0.72.
The strategy buy-sell-rinse-repeat is the best path right now. If you are successful, I recommend keeping your gain in MUX and keep adding. In this case, you can build up a core long-term position at no risk.
I suggest looking at the RSI(14) to pinpoint period of divergences and signals (overbought/oversold).
If the gold price turns bullish in the next few months and retests $2,000 per ounce, MUX will probably cross the resistance and retest the range of $1.04-$1.10, at which point, it would be prudent to sell about 75% of your position.
Conversely, if gold turns bearish and crosses $1,850 per ounce, I see MUX dropping below $0.72, where I could consider starting a small long-term position.
Watch the gold price like a hawk.
Warning: The TA chart must be updated frequently to be relevant. It is what I am doing in my stock tracker. The chart above has a possible validity of about a week. Remember, the TA chart is a tool only to help you adopt the right strategy. It is not a way to foresee the future. No one and nothing can.
Author’s note: If you find value in this article and would like to encourage such continued efforts, please click the “Like” button below as a vote of support. Thanks!
Be the first to comment