

MF3d
Letter from the Managing Director
Our Performance – General Commentary
For the three months ending September 30, 2022, the Mayar Responsible Global Equity Fund (Class A) was down -11.69% net of all expenses and fees, while the MSCI World Index declined by -6.19% in the same period. Since its inception in May 2011, the Fund has seen a 130.70% increase versus a 120.84% increase for the MSCI. That corresponds to a 7.62% annualized rate of return the Fund, compared to 7.21% for the MSCI.
High market volatility has continued during this quarter as the pain caused by a combination of supply shocks, high inflation, and increasing interest rates; while the war in Ukraine is ongoing.
Our underperformance in the quarter has brought our year-to-date performance to below our benchmark. This was the inevitable effect of our higher exposure to European and UK stocks during a period where the decline both of the Euro and the British Pound against the US Dollar have accelerated (though arguably it is better to view this as the US Dollar getting stronger, given that most currencies have been affected).
While this is causing our portfolio some short-term pain, we believe it will translate into medium-to long-term gains because of two currency-related effects.
First, many of our European holdings do a lot of business outside Europe. A lower Euro makes their products and services cheaper when compared to their American-based competitors. Think of all the people you know who have gone on holiday in Europe this year. This gives them an edge over their American competitors.
The second way European companies benefit is the translation effect of the currency, which is even more interesting.
Let me give you a theoretical example to further illustrate this effect. Imagine four companies selling various tools, each company generating half their sales in the Unites States and half in Europe. All are facing the same situation – a 20% decline in the Euro- US Dollar exchange rate. I’ve also assumed they all had a 10% net profit margin last year. Let’s call them:
- Atlanta Hammers, Inc., based in Atlanta, Georgia, United States
- Boston Wrenches Corporation, based in Boston, Massachusetts, United States
- Amsterdam Screwdrivers N.V., based in Amsterdam, the Netherlands
- Berlin Pliers AG, based in Berlin, Germany
Though all four companies sell equal amounts of their products in the United States and Europe, you’ll soon see some very important differences according to the currency the companies report their financial statements in and where they manufacture their products.
Even though Atlanta Hammers sold the same number of hammers this year as last, its reported sales, due to the decline in the exchange rate of the Euro, will decline by -8.3% in US Dollar terms. Further, the company manufactures half its products in Europe and so the cost of making them will also decline in US Dollar terms and therefore the firm’s profits will decline by the same amount of -8.3% for the year. Not great, but acceptable given the circumstances.
Amsterdam Screwdrivers, on the other hand, also sold the same number of tools as last year. But because it reports in Euros, it will show an increase of 10% for its global sales, in Euro terms. Because the firm happens to manufacture half of its production in a facility in the United States where the cost, in Euro terms, will increase compared to last year, Amsterdam Screwdrivers will also report a profit increase of 10% for the year, in line with the change in sales. Not too bad.
Likewise, Boston Wrenches has experienced flat sales volumes this year, selling the same number of wrenches as last year. It will therefore report the same -8.3% decline in sales as Atlanta Hammers. However, even though the company generates half its sales in Europe, it manufactures 75% of its products in a facility in South Boston. Because three-quarters of its costs are in US Dollars, they will not decline by much. As a result, the drop in Boston Wrenches’ will cause profits to decline by a gut-wrenching 46% (pun fully intended)!
Finally, Berlin Pliers AG also saw a flat demand for pliers this year (obviously there is a close correlation between various DIY and professional tools). Its revenues, like Amsterdam Screwdrivers, will increase by 10% in Euro terms. But as this German firm manufacturers 75% of its pliers in a large facility in Brandenburg, its costs have also gone down with the Euro and it will end up reporting a mouth-watering 55% increase in profits!
You can see from the above example that US companies have been hurt by the declining Euro, and European companies have benefitted. But the impact was a lot larger for companies with a mismatch between the geographic distribution of their sales compared to that of their costs.
In our view, markets have not fully appreciated the impact described above, so it’s not yet reflected in the stock prices of those European companies doing a lot of business internationally, and vice versa for their US competitors. While, for illustrative purposes, I’ve probably used too high a cost-mismatch in the examples above, the real-world effects will still be material even if not as high.
Some of our portfolio companies are already talking about these effects on business. In a recent interview with CNBC Christian Klein, SAP’s CEO, commented; “our biggest competitors are in the U.S., so the strong dollar actually benefits us. We have a huge tail wind coming from currency.” You can read/watch the full interview here.
Mmm… Bear Market!
“You make most of your money in a bear market; you just don’t realize it at the time”
Shelby Davis, legendary value investor
As value investors, one of the things we closely track is, quite naturally, valuation levels (hence the name). Our job is to continuously compare the valuations of the companies in our portfolio to the other companies we follow. We then allocate your capital to the most attractive opportunities available at the time. If we don’t find enough opportunities that are sufficiently appealing for a fully invested portfolio, we hold onto the cash until we find a suitable place to invest it.
As a result, cash levels in our portfolio have, over the years, been negatively correlated with the number of attractive investment opportunities we could find at any time, not because we were making macro-driven market-timing decisions but rather as a by-product of our disciplined value-based investment process.
Today I would like to share with you a chart our team has put together to show the relative attractiveness of our portfolio at various points over the past five years. We chose to present this period due to the detailed data available but the general conclusion still holds when looking at our history since the time of the Fund’s inception.
The relative attractiveness of our portfolio at various points over the past five years (Source: Mayar Capital data, 10th October)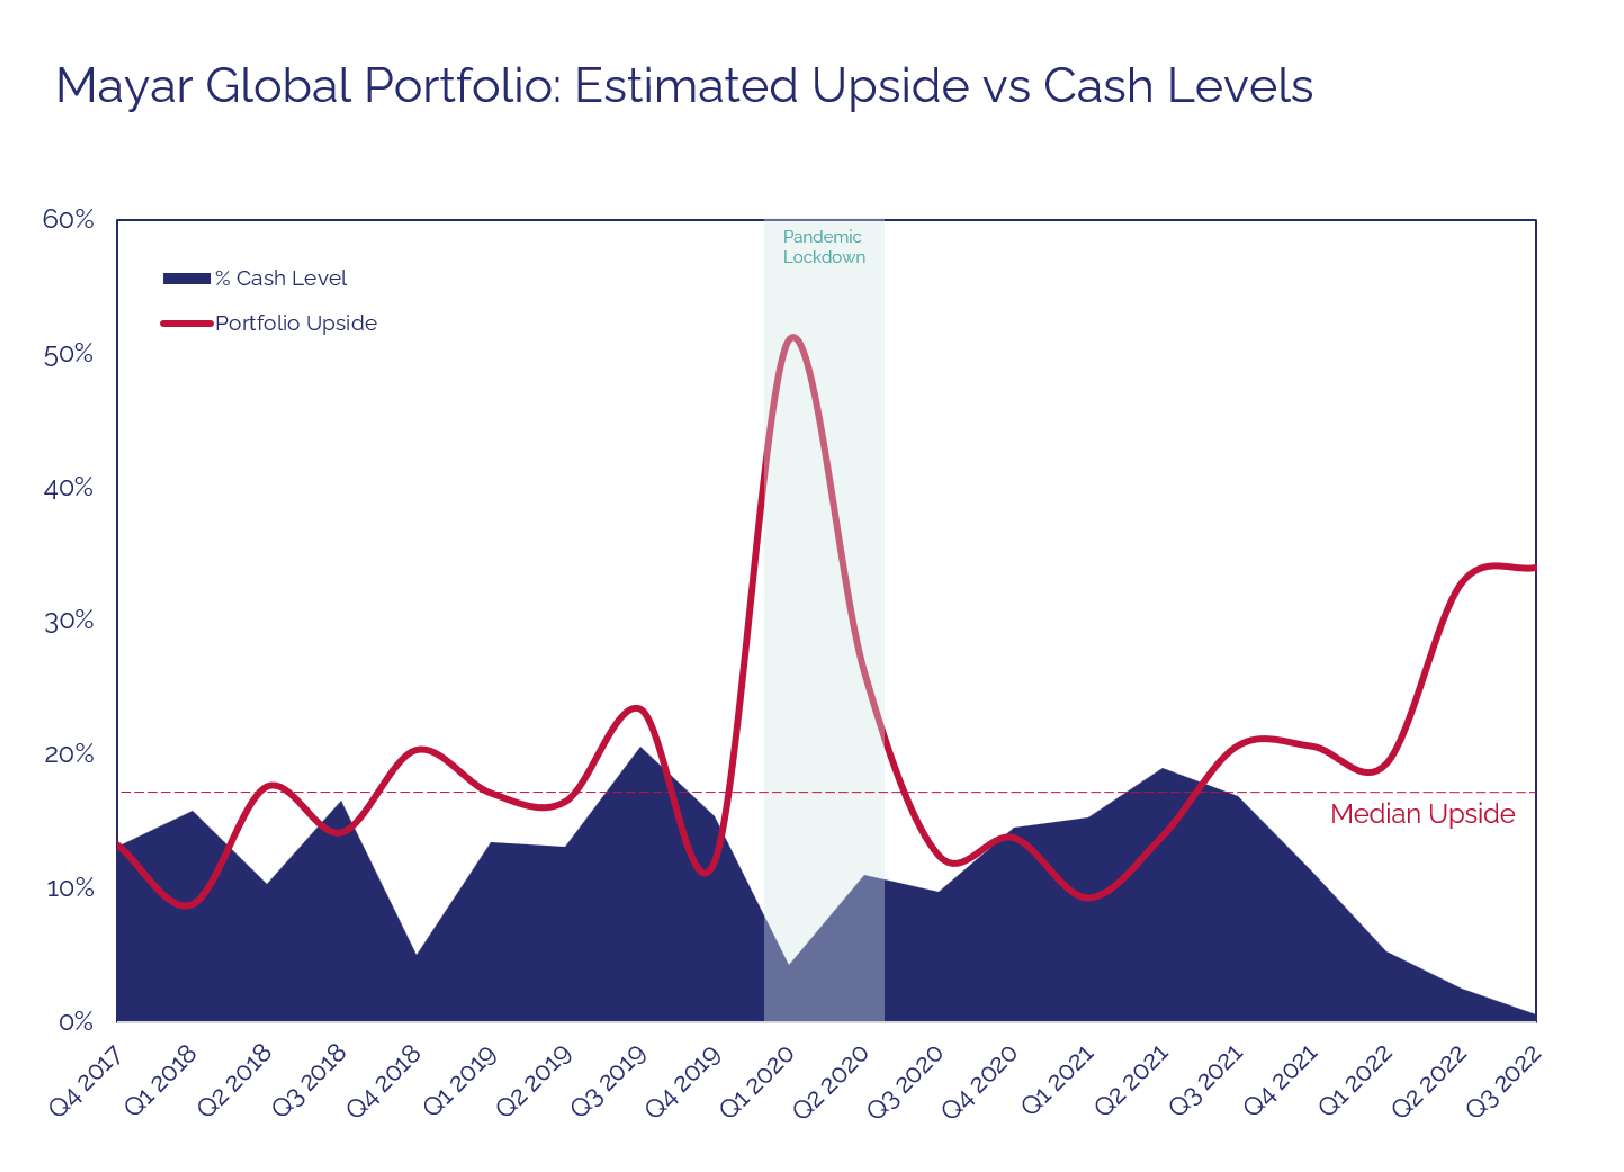
The red line shows you the estimated upside expected in our portfolio for each quarter, based on our estimates of the intrinsic value of various portfolio companies. The dotted line is the median upside over the whole period, which is approximately 17% (note: in practice we actually use a range of intrinsic value estimates but here I’ve taken the mid-point of those ranges for simplicity).
You can draw two conclusions from this chart. First, except for a brief period early in the pandemic, our current portfolio has the largest estimated upside. Further, we believe that on a risk-adjusted basis, the current situation is far more attractive than it was at the end of March 2020 when we’d just entered the completely unchartered territory of global lockdowns. The pandemic forced many companies to halt their operations – resulting in zero revenues in many cases – and with no idea of when they’d be allowed to resume their business operations.
You’ll also see that at every point in the past five years, our cash level rose as valuations became less attractive, then we deployed that cash as opportunities improved in subsequent periods. We’re now fully invested and believe that today’s market levels present the best buying opportunities seen for many years.
I am by no means claiming that markets have hit rock bottom; history teaches us that it’s near impossible to predict that or know when they’ll recover. But we do know that great buying opportunities come along only in periods of economic and political distress when investors are driven by fear. Fixated on the immediate short term, they’re blind to any attractive opportunities for the longer term. In such times one must become a contrarian and, as Warren Buffett said, “Be fearful when others are greedy. Be greedy when others are fearful.”
This contrarian approach is by no means easy. If it were, everyone would be doing it. Let’s not kid ourselves; today really doesn’t feel like the time for optimism. That’s why investors who can see beyond the next few months to the long-term can purchase stocks today at bargain prices. I’m confident that such investors will be rewarded for their patience.
The Mayar team and I have been bargain hunting on your behalf over the past few months, filling our shopping carts, nay portfolios, with wonderful businesses in leading industry positions and with long-term growth potential. In other words, I’m confident that some very good outcomes will emerge from the gloom!
Our Portfolio
We took advantage of the market decline during the quarter and added to several of our holdings that have reached what we believe to be extremely attractive levels.
We increased our investment in SAP (SAP), Brenntag (OTCPK:BNTGF), Vistry (OTCPK:BVHMF), Bright Horizons (BFAM), and Wickes. To take advantage of these opportunities we further trimmed our holdings in Johnson & Johnson (JNJ).
The Fund and The Company
Our Investor Relations team continues to work on simplifying your investment journey with us. We recently partnered with GB Group to use their identity verification software to streamline our investor KYC process and reduce onboarding times. We also launched an easy, web-based, and mobile-friendly additional subscription form, which you can access through the “fund info” section on our website. Finally, by collaborating with our vendors Twilio and Front, we’ve improved the security and response times on our WhatsApp channel.
We continue to look for like-minded investors to join our investment journey and welcome any introductions if you know anyone who would be a good fit.
Mayar Capital ended the quarter with $217,452,454 in Assets Under Management (AUM).
As always, if you have any questions, please don’t hesitate to reach out to us. Thank you for your continued support and trust.
Best regards,
Abdulaziz A. Alnaim, CFA Managing Director
Business Summaries: Alphabet (GOOG, GOOGL)
Headquarters: Mountain View, California, USA
Founded: 1998 as Google
In early January this year – which admittedly feels like eons ago – US President Joe Biden was pushing Americans to take up the government’s offer of free COVID tests to help tackle the surging omicron variant. How did Biden respond when citizens asked about the availability of these tests?
“Google it!”1
This advice, undoubtedly well-meant, was roundly scoffed at by the press, however. It seemed too obvious to be very helpful.
Anyway, the anecdote serves to introduce you to one of our largest holdings, Alphabet; the parent company of Google. Note that first, Alphabet’s original and core product – its search engine – has entered our common vocabulary as a verb. ‘Googling’ something has the same meaning as ‘researching’ or ‘finding an answer to’ something. Second the reason Biden’s advice was met with such opprobrium was because Googling something has become almost second nature to us now.
These two observations reveal a lot about Google’s strength in the search engine market, in which it has a share of over 90 percent. Because internet search is almost the prototypical network, Google has benefitted from – and we think is also protected by – the huge competitive advantage its scale brings – both to those asking the questions and those providing the answers. The Google search platform becomes increasingly useful to anyone seeking information as a greater volume of stuff becomes available. This starts a virtuous cycle that results in a colossal market share for Google itself. In the language of business strategists, Google benefits from vast network effects.
Because Google’s search results are viewed by billions of eyeballs every day, its search page ‘real estate’ is understandably very valuable to those with goods and services to sell. Advertising revenues from this ‘real estate’ as well as that from its other properties such as Mail, Maps, and so on, totaled almost USD 150b in 2021; amounting to almost 58% of the company’s revenues. Ad sales on YouTube, also owned by Alphabet, brought in another USD 28b. With the secular shift of the advertising spend to digital channels – over which Alphabet has a tight grip – we estimate the company has a share of around 40 % of the digital advertising market and is probably the most valuable advertising property in the world.
The final piece of Google’s advertising ecosystem is its suite of products such as AdSense, which it provides to website owners wanting to sell advertising space on their properties. We estimate that Google pockets about 33 percent of every $1 in the advertising sales generated by these partner websites. By having such a lengthy list of advertisers looking for space, Google is able to match advertisers with website owners for their mutual benefit.
Altogether, Google’s various advertising businesses pull in over four-fifths of the company’s revenues, and are hugely profitable, with operating margins consistently above 25% and returns on invested capital clearing 20 %,and that’s after capitalizing research & development costs.
While Google itself represents the largest chunk of Alphabet’s business, there are a couple of other businesses worth mentioning – Google Cloud and Other Bets.
Alphabet came late to the Cloud game, with the public roll-out of the Google Cloud Product in 2013, some seven years after Amazon (AMZN) had released AWS and three years after Microsoft (MSFT) launched Azure. As a latecomer, Google is up against two behemoths in the form of Amazon’s AWS (which made USD 20b last quarter versus Google Cloud’s USD 6b) and Microsoft’s Azure (which made an estimated USD 12.5b last quarter). Given the fixed cost nature of running a business like this, Google Cloud Product is still making a loss, though given the strong growth (sales have more than doubled over the past couple of years), losses are narrowing and the business is expected to break even in the next year or two.
Meanwhile, the more sceptical observers have described Other Bets, also part of the Alphabet empire, simply as an expensive hobby. Other Bets may be viewed as a VC-type accelerator that invests in small (usually loss-making) businesses that could become material to the company in the future. This division is serially unprofitable, but the losses barely move the needle for Alphabet as a whole. Other Bets’ ventures range from the artificial intelligence company DeepMind – now very profitable from private company accounts – to the smart home appliances company Nest, to self-driving pioneer Waymo. It’s worth noting that DeepMind, according to its private company accounts, pulled in over GBP 100m in net profit last year, a doubling from the year before. We are not technologists and cannot say which of these will be profitable in the long term. But innovation doesn’t happen in a straight line, and given the natural tendency for huge (and hugely profitable) companies like Alphabet to rest on their laurels, at least they’re not getting lazy.
Footnotes1 To be precise, he said: “Google…COVID test near me…to find the nearest site where you can get a test most often and free.” |
Be the first to comment