

Sakorn Sukkasemsakorn
President’s message
Happy New Year!
While I can’t deny that the last few years have been challenging – COVID-19, inflation, higher interest rates, and the subsequent market volatility – I am proud of the Mawer team as they dug deep, and showed a tremendous amount of flexibility, dedication, and resilience.
Despite the tumultuousness of 2022, the firm continued to be quite active. A few highlights:
- We welcomed 35 new team members to the firm
- Eight team members became new owners of the firm
- We launched our first private equity fund, Mawer Partners LP, in Q1 to internal investors. We anticipate making the Fund available to external investors in late 2023/early 2024
- Notable Environmental, Social, and Governance efforts included: refreshing our Responsible Investing Policy and Proxy Voting Guidelines to clarify our approach and becoming a signatory of the CFA Institute Diversity, Equity, and Inclusion Code
- We hosted our first firm “Hackathon” – over 200 team members attended the event with the objective to better understand and evolve our culture while strengthening interpersonal relationships
- We completed construction on a new Toronto office location which opens in January 2023
- In 2020 we selected SimCorp Dimension (SCD) – an integrated, multi-asset platform specifically developed for investment managers – and began implementing its solutions across our front, middle, and back offices. The platform is going live in early 2023 and we feel confident SCD will provide the operational efficiencies required to support Mawer’s future growth and add value for our clients
- We made significant contributions back to our communities – providing over $2.7 million dollars of support to over 200 different charitable organizations
And, although the past year proved a most challenging economic backdrop, our research team continued to lean into the philosophy we’ve kept consistent for nearly 50 years. Bear markets are never fun, but they happen, and we have successfully navigated many of them in the past and I believe this time will be no different.
On behalf of myself and everyone at Mawer, I would especially like to convey my sincere appreciation to you, our clients – your continued support has meant a great deal. And a big thank you to those who completed our client satisfaction survey. It is always of utmost importance that we understand how we can improve in order to make your experience with Mawer second to none.
Here’s to a happy, healthy, and prosperous 2023!
Craig Senyk, President
Market overview
Equity markets had a positive return in the fourth quarter offering a brief reprieve from the turmoil that roiled markets in 2022 – although December saw many give back some of these gains. And, after one of the worst years on record, Canadian bonds finished near flat for the quarter. In the end, 2022 goes down as a difficult year for financial markets dominated by widespread inflation, higher interest rates, geopolitical tensions, and global growth concerns. The Bank of Canada and the U.S. Federal Reserve continued to raise policy interest rates, and while the path forward remains uncertain, the Bank of Canada left the door open to slowing its hiking cycle. For Canadian investors, the return of many foreign asset classes, with the exception of the U.S., benefitted from a currency translation effect over the quarter.
How did we do?
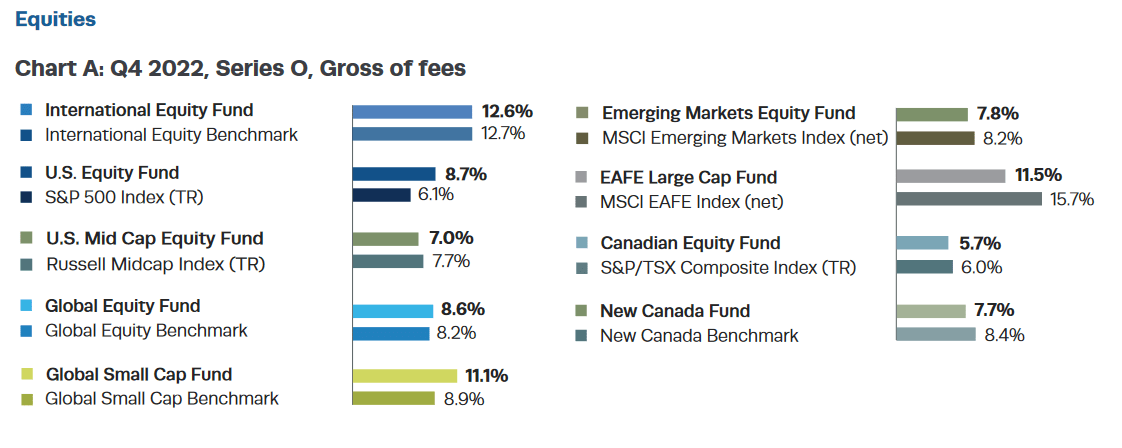
Performance has been presented for the O-Series Mawer Mutual Funds in Canadian dollars and calculated gross of management fees and net of operating expenses for the 3-month period of October 1, 2022 – December 31, 2022.
Our equity funds were able to deliver positive returns this quarter, a nice break from the grueling period investors have experienced in markets this year. In Canadian dollar terms, European and Japanese equities were able to outperform their North American peers, benefitting from a considerable move in currencies that aided the regions’ returns.
Reflecting the broad nature of the market’s advance during the quarter, the vast majority of portfolio holdings delivered positive returns. Some of the stronger performers across our equity funds were those that could be classified as more economically sensitive in nature, bolstered by the market’s hope that central banks may not need to be as aggressive as feared in tightening monetary policy with the latest inflation prints having shown signs of moderation. This included companies such as footwear and apparel brand Nike (NKE), coffee machine manufacturer De’Longhi (OTC:DELHF), and industrial equipment dealer Finning International (OTCPK:FINGF). Other standout performers included healthcare giant Novo Nordisk (NVO) and specialty insurer Trisura Group (OTCPK:TRRSF), with both companies reporting strong results.
On the other hand, several of our portfolio holdings declined in the fourth quarter. A few technology-focused companies, some having proposed or announced cutbacks in their workforce ahead of a potential recession, continued to be some of the most knocked-down stocks in the market. Holdings in companies such as open-source search library provider Elastic (ESTC), Amazon.com (AMZN), and Alphabet (Google) (GOOG) (GOOGL) had their stock prices lag the broader market.
We have been working on an inventory list of high-quality ideas and we believe we are well-positioned to start buying when it makes sense. In the recent past, many high-quality companies have demanded a premium in the market, and the pullback we have seen in 2022 has provided the opportunity to invest in some of these businesses at a more reasonable valuation.
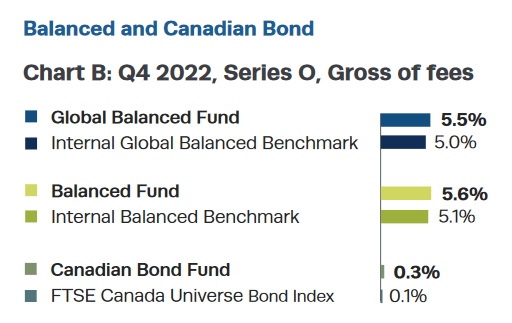
Balanced investors were able to get some reprieve in the fourth quarter after an overall challenging year for 60/40 portfolios. Our balanced funds were able to outperform their benchmarks, driven by the outperformance of some of the component strategies.
From an asset mix perspective, we did not make any adjustments this quarter. The future remains quite uncertain and there wasn’t a high degree of conviction or perceived edge to deviate from a near-neutral equity weight while also holding a higher-than-normal level of cash equivalents. There are many narratives of possible paths forward; we are not looking to predict this path, but stay open to multiple scenarios and guard against heavily tilting towards one outcome.
Looking back over the full calendar year, a portion of the Mawer Balanced Fund’s underperformance in 2022 can be attributed to the first quarter and the market’s initial adjustment to higher interest rate expectations which disproportionately hurt many of our equity portfolios given our focus on higher quality businesses. In retrospect, we acknowledge that many of our equity portfolios could have been better balanced with respect to interest rate sensitivity, and much of the activity in the early part of the year sought to re-establish this balance.
Looking ahead
There is little doubt that it has been a tough year for markets, and the path central banks take in 2023 is still up for debate as inflation remains high, global growth appears to be slowing, and the employment market remains resilient. Further complicating matters, yield curves are inverted which historically has been a fairly reliable indicator of recessions. Whether we end up with a soft or hard landing may rest on how persistent inflation will be.
Compared to historical standards, we are experiencing a very rapid pace of interest rate hikes by central banks, notably after a prolonged period of loose monetary policy. With corporate debt levels higher than in the recent past and with elevated interest rates, there is the potential for interest expenses to rise materially for companies with higher leverage. Depending on the path forward, the environment for companies with more corporate debt could prove more challenging.
This year we have seen gravity restored to the system as discount rates have increased. While this adjustment process, along with its impact on valuations, can be volatile and difficult, we believe we are ultimately heading to a place where returns will be driven more directly by company fundamentals. We also recognize that in times when emotions run high, we must guard most fiercely against temptations to stray from our philosophy and process. We continue to play the plan focusing on buying wealth-creating companies, with excellent management teams, trading at a discount to our estimate of intrinsic value.
Total gross returns (Series O)
For periods ending December 31, 2022
|
Equity funds |
YTD |
3-Mo |
1-Yr |
3-Yr |
5-Yr |
10-Yr |
Since Inception* |
|
Mawer International Equity Fund |
-15.6 |
12.6 |
-15.6 |
1.5 |
3.4 |
9.2 |
8.7 |
|
International Equity Benchmark* |
-9.9 |
12.7 |
-9.9 |
1.5 |
2.5 |
7.7 |
5.5 |
|
Mawer U.S. Equity Fund |
-11.1 |
8.7 |
-11.1 |
8.8 |
12.7 |
16.7 |
10.1 |
S&P 500 Index (TR) -12.2 6.1 -12.2 9.2 11.2 16.1 9.5
|
Mawer U.S. Mid Cap Equity Fund |
-13.3 |
7.0 |
-13.3 |
– |
– |
– |
-5.3 |
|
Russell Midcap Index (TR) |
-11.3 |
7.7 |
-11.3 |
– |
– |
– |
-4.7 |
|
Mawer Global Equity Fund |
-10.1 |
8.6 |
-10.1 |
7.1 |
9.7 |
14.0 |
13.0 |
Global Equity Benchmark* -12.4 8.2 -12.4 5.5 6.9 11.8 10.4
|
Mawer Global Small Cap Fund |
-16.3 |
11.1 |
-16.3 |
1.3 |
5.5 |
13.7 |
12.1 |
|
Global Small Cap Benchmark* |
-12.8 |
8.9 |
-12.8 |
4.7 |
4.9 |
10.6 |
6.8 |
|
Mawer Emerging Markets Equity Fund |
-27.9 |
7.8 |
-27.9 |
-3.4 |
-0.9 |
– |
2.4 |
|
MSCI Emerging Markets Index (net) |
-14.3 |
8.2 |
-14.3 |
-1.3 |
0.2 |
– |
4.0 |
|
Mawer EAFE Large Cap Fund |
-16.0 |
11.5 |
-16.0 |
– |
– |
– |
4.8 |
|
MSCI EAFE Index (net) |
-8.2 |
15.7 |
-8.2 |
– |
– |
– |
6.4 |
|
Mawer Canadian Equity Fund |
-4.5 |
5.7 |
-4.5 |
7.5 |
6.7 |
10.3 |
9.7 |
|
S&P/TSX Composite Index (TR) |
-5.8 |
6.0 |
-5.8 |
7.5 |
6.8 |
7.7 |
7.2 |
|
Mawer New Canada Fund |
-17.6 |
7.7 |
-17.6 |
6.1 |
7.2 |
12.3 |
13.2 |
|
New Canada Benchmark* |
-9.3 |
8.4 |
-9.3 |
7.2 |
3.1 |
4.2 |
5.8 |
|
Balanced funds |
|||||||
|
Mawer Global Balanced Fund |
-9.9 |
5.5 |
-9.9 |
4.4 |
6.5 |
– |
8.8 |
|
Internal Global Balanced Benchmark* |
-11.3 |
5.0 |
-11.3 |
2.5 |
4.4 |
– |
7.1 |
|
Mawer Balanced Fund |
-11.7 |
5.6 |
-11.7 |
2.8 |
4.9 |
8.4 |
7.6 |
|
Internal Balanced Benchmark* |
-9.6 |
5.1 |
-9.6 |
3.3 |
4.1 |
6.6 |
5.6 |
|
Mawer Tax Effective Balanced Fund |
-11.6 |
5.6 |
-11.6 |
2.8 |
4.8 |
8.4 |
7.5 |
|
Internal Tax Effective Balanced Benchmark* |
-9.6 |
5.1 |
-9.6 |
3.3 |
4.1 |
6.6 |
5.6 |
|
Income funds |
|||||||
|
Mawer Canadian Bond Fund |
-11.5 |
0.3 |
-11.5 |
-1.9 |
0.5 |
1.7 |
3.5 |
|
FTSE Canada Universe Bond Index |
-11.7 |
0.1 |
-11.7 |
-2.2 |
0.3 |
1.6 |
3.4 |
|
Mawer Canadian Money Market Fund |
1.7 |
0.8 |
1.7 |
0.8 |
1.0 |
0.8 |
1.1 |
|
FTSE Canada 91 Day TBill Index |
1.8 |
1.0 |
1.8 |
0.9 |
1.2 |
0.9 |
1.3 |
Refer to www.mawer.com/funds/performance/ for Fund Inception Dates and Benchmark History.
Mawer Mutual Funds are managed by Mawer Investment Management Ltd. O-Series returns for the Mawer Mutual Funds are reported in Canadian dollars and calculated before management fees and after operating expenses have been deducted. In comparison, index returns do not incur management fees or operating expenses.
Total net returns (Series A)
For periods ending December 31, 2022
|
Equity funds |
YTD |
3-Mo |
1-Yr |
3-Yr |
5-Yr |
10-Yr |
Since Inception* |
|
Mawer International Equity Fund |
-16.7 |
12.2 |
-16.7 |
0.1 |
2.0 |
7.7 |
7.4 |
|
International Equity Benchmark* |
-9.9 |
12.7 |
-9.9 |
1.5 |
2.5 |
7.7 |
5.1 |
|
Mawer U.S. Equity Fund |
-12.1 |
8.3 |
-12.1 |
7.6 |
11.4 |
15.4 |
8.5 |
S&P 500 Index (TR) -12.2 6.1 -12.2 9.2 11.2 16.1 9.9
|
Mawer U.S. Mid Cap Equity Fund |
-14.5 |
6.7 |
-14.5 |
– |
– |
– |
-6.6 |
|
Russell Midcap Index (TR) |
-11.3 |
7.7 |
-11.3 |
– |
– |
– |
-4.7 |
|
Mawer Global Equity Fund |
-11.2 |
8.2 |
-11.2 |
5.7 |
8.3 |
12.5 |
11.6 |
Global Equity Benchmark* -12.4 8.2 -12.4 5.5 6.9 11.8 10.4
|
Mawer Global Small Cap Fund |
-17.7 |
10.6 |
-17.7 |
-0.4 |
3.7 |
11.8 |
10.2 |
|
Global Small Cap Benchmark* |
-12.8 |
8.9 |
-12.8 |
4.7 |
4.9 |
10.6 |
6.8 |
|
Mawer Emerging Markets Equity Fund |
-29.0 |
7.4 |
-29.0 |
-4.8 |
-2.4 |
– |
0.8 |
|
MSCI Emerging Markets Index (net) |
-14.3 |
8.2 |
-14.3 |
-1.3 |
0.2 |
– |
4.0 |
|
Mawer EAFE Large Cap Fund |
-17.1 |
11.1 |
-17.1 |
– |
– |
– |
3.4 |
|
MSCI EAFE Index (net) |
-8.2 |
15.7 |
-8.2 |
– |
– |
– |
6.4 |
|
Mawer Canadian Equity Fund |
-5.6 |
5.4 |
-5.6 |
6.2 |
5.5 |
9.1 |
9.1 |
|
S&P/TSX Composite Index (TR) |
-5.8 |
6.0 |
-5.8 |
7.5 |
6.8 |
7.7 |
8.3 |
|
Mawer New Canada Fund |
-18.7 |
7.3 |
-18.7 |
4.6 |
5.8 |
10.9 |
12.8 |
|
New Canada Benchmark* |
-9.3 |
8.4 |
-9.3 |
7.2 |
3.1 |
4.2 |
7.3 |
|
Balanced funds |
|||||||
|
Mawer Global Balanced Fund |
-10.9 |
5.2 |
-10.9 |
3.3 |
5.4 |
– |
7.6 |
|
Internal Global Balanced Benchmark* |
-11.3 |
5.0 |
-11.3 |
2.5 |
4.4 |
– |
7.1 |
|
Mawer Balanced Fund |
-12.5 |
5.4 |
-12.5 |
1.9 |
3.9 |
7.4 |
7.9 |
|
Internal Balanced Benchmark* |
-9.6 |
5.1 |
-9.6 |
3.3 |
4.1 |
6.6 |
7.4 |
|
Mawer Tax Effective Balanced Fund |
-12.4 |
5.3 |
-12.4 |
1.9 |
3.9 |
7.4 |
7.5 |
|
Internal Tax Effective Balanced Benchmark* |
-9.6 |
5.1 |
-9.6 |
3.3 |
4.1 |
6.6 |
7.5 |
|
Income funds |
|||||||
|
Mawer Canadian Bond Fund |
-12.0 |
0.2 |
-12.0 |
-2.5 |
-0.1 |
1.0 |
5.0 |
|
FTSE Canada Universe Bond Index |
-11.7 |
0.1 |
-11.7 |
-2.2 |
0.3 |
1.6 |
6.0 |
|
Mawer Canadian Money Market Fund |
1.3 |
0.7 |
1.3 |
0.5 |
0.7 |
0.4 |
3.0 |
|
FTSE Canada 91 Day TBill Index |
1.8 |
1.0 |
1.8 |
0.9 |
1.2 |
0.9 |
3.7 |
Mawer Mutual Funds are managed by Mawer Investment Management Ltd. A-Series returns for the Mawer Mutual Funds are reported in Canadian dollars and calculated after management fees and operating expenses have been deducted. In comparison, index returns do not incur management fees or operating expenses.
This document is for informational purposes only. Commissions, trailing commissions, management fees, and expenses all may be associated with mutual fund investments. Please read the fund facts and the prospectus before investing. The indicated rates of return are the historical annual compounded total returns including changes in unit value and reinvestment of all distributions and do not take into account sales, redemption, distribution, or optional charges, or income taxes payable by any security holder that would have reduced returns. Mutual funds are not guaranteed, their values change frequently and past performance may not be repeated. Mawer Funds are managed by Mawer Investment Management Ltd. Mutual fund securities are not covered by the Canada Deposit Insurance Corporation or by any other government deposit insurer.
This Mawer Quarterly includes certain statements that are “forward-looking statements.” All statements, other than statements of historical fact, included in this report that address activities, events, or developments that the portfolio advisor, Mawer Investment Management Ltd., expects or anticipates will or may occur in the future, including such things as anticipated financial performance, are forward-looking statements. The words “may”, “could”, “would”, “should”, “believe”, “plan”, “anticipate”, “expect”, “intend”, “forecast”, “objective” and similar expressions are intended to identify forward-looking statements. These forward-looking statements are subject to various risks and uncertainties, including the risks described in the Simplified Prospectus of the Fund, uncertainties, and assumptions about the Fund, capital markets, and economic factors, which could cause actual financial performance and expectations to differ materially from the anticipated performance or other expectations expressed. Economic factors include, but are not limited to, general economic, political, and market factors in North America and internationally, interest and foreign exchange rates, global equity and capital markets, business competition, technological change, changes in government regulations, unexpected judicial or regulatory proceedings, and catastrophic events.
All opinions contained in forward-looking statements are subject to change without notice and are provided in good faith but without legal responsibility. The portfolio advisor has no specific intention of updating any forward-looking statements whether as a result of new information, future events, or otherwise, except as required by securities legislation. Certain research and information about specific holdings in the Fund, including any opinion, is based upon various sources believed to be reliable, but it cannot be guaranteed to be current, accurate, or complete. It is for information only and is subject to change without notice.
Index returns are supplied by a third party – we believe the data to be accurate, however, cannot guarantee its accuracy. Index returns are sourced from FTSE Russell, FactSet, and BMO Capital Markets.
Performance returns for the Mawer Mutual Funds and benchmarks are calculated by Mawer Investment Management Ltd. These returns are historical simple returns for the 3-month, YTD, and 1-year periods, and annualized compounded total returns for periods after 1 year.
Non-performance-related material in this document reflects the opinions of the writer, and does not reflect fact or predictions of actual events or impacts, and cannot be relied upon for investing purposes or as investment advice or guarantees of any kind.
MSCI Disclaimer:
The MSCI information may only be used for your internal use, may not be reproduced or disseminated in any form, and may not be used as a basis for or a component of any financial instruments or products, or indices. None of the MSCI information is intended to constitute investment advice or a recommendation to make (or refrain from making) any kind of investment decision and may not be relied on as such. Historical data and analysis should not be taken as an indication or guarantee of any future performance analysis, forecast, or prediction. The MSCI information is provided on an “as is” basis and the user of this information assumes the entire risk of any use made of this information. MSCI, each of its affiliates, and each other person involved in or related to compiling, computing, or creating any MSCI information (collectively, the “MSCI Parties”) expressly disclaims all warranties (including, without limitation, any warranties of originality, accuracy, completeness, timeliness, non-infringement, merchantability and fitness for a particular purpose) with respect to this information. Without limiting any of the foregoing, in no event shall any MSCI Party have any liability for any direct, indirect, special, incidental, punitive, consequential (including, without limitation, lost profits) or any other damages. (www.msci.com)
FTSE Disclaimer:
London Stock Exchange Group plc and its group undertakings (collectively, the “LSE Group”). © LSE Group 2023.
FTSE Russell is a trading name of certain of the LSE Group companies. FTSE® is a trademark (s) of the relevant LSE Group companies and is/are used by any other LSE Group company under license. “TMX®” is a trademark of TSX, Inc. and used by the LSE Group under license. All rights in the FTSE Russell indexes or data vest in the relevant LSE Group company which owns the index or the data. Neither LSE Group nor its licensors accept any liability for any errors or omissions in the indexes or data and no party may rely on any indexes or data contained in this communication. No further distribution of data from the LSE Group is permitted without the relevant LSE Group company’s express written consent. The LSE Group does not promote, sponsor or endorse the content of this communication.
Editor’s Note: The summary bullets for this article were chosen by Seeking Alpha editors.
Editor’s Note: This article discusses one or more securities that do not trade on a major U.S. exchange. Please be aware of the risks associated with these stocks.
Be the first to comment