

Pgiam/iStock via Getty Images Buying of SQQQ vs QQQ (Michael McDonald)
Contrary Opinion Indicators
We wrote three articles in July explaining how numerous contrary opinion indicators are pointing to the end of this bear market. This was done to document the power of contrary opinion at locating important market bottoms and, in the process, help you make money.
The first article in the series on June 30th covered new indicators based on the buying of three, bearish exchange-traded funds (“ETFs”) – ProShares Short S&P 500 (SH), ProShares Short Dow 30 (DOG) and ProShares Short QQQ (PSQ).
In that article, however, we failed to include readings on the most popular ProShares bear fund, the ProShares UltraPro Short QQQ ETF (NASDAQ:SQQQ). We are remedying that omission in the current article, which is really an addendum to the June 30th article.
Measuring “Bear Market” Buying
How do you measure investor buying in bearish ETFs? Looking at daily sales is insufficient, since it doesn’t specify how much is from investor buying. With individual stocks, sales do represent the amount of buying, since buying and selling are always equal. But with ETFs they aren’t. If there are more buyers than sellers of an ETF, the fund creates more shares for the excess buyers. If there are more sellers than buyers, they retire the excess shares.
So, sales numbers alone don’t tell you how much money is going into or out of an ETF; you must combine sales with changes in the number of shares outstanding to determine that. Once done, you then multiply the number of shares being purchased by the fund’s NAV to determine how much money is going into the fund on a daily basis. We then form a twenty-day moving average to smooth out the results.
Measuring the dollar amount going into a fund is not the best metric, however. What’s better is dividing the amount of money going into the fund by the total assets in the fund. Producing a ratio like this allows for historical comparisons; absolute values don’t. This ratio or percent is like the old, short selling indicators of the 1960’s and 1970’s, where the amount of short selling was divided by the amount of total selling.
The Results
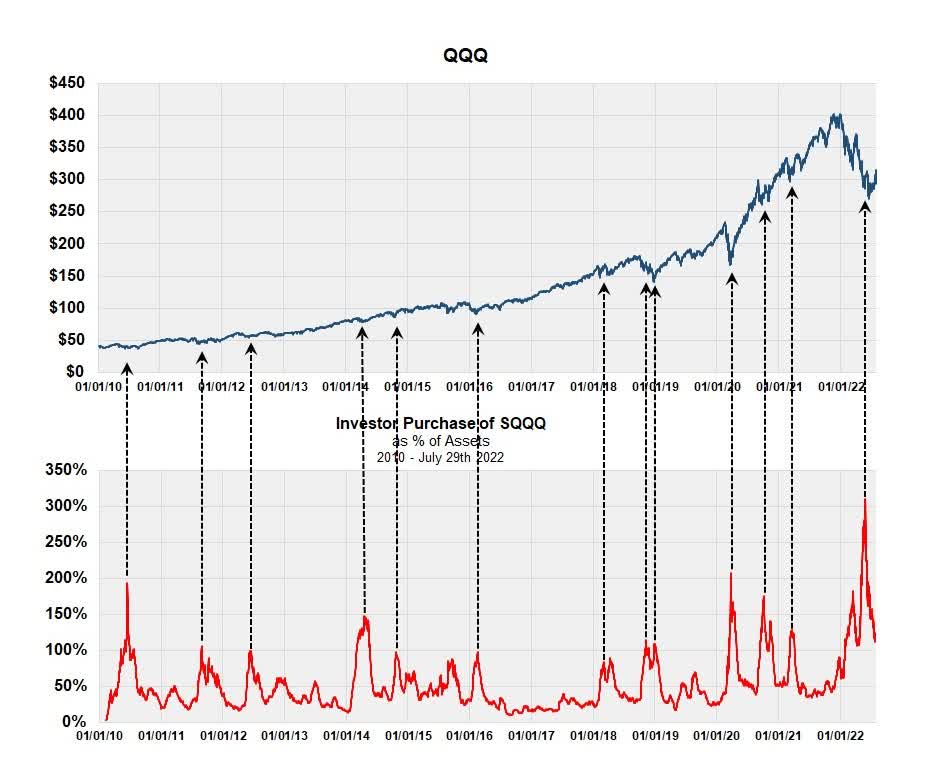
The results of doing this for SQQQ are shown in the chart above. It’s similar to the charts of the three other bear funds in the earlier article but much more dramatic.
Purchases of SQQQ have been more intense during this bear market than any other period over the last 10 years. What is particularly striking is the percentage of daily buying two months ago, which reached 300% of net asset value. This is far above that of the other three bear funds, which reached peaks around 50%. While the latest number is down from its peak, the current reading of 110% remains historically very high and what one might expect after a few weeks of rising prices.
We believe the extreme buying in SQQQ is added confirmation that we have reached a major low in this bear market.
Be the first to comment