

hallojulie
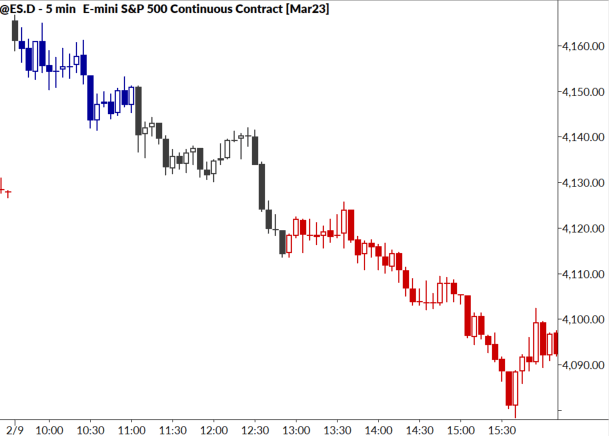
Last week saw several rounds of strong selling pressure in stock indexes, including a classic downtrend day on Thursday. (See chart below, just for the illustration of a textbook-perfect downtrend!) However, this weakness may take on a different significance when put in longer-term context.
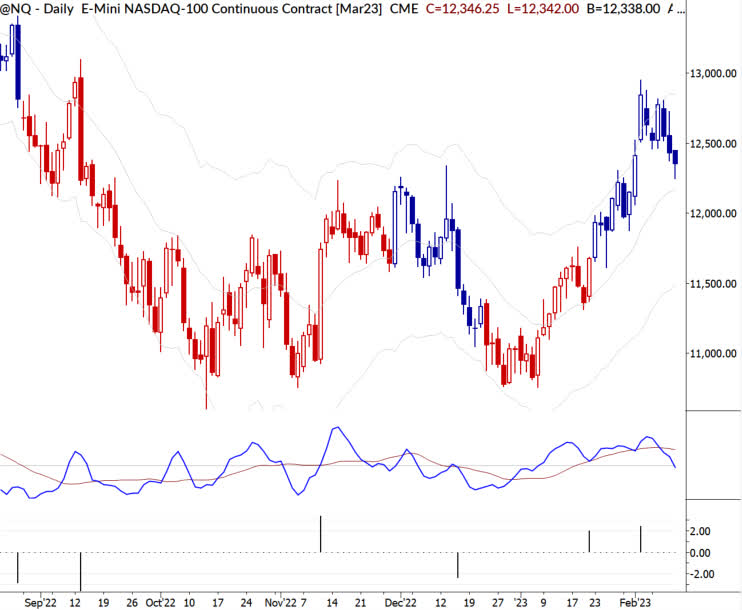
A look at the chart at the top of this post reminds us that stocks are up significantly over the past month and a half, and that this type of move often leads to a pullback or correction. This is part of the normal market cycle, and, in fact, is an affirmation of trend strength.
We do, however, find the market at a key short-term inflection point. Last week’s action presents as an inside bar (meaning the weekly high is lower than the previous weekly high and the low is higher). This is a typical setup indicating volatility contraction, and pointing to a higher probability of a trend move out of the current consolidation.
Though near-term technical factors point to the upside, it would not take too much selling pressure to tilt the scales back to balanced/neutral. Index traders can use reasonably tight stops on longs based on daily charts.
In the much longer term, we still hold grave concerns related to the yield curve inversion, but this has little value for short-term action. Inverted yield curve signals have almost always led to a significant decline in stocks, but the signal sometimes precedes the selling by as much as two years. This is most certainly not a timing signal!
The week ahead (potentially market-moving data releases)
Monday: NY Fed Inflation Expectations
Tuesday: CPI
Wednesday: Retail Sales, Industrial Production
Thursday: Jobless claims, Philly Fed, PPI
Friday: None
Note that any speeches from Fed Presidents are potential intraday catalysts. The market is reacting strongly to every hint of information from this quarter.
Editor’s Note: The summary bullets for this article were chosen by Seeking Alpha editors.
Be the first to comment