

Spencer Platt/Getty Images News
In this market report, I will summarize key developments in the prior week as well as provide outlook for the coming week. This way, investors will be better able to navigate the uncertainty and volatility as the Fed ramps up i/r. This week’s coverage is also rather lengthy, but what can I say, a lot happened!
US Equities
Market Movements
1st Week July S&P500 Heat Map (Finviz)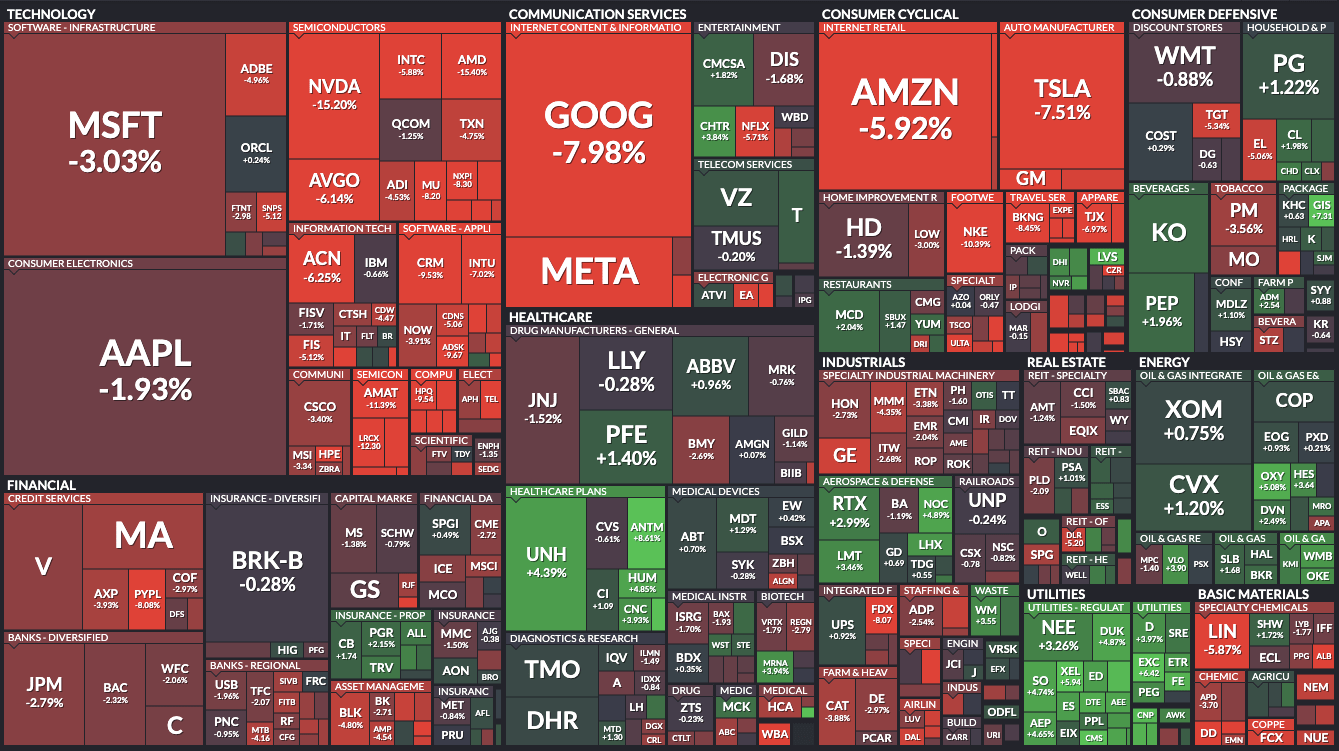
Markets ended the week down, driven by slowing economic data, mixed PCE data released Thursday and a weaker than expected PMI print. The S&P 500 (SPY) closed the week down 221bps, Dow (DIA) down 128bps, and the Nasdaq (QQQ) down 430bps.
Year to date, SPY remains down 20.3%, DIA down 15%, and NDQ down 29.8%, 2 of the indexes in bear market territory and all 3 pass the correction stage. The S&P has also posted its worst loss since the 1970s after a rout triggered by the Fed to tame inflation.
What The PCE Data Suggests
For May YoY:
- Headline PCE rose +6.3%, the same pace as April.
- Core PCE increased +4.7%, down 20bps from April’s +4.9%.
No New Peak In Headline YoY Print (Panther Research – Twitter) Core YoY Inflationary Pressures On Track To Decelerate (Panther Research – Twitter)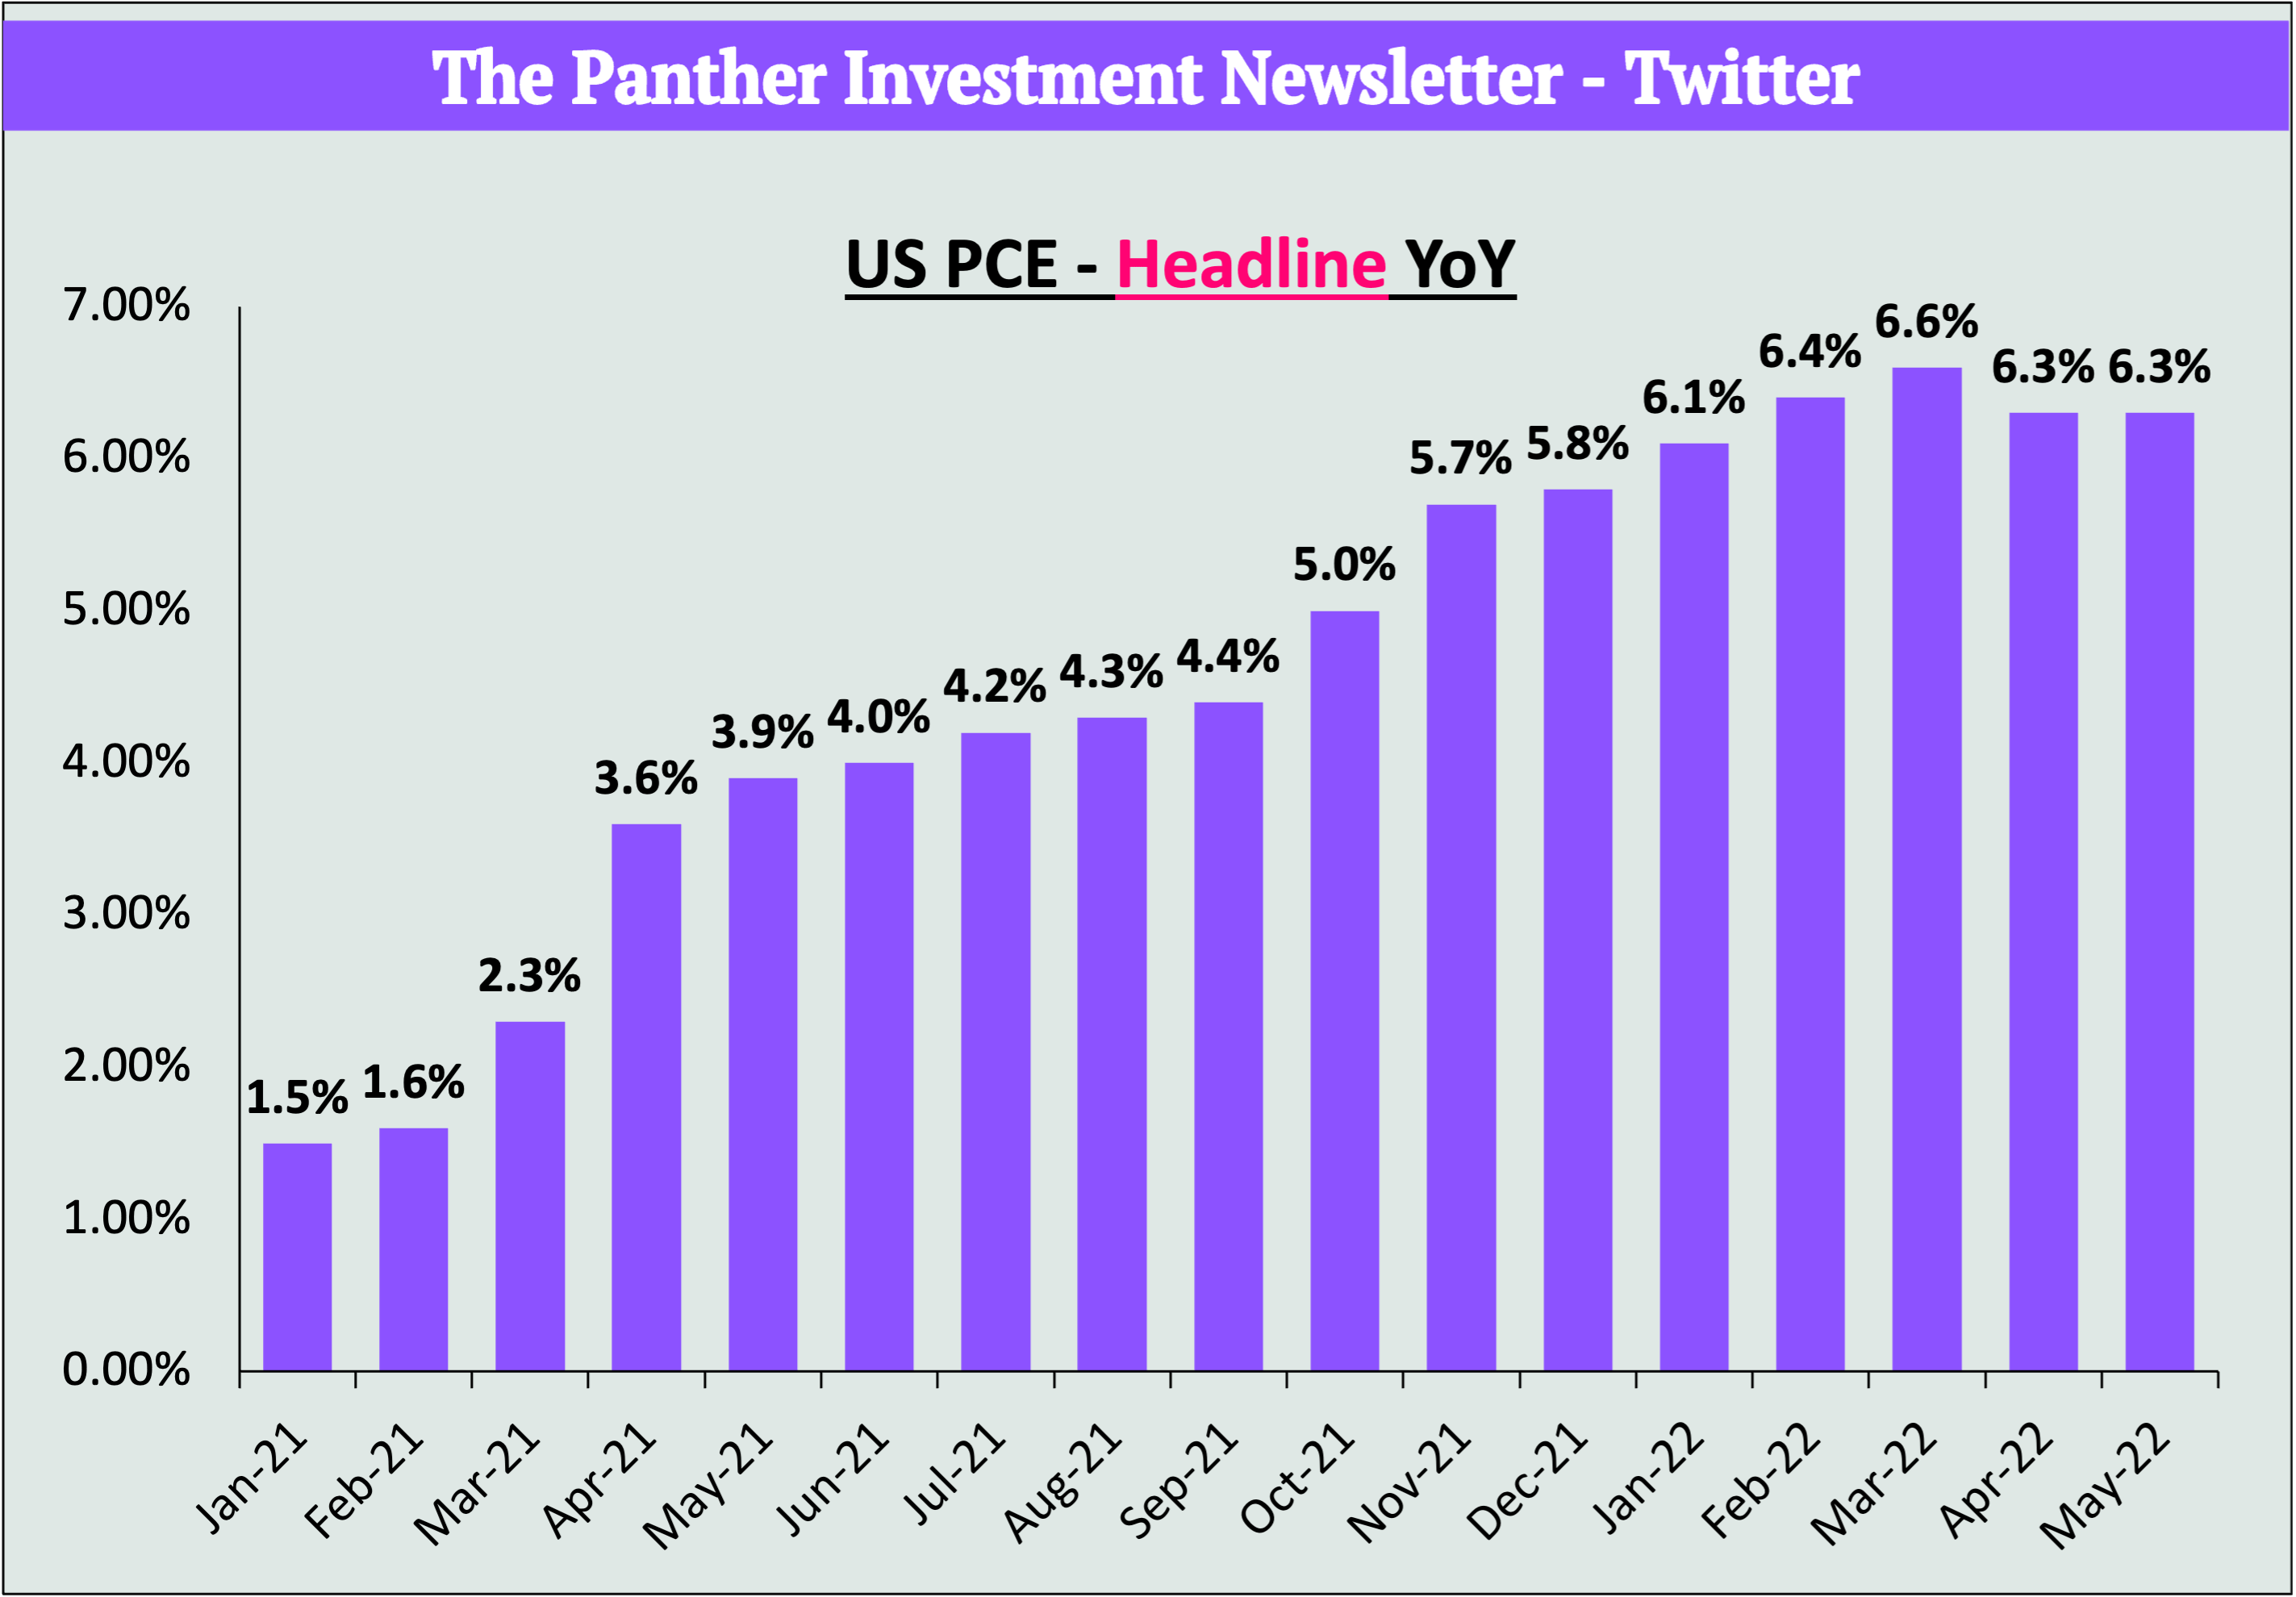
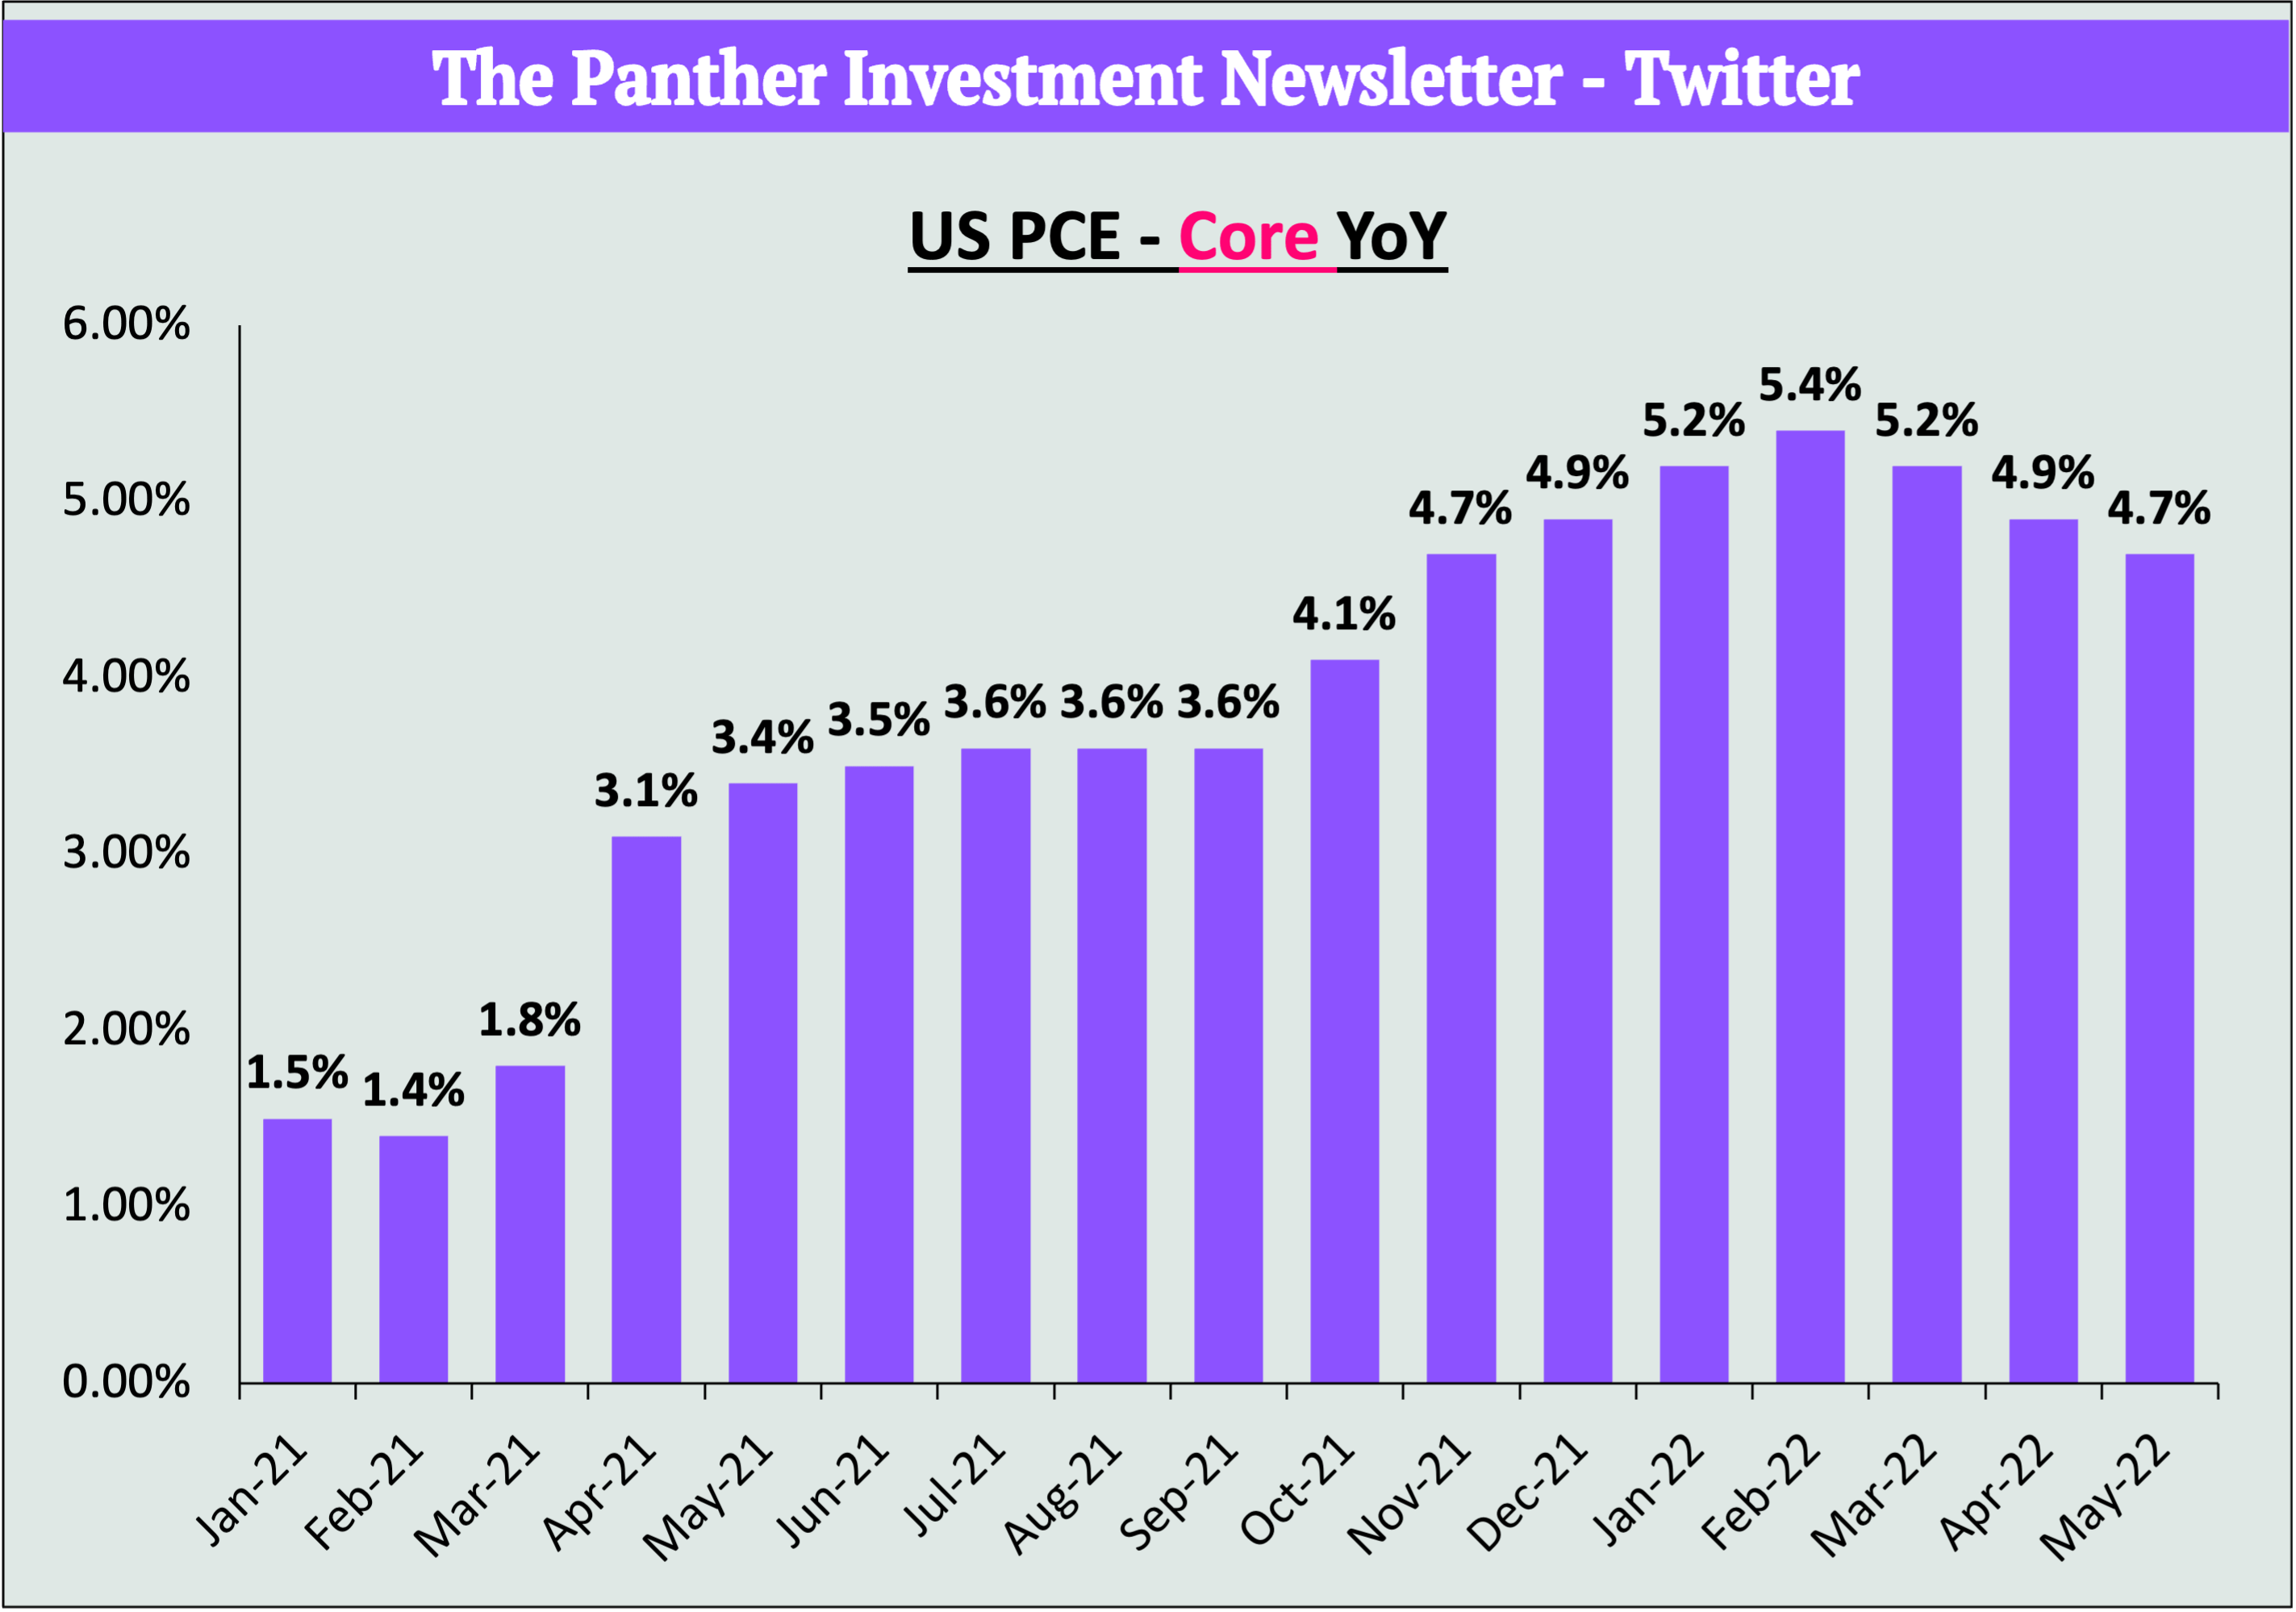
While the lack of a new peak in headline PCE was noted and beneficial for markets given that CPI printed a new 8.6% high from the 8.5% in March, the same rate of increase for all households (PCE) suggested that inflation was sticky. On a brighter note, the deceleration in core inflationary pressures corroborates the slowdown that we have seen since March for Core Headline CPI. The 4.7% was the 4th consecutive month of a deceleration and the slowest rise since November 2021.
For May MoM:
- Headline PCE rose +0.6%, 3x faster than April’s +0.2%.
- Despite this, the +0.9% in March remains the highest YTD.
MoM PCE Spikes Due To Energy & Food (Panther Research – Twitter) PCE MoM Corroborates CPI MoM Movement (Panther Research – Twitter)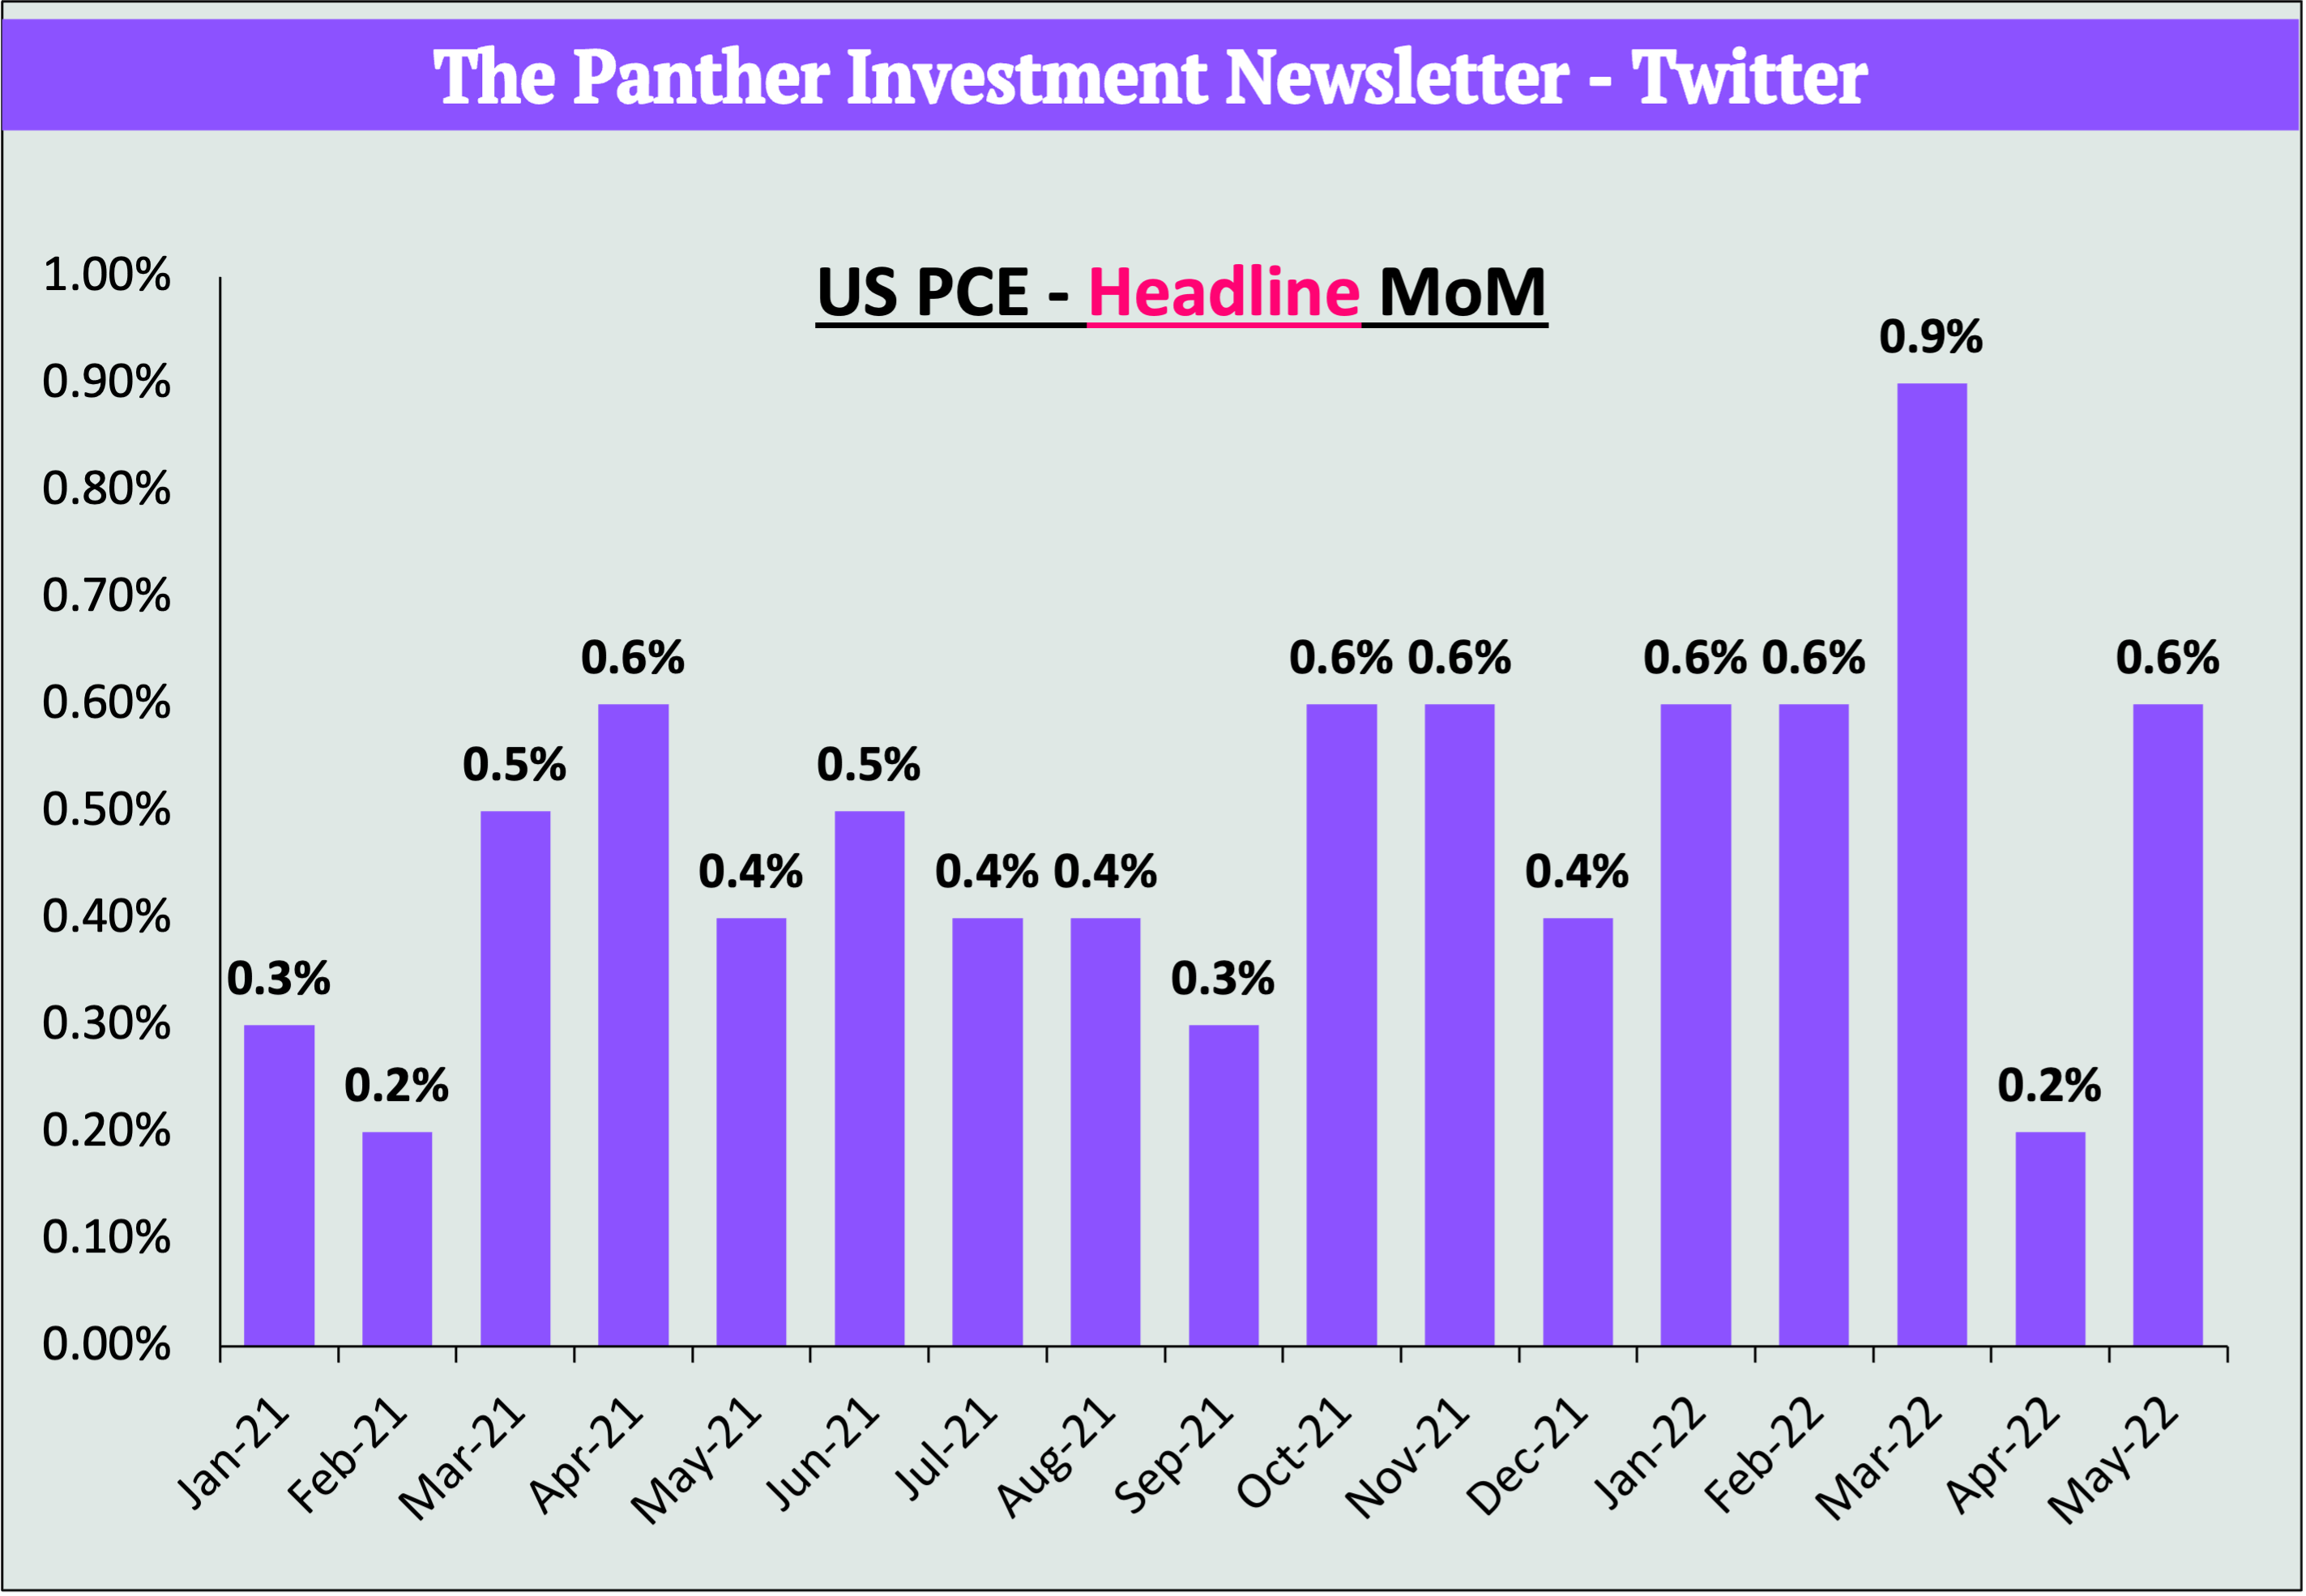

The reversal in MoM inflationary pressures to the upside for the Fed’s preferred inflation metric (PCE) was a carbon copy of the MoM increase in CPI for May noted 3 weeks ago. The uptick can be attributable to the resurgence in gasoline prices as pent-up DD across the world progresses and supply continues to dwindle.
Elevated Crude oil prices are now also being projected to remain for some time. In May 2020, OPEC+ joined forces to coordinate production decreases to re-balance the suddenly overstocked global oil market. Since then, the group has collectively pumped 562M barrels less than it was supposed to, laying the foundations for the current imbalance.
In light of US consumers paying $5+ per gallon at the pump, OPEC+ agreed in principle to raise production to 42M barrels/day last month. But a new, independent assessment found that OPEC+ has fallen short by a whopping 3M barrels per day, prompting wide concern as to how long the supply-demand imbalance will persist.
US Consumer Spending Continues To Weaken
Consumer Confidence Comes In Worse Than Expected (Panther Research – Twitter) UMich Sentiment Tends To Move Together With CCI (Panther Research – Twitter)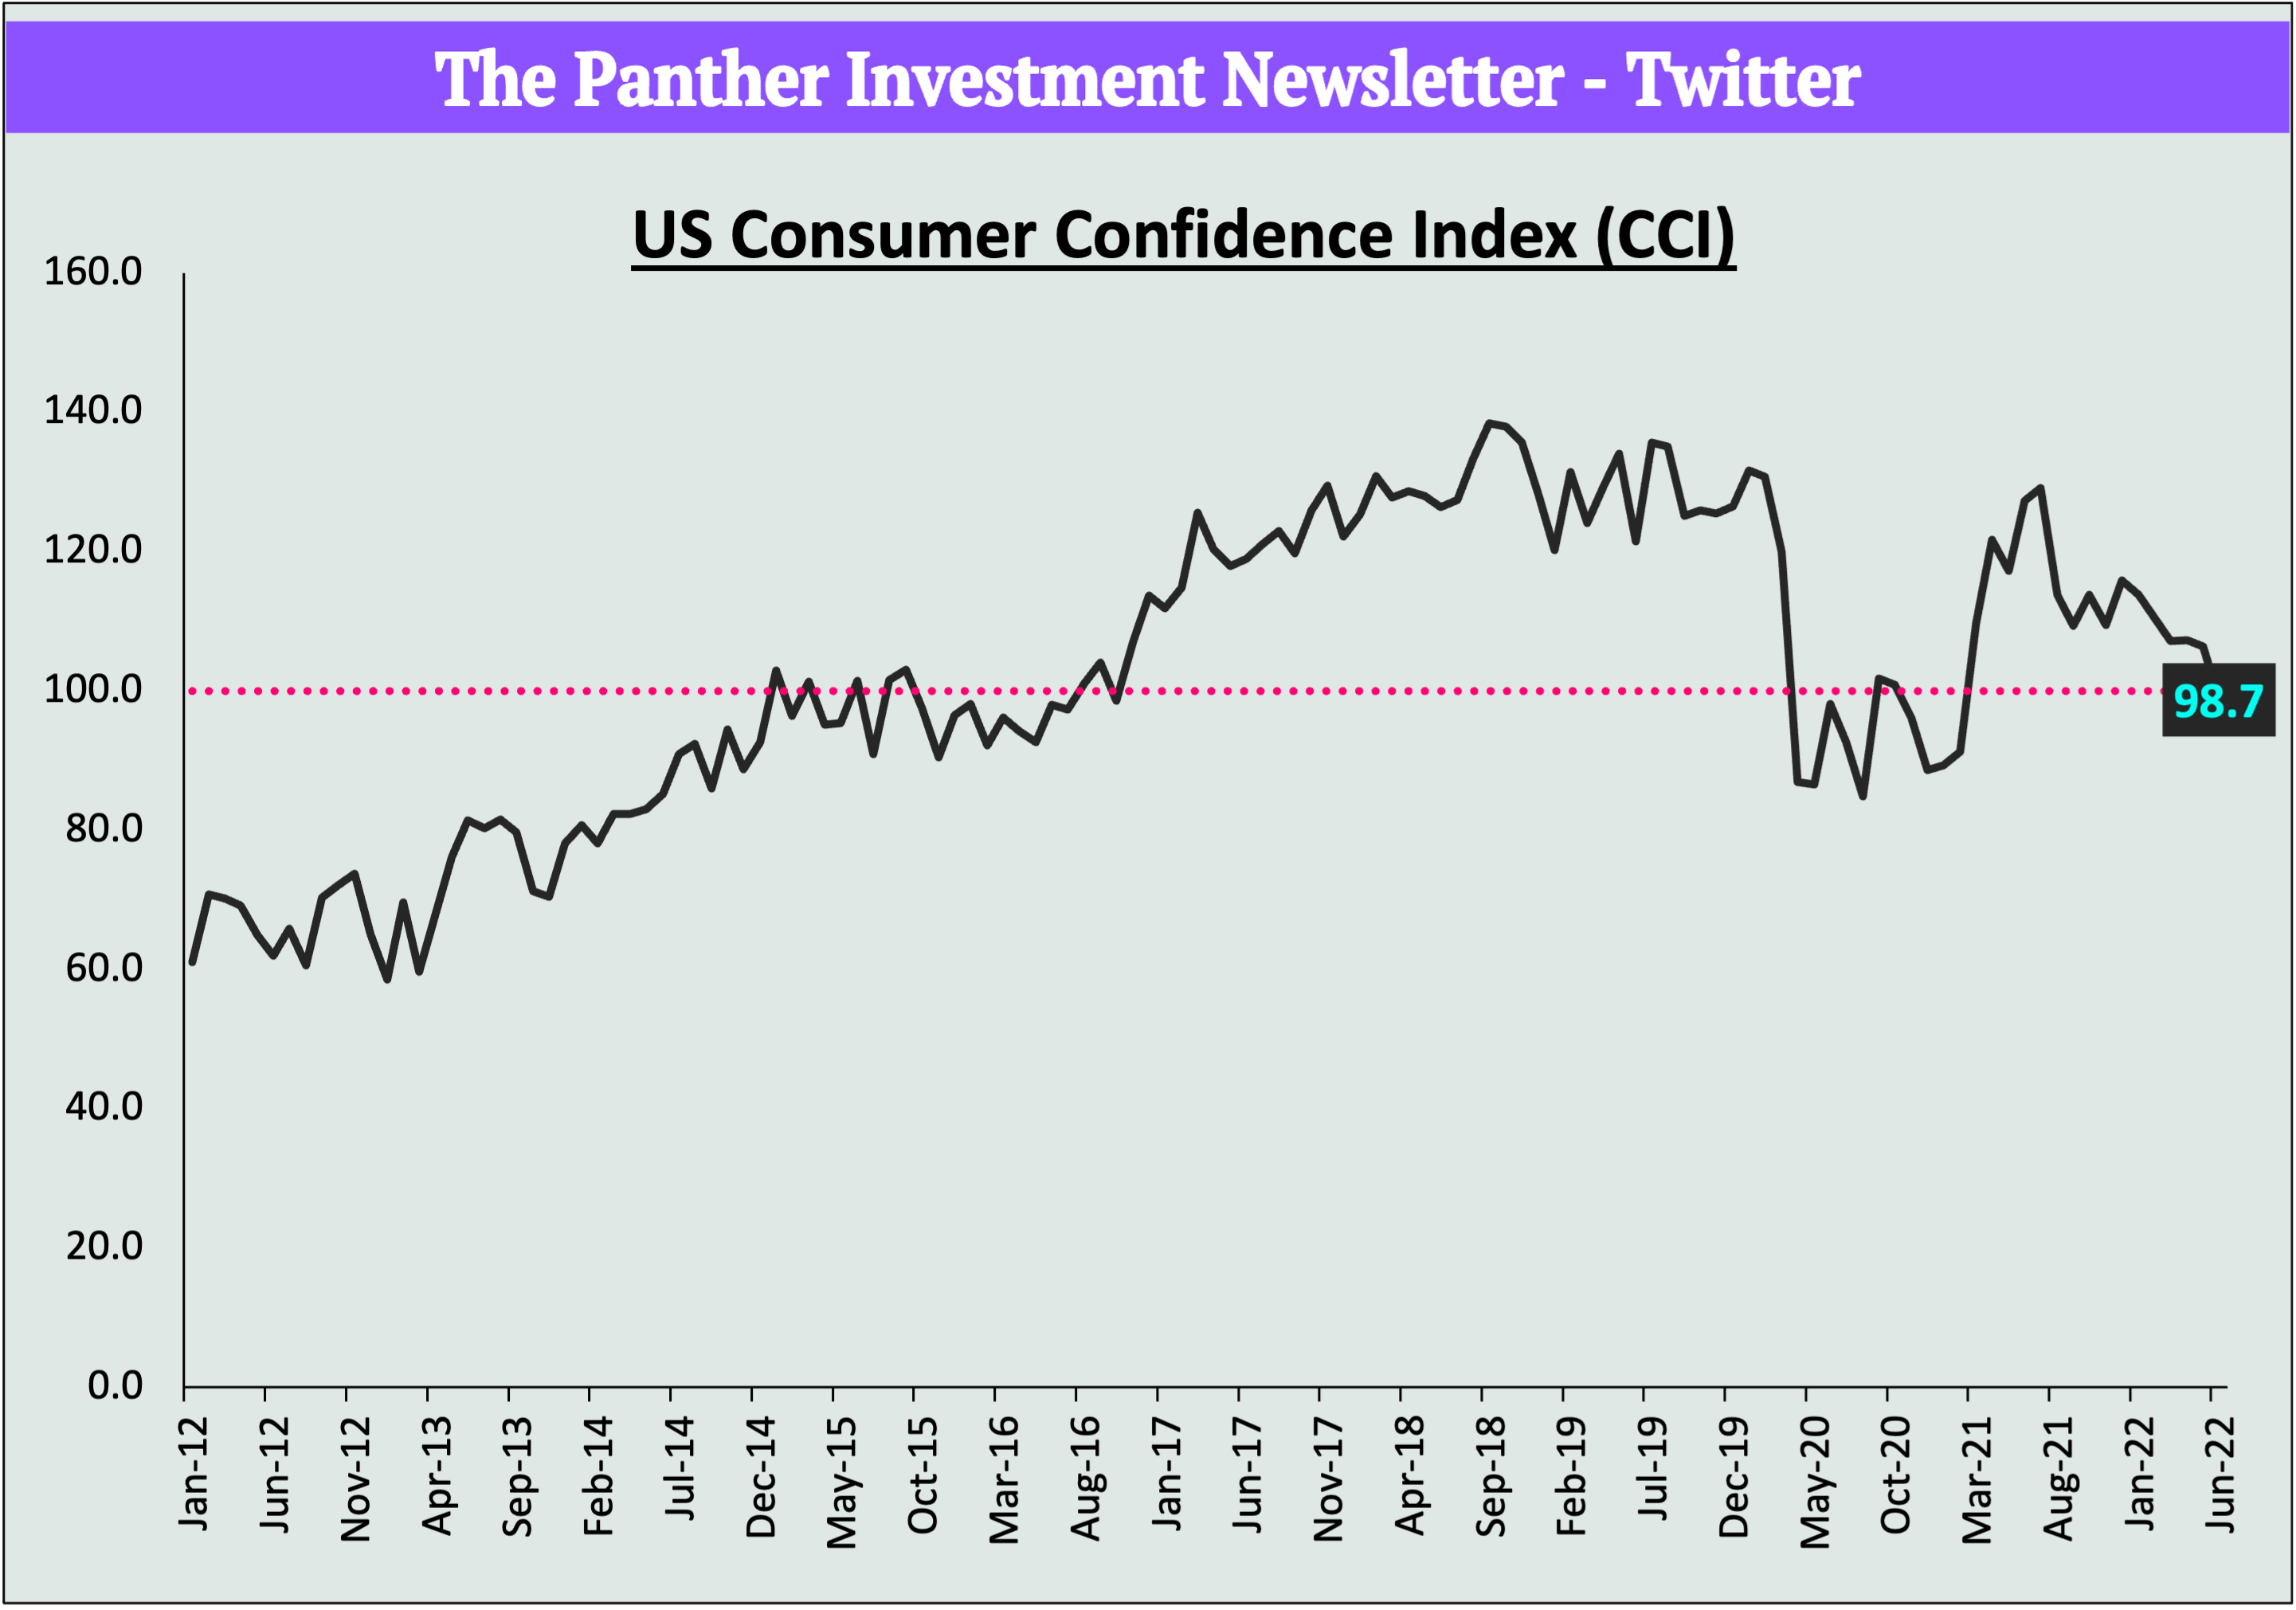
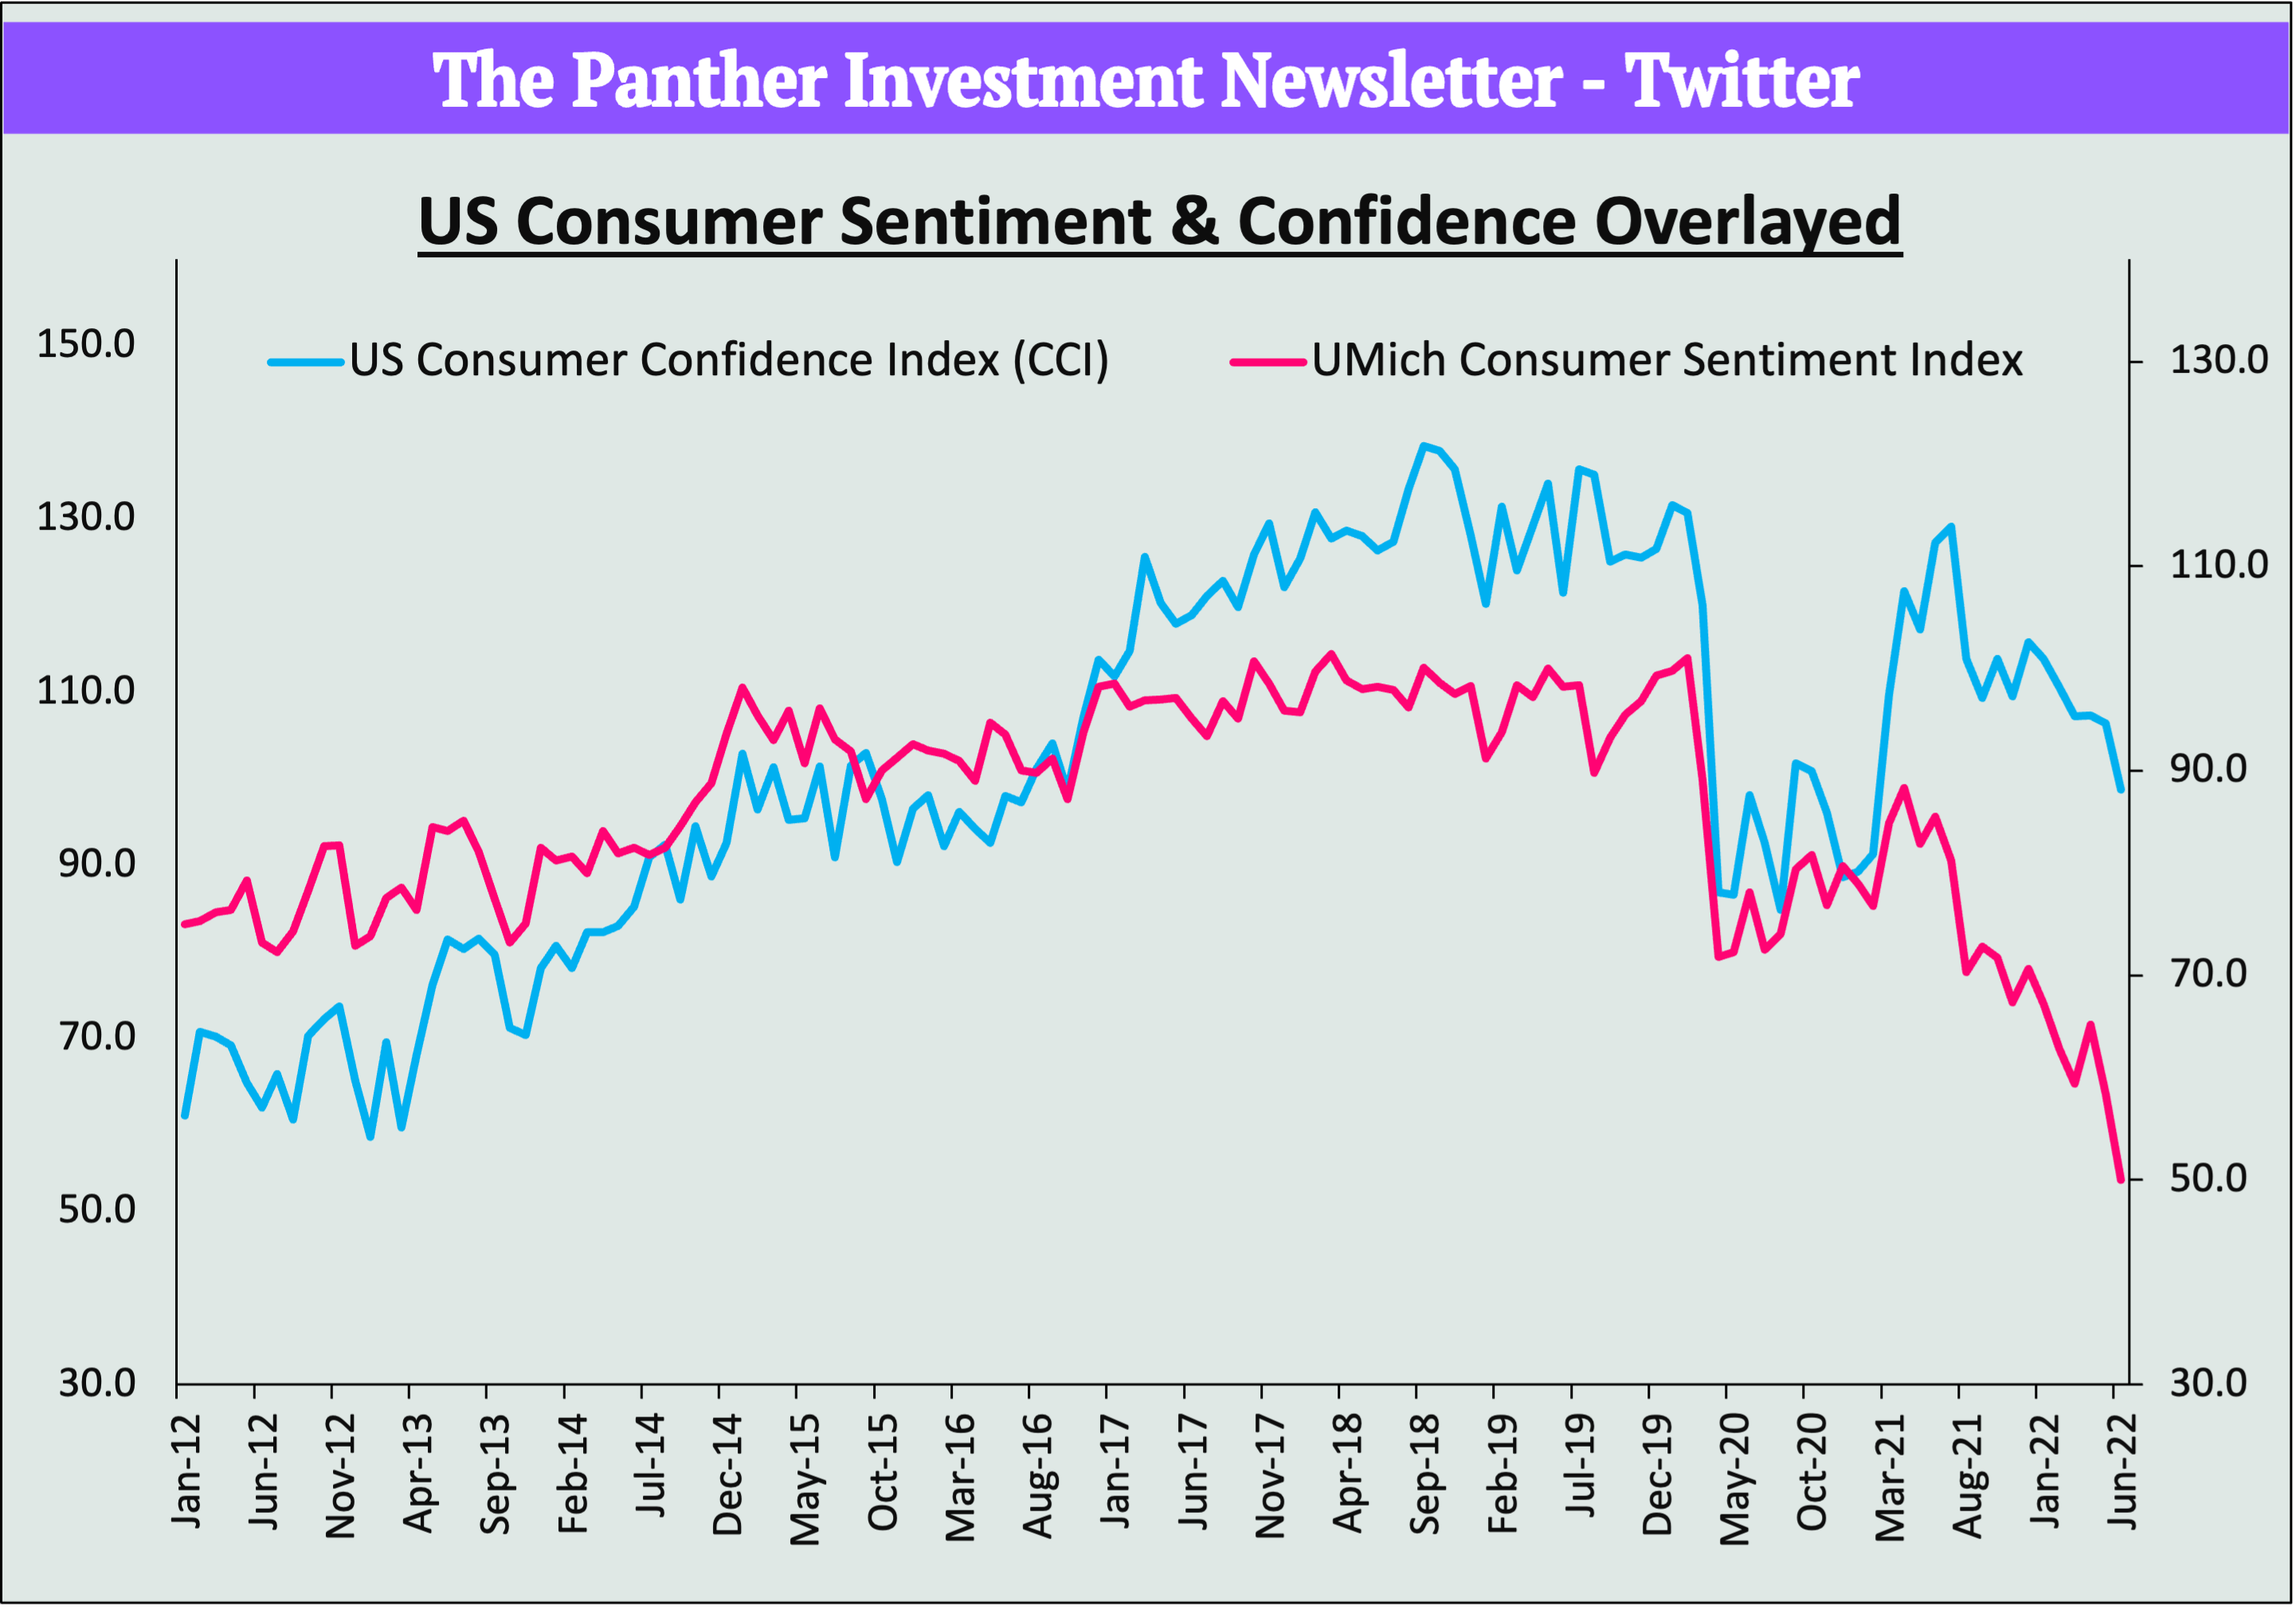
Tuesday’s early rally evaporated after poor consumer confidence reading in the US came in at 98.7. The print was below estimates of 100 and a new 16 month low, indicating that consumers were less confident now compared to 1985 which marked the start of the data collection period. The magnitude of the gap between consumer sentiment and expectations into the future is also important, with a large gap (expectations less than sentiment) raising the risk for a recession.
Bloomberg economist Eliza Winger stated that:
“The widening gap between consumers’ present situation and their expectations of the future raises the risk of recession. Apprehension about the direction of the economy could increasingly influence consumer behavior, resulting in a downward spiral of slumping demand.”
Consumption momentum also suggests that we are in the early innings of a slowdown, with the real personal spending in May dropping for the 1st time this year. While we continue to see a rotation from DD of goods to services, the overall drop still signifies that the rotation isn’t substantial enough to make up for the general pullback in spending. Consumer sentiment and confidence are leading indicators of their willingness to spend and sales are starting to corroborate the all-time-low sentiment readings.
The PSR Improves But Remains Near ATL (Panther Research – Twitter)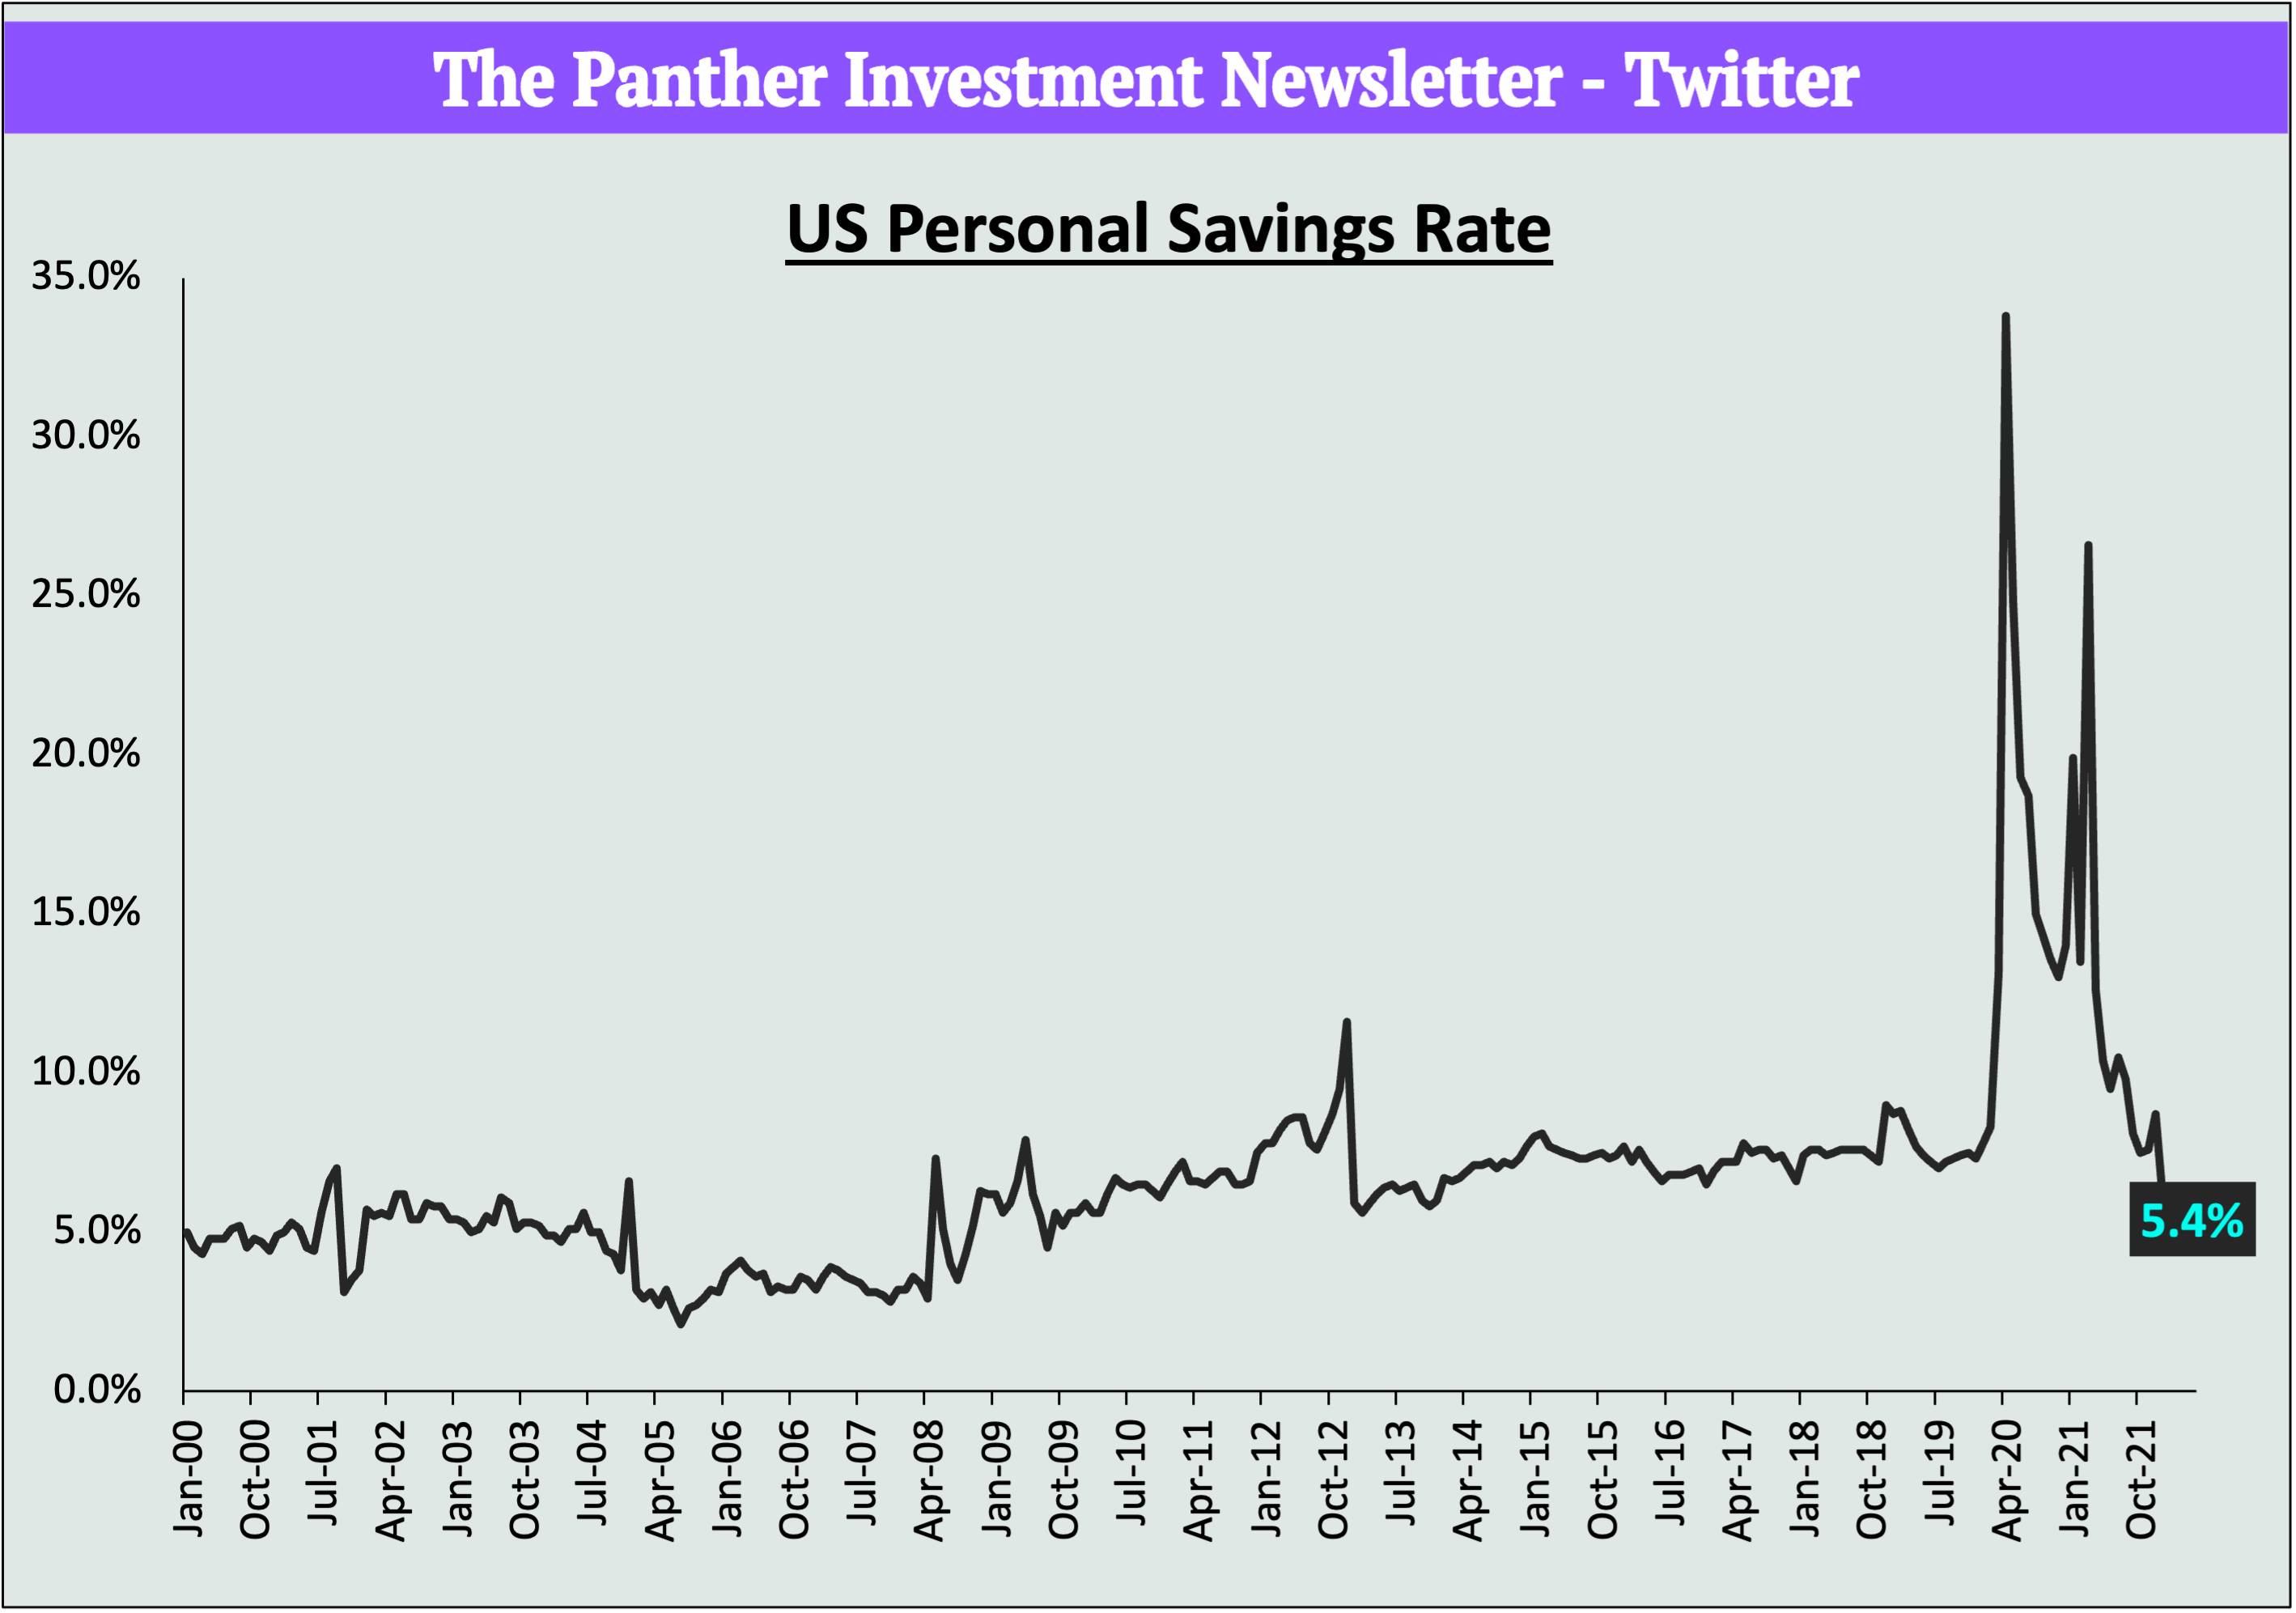
On a more positive note, the personal savings rate increased from 4.4% to 5.4% in May, a 3M high. But still, this remains the lowest since 2009. With current jobless/unemployment rates at 3.6%, the labour market no doubt remains strong which has helped to quell some fears of a potential recession.
But cracks are starting to appear. Tech firms, cryptocurrency brokerages, and real estate firms have all started to announce massive 10-20% job cuts. Jobless claims decreased slightly last week but remain near January highs. Demand for jobs are also expected to fall moving forwards, as the Fed proceeds with QT and rate hikes, coupled with firms anticipating weaker spending.
Ark’s Cathie Wood on Recession Risks
Ark’s Cathie Wood believes that we are already in a recession.
“We think a big problem out there is inventories… the increase of which I’ve never seen this large in my career. I’ve been around for 45 years.”
The innovation-focused investor said inflation turned out hotter than expected due to supply chain disruptions and geopolitical risks.
Atlanta’s Fed Tracker Screams Recession
GDPNow Tracker Guides For -2.1% Growth In Q2 (Atlanta FED) (Atlanta FED)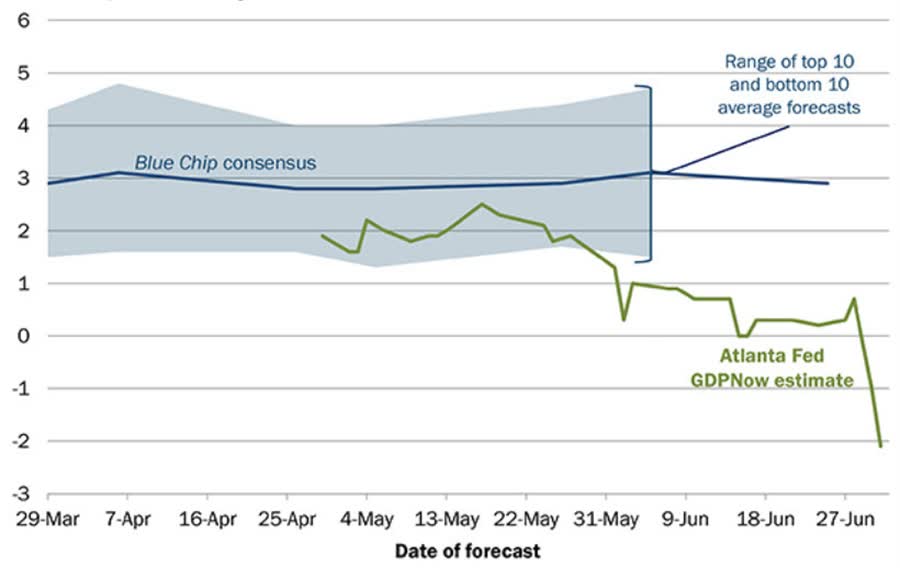
The Atlanta’s Fed GDPNow tracker that was revised downwards from +1.3% to +0.9% in less than a week, was further revised downwards to +0.0% growth for the entire Q2’22, suggesting the economy may have already dipped into a recession. This, however, was as of June 16.
The reading was then adjusted again to +0.3% and once last time Friday as the calendar quarter for Q2 came to a close. The final reading was a steep revision and now sees -2.1% growth. This forecasted Q2’22 GDP growth reading is worse than the actual-1.6% contraction that we witnessed in Q1, and by definition mean markets are definitively in a recession.
Whether this recession is deep/shallow remains to be seen.
GDPNow has a strong track record, and the closer we get to July 28th’s release [of the initial Q2 GDP estimate] the more accurate it becomes,” wrote Nicholas Colas, co-founder of DataTrek Research.
The ISM Manufacturing PMI Plunges
While Expansionary, 53 Is A Steep Drop From May’s 56.1 (Panther Research – Twitter)
In last week’s report I mentioned that the ISM PMI reading to beat was 56.1 – the reading for the month of May that surprised to the upwards. June readings however came in weaker than expected, registering a 3.1% drop to just 53%. While still indicative of an expansion and the 25th consecutive month of growth, the rollover in print was the lowest since June 2020.
New order rates are softening as inventories pile up.
The PMI which reflects the perception of purchasing managers towards orders in the coming month also pulled back as consumer sentiment and confidence begun cratering. Without a consumer that is willing to put his purchasing power to use and leverage ATH US household wealth, manufacturers themselves are bracing for a weaker demand.
“Orders usually lead the other 80% of the index, so we have to expect a further decline in the headline index in July,” said Ian Shepherdson, chief economist with Pantheon Macroeconomics.
Jim Coulter – The Multiple Reset (Phase 1, 2 & 3)
- Phase 1: Multiple Compression
- Phase 2: Earnings Revision
- Phase 3: The Landing
Jim Coulter believes that there is more pain ahead in equity markets, noting that the “first chapter” in a downturn is now largely complete and 2 more phases remain. This relates to the general drivers of prices being 1) multiples and 2) earnings. Coulter says that declines in stock market so far have been a function of a “multiple reset”.
He notes that investors should have clearly seen this coming relating to the absurd valuations, and “What was odd is not today, but last year”. In fact he believes that there may be more room to fall within the 1st phase itself, noting valuations remains significantly above the 10Y average.
However, what comes next will further weigh on stocks as inflation hits earnings across the S&P 500 and current expectations prove to still be too high. To hedge for this, Coulter is sticking with companies with higher pricing power. Eventually, the “third chapter” (the landing) in Coulter’s pattern will begin, and he has it pegged from sometime next year.
I talked about this more in a “valuation drivers” thread earlier in the week.
Chinese Equities
Chinese Markets Continue To Outperform
China’s CSI300 + HSTECH Continue To Outperform (Panther Research – Twitter)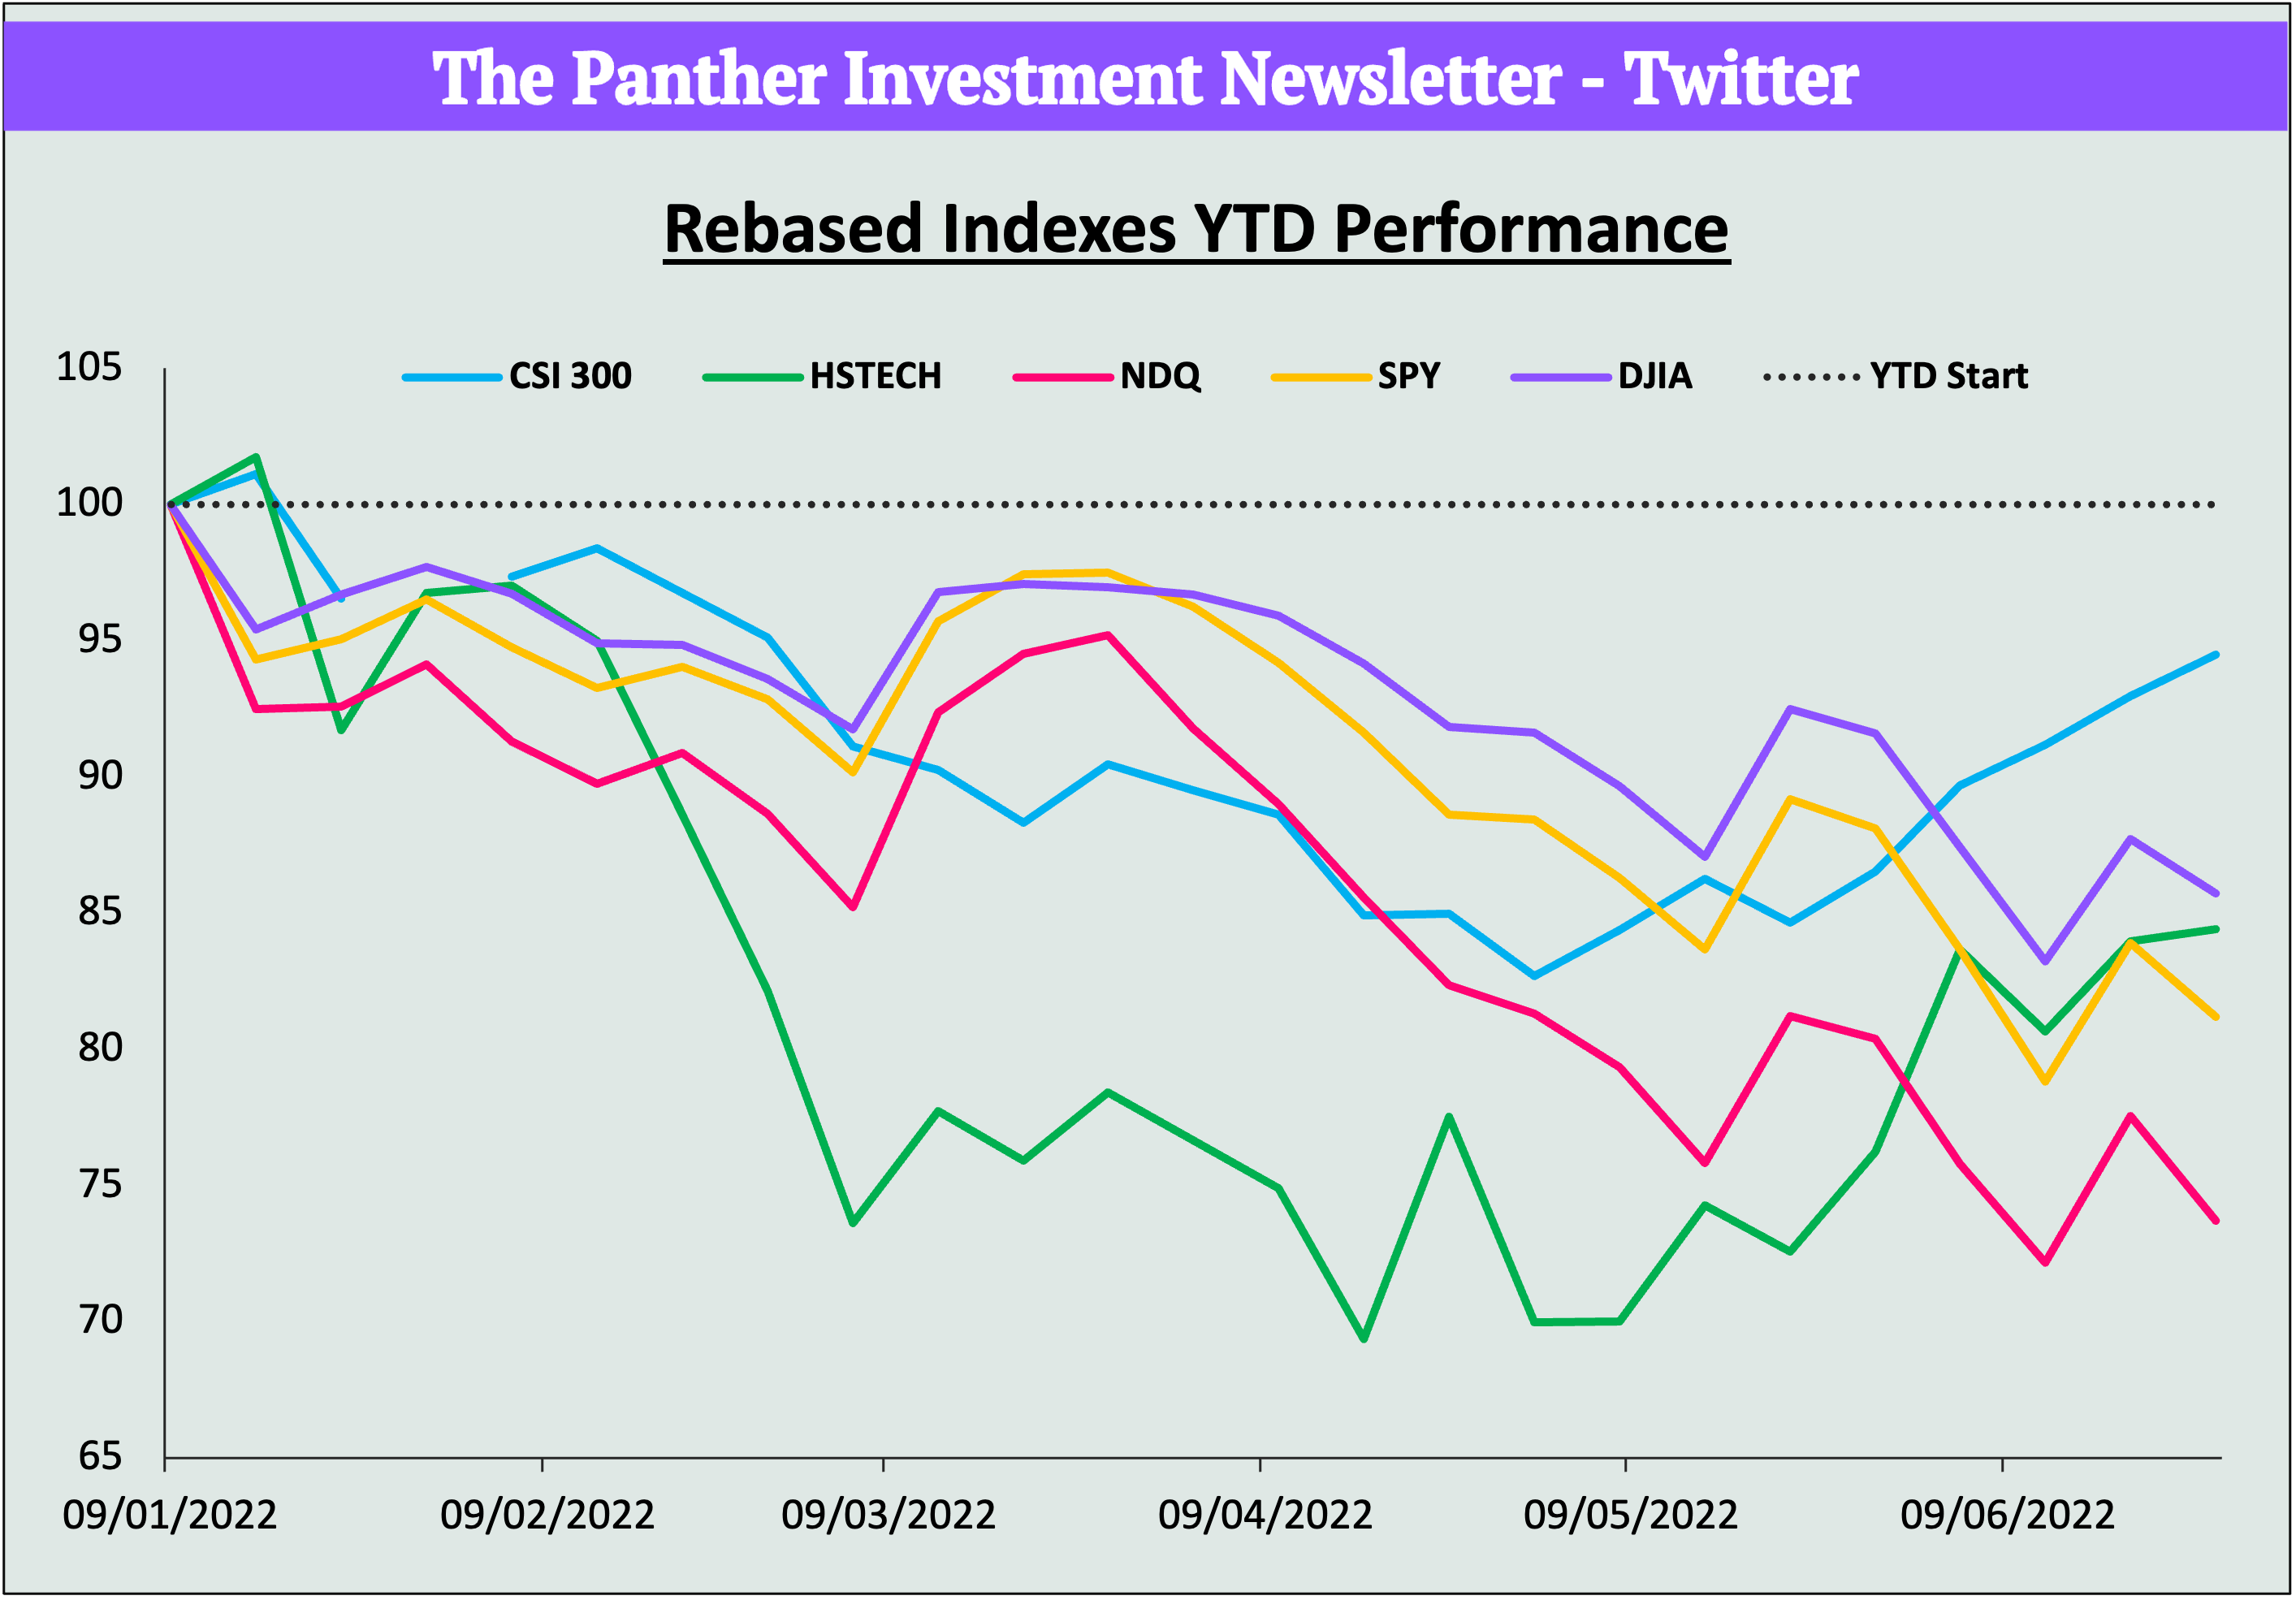
China has cut its required quarantine period for international travellers by half, to one week, in the first significant nationwide relaxation of restrictions since Covid-19 outbreaks in Shanghai and Beijing this year prompted draconian curbs on travel and economic activity. Governor Yi Gang also stated that the PBOC will maintain their supportive monetary policy to aid economic recovery.
U.S.-based China Beige Book claims that:
Chinese businesses ranging from services to manufacturing reported a slowdown in the second quarter from the first, reflecting the prolonged impact of Covid controls. Shanghai, China’s largest city by GDP, was locked down in April and May. Unsold goods piled up, except in autos. Orders for domestic consumption and overseas export mostly fell in the second quarter from the first. For now, median estimates for Q2 GDP growth point to +1.5%, down from the +4.8% in Q1. Official results for China’s GDP will be out July 15.”
The services sector staged the substantial greatest reversal, a potential worrying sign for the general consumption trends in China. “After accelerating in growth in the first quarter, services businesses saw revenue, sales volumes, capex and profits drop in the second quarter.”
What To Watch Next Week
- Monday: Markets closed (Independence Day) – Enjoy your Holidays!
- Wednesday: US Job Openings (May)
- Thursday: US Trade Balance (May)
- Friday: US Unemployment Rate (June)
- Friday: Average Hourly Earnings (June)
With that, thank you for joining me today. Till next time!
Be the first to comment