

vm/E+ via Getty Images
Everything boats
MarineMax, Inc. (NYSE:HZO) manages more than 40 brands that serve the various segments of the boat industry, making them the world’s largest recreational boat and yacht retailer. The majority of their business is powered by new boat sales and, to a lesser extent, by used boat sales, marine engines, parts and accessories, maintenance, repair, rent, and storage services. They also own/operate more than 50 marinas, which contributes to most of the high-margin growth. The company’s past and ongoing strategy for growth has been primarily through acquisitions.
Company’s Annual Report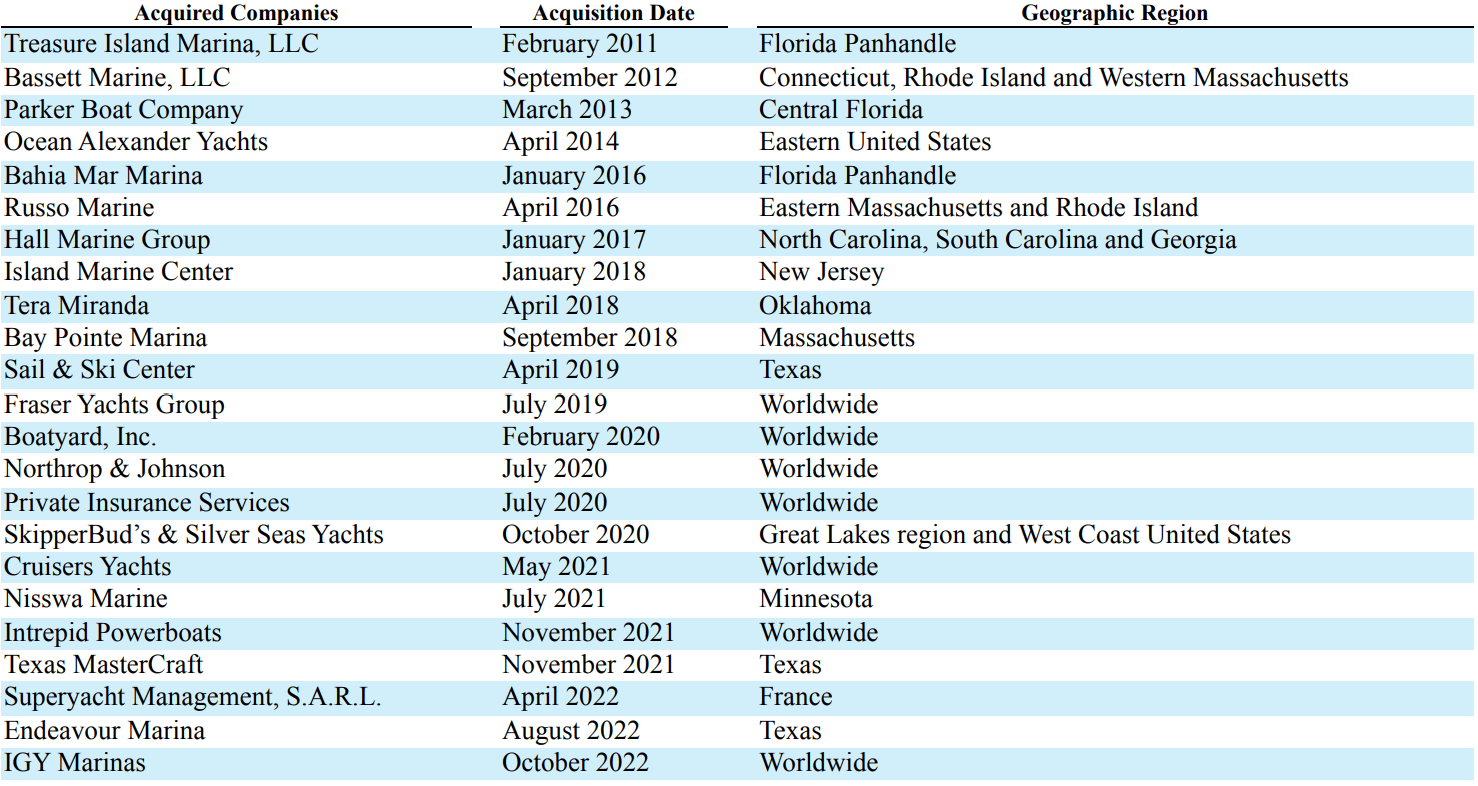
Even after multiple acquisitions and being the biggest retailer, the company is still quite small relative to the size of the U.S recreational boating industry, with retail sales of $2B in 2021 against industry retail sales of $56.7B. This shows the highly fragmented nature of the recreational boat industry, which is made up of lots of small companies owned by individuals, with a few players trying to consolidate and increase competition within the industry.
In the sections below, I will try to analyze what is going well for this business and why I would take a wait-and-watch approach before committing to be a shareholder in this company.
Reflection on growth and debt
By looking at just its financials, the first impression is that the company has been posting double-digit revenue growth for the past several years supported by growth in gross profit ratio and Net Income (>500% over the past 5 years). However, cash flows have been quite inconsistent.
Financial Snapshot (Company data – Author Collected ) Income statement growth (Company data – Author computed)
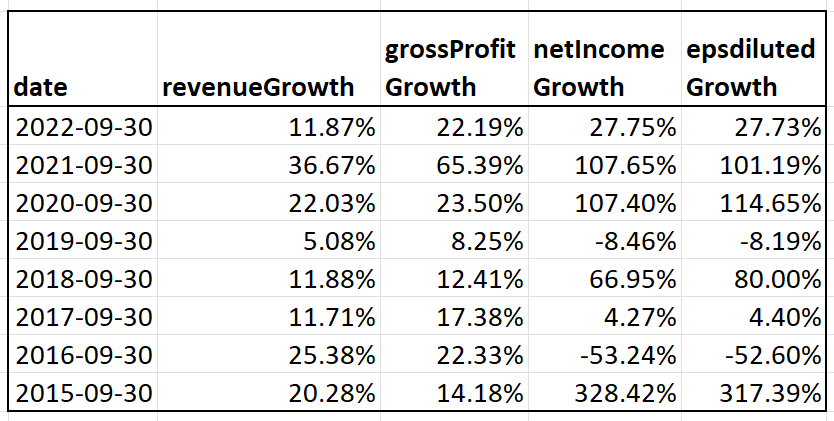
The primary thing to note would be that not all of this growth may be organic, and acquisitions contributed to growth in a big way.
From its most recent quarter earnings statement release (concluding quarter of 2022):
For the fiscal year ended September 30, 2022, revenue increased 12% to $2.31 billion compared with $2.06 billion for the prior fiscal year. The revenue increase was driven primarily by successful strategic acquisitions completed during the fiscal year and by strong same-store sales growth of 5% which was on top of a 13% increase last year.
Earnings statement release from 2021 (concluding quarter of 2021):
For the fiscal year ended September 30, 2021, revenue increased 37% to $2.06 billion compared with $1.51 billion for the same period last year. The revenue increase was driven primarily by successful strategic acquisitions completed during the fiscal year and by strong same-store sales growth of over 13% which was on top of a 25% increase in the prior fiscal year
I like to think that growth driven by acquisitions is acceptable as long as the cost of acquisitions doesn’t deteriorate the health of the balance sheet. So let’s see how the company’s liquidity and debt levels have fared over the years.
- Its current Assets ($754M) cover all of its liabilities ($570M)
-
Declining Debt to Equity ratio in the last five years and currently at 0.23.
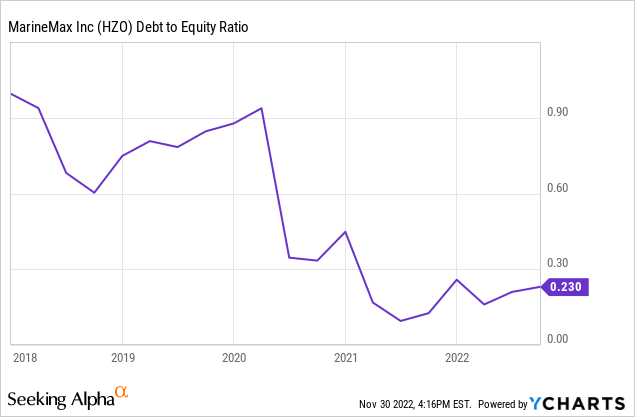
-
Current ratio has held steady and has been in the ideal range for the last five years.
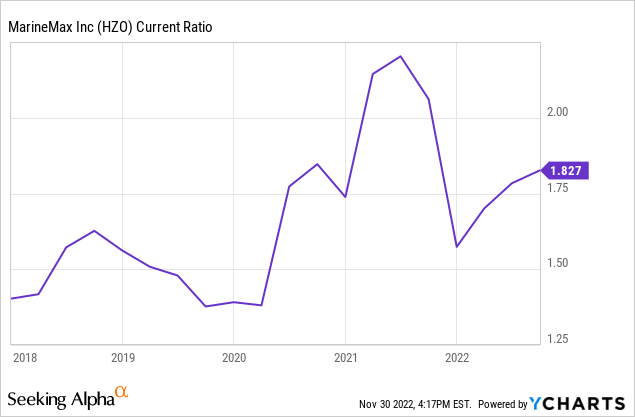
- Quick ratio of 0.67, which is less than ideal. This divergence of quick ratio value when compared to other liquidity ratios is because of high inventory levels which we will need to keep an eye on (also revisited in coming sections).
Good bargain
Seeking Alpha’s valuation page shows that the company scores the highest valuation grade relative to the Consumer Discretionary sector. A low P/E ratio of 3.6, a P.S multiple of 0.3 (far below sector medians) and a book value of less than 1 puts this in the value category (in theory, this means that the company is valued for less than what its assets are worth).
Valuation (Seeking Alpha Valuation page)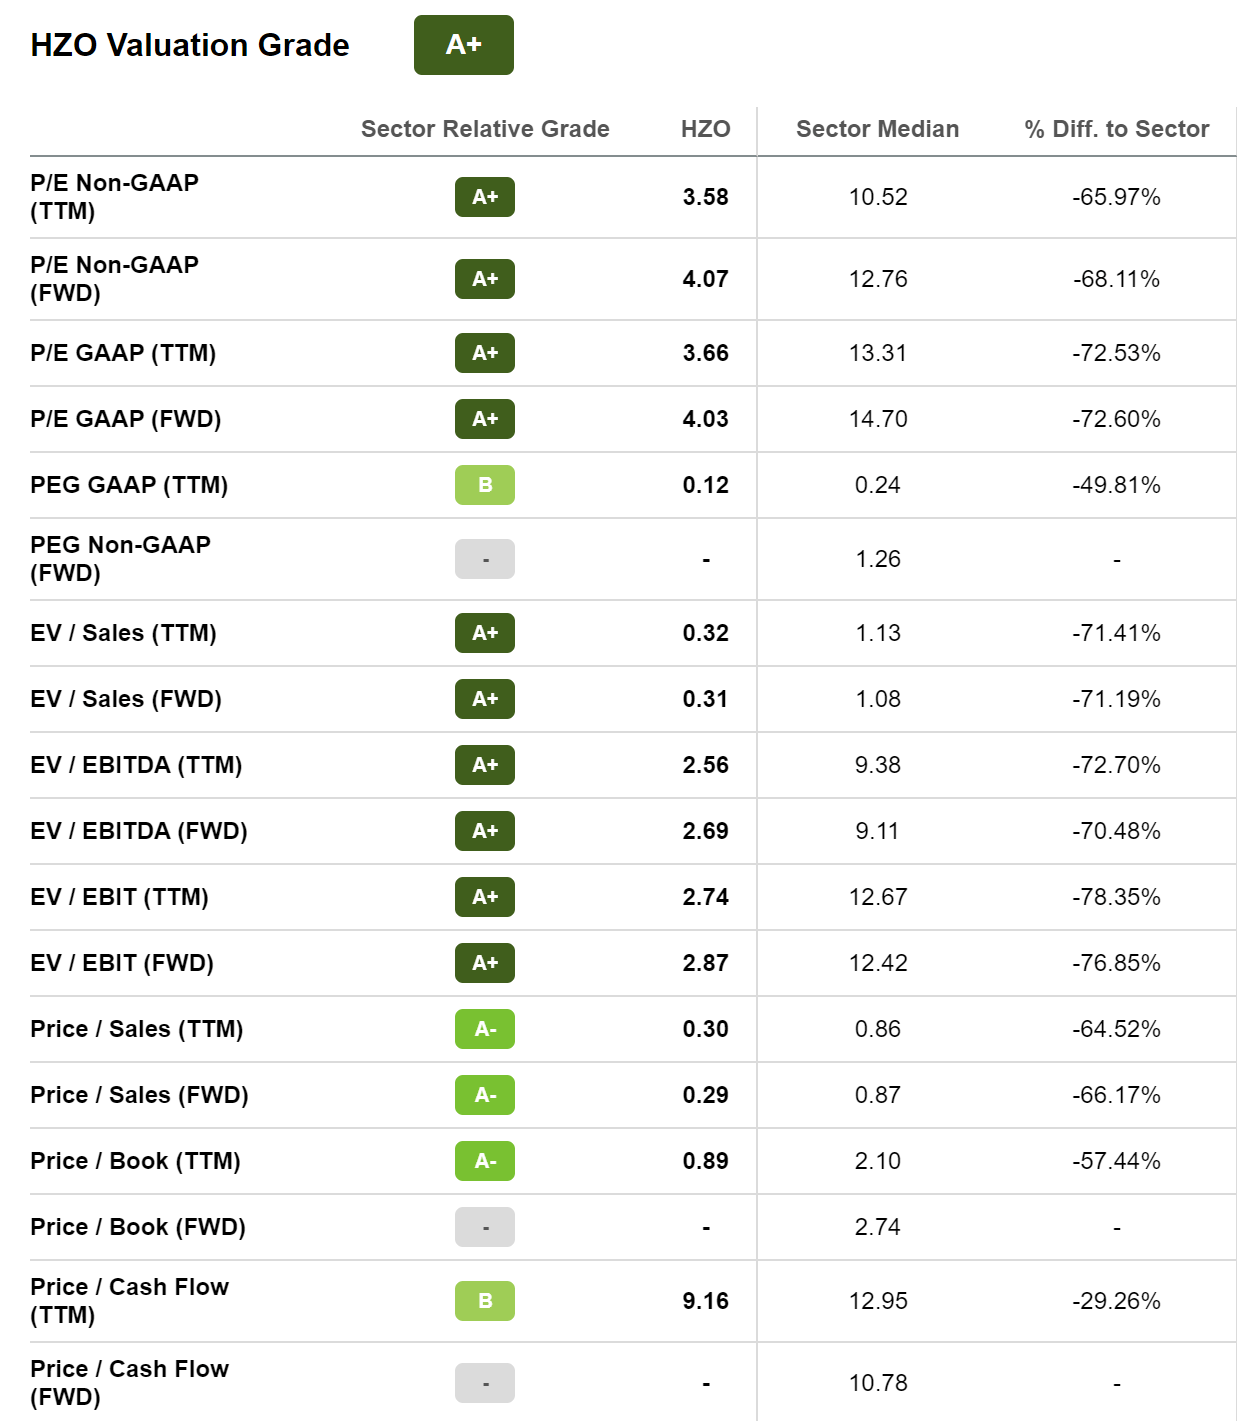
The only ratio of slight concern when compared to the rest would be Price to Operating Cash Flow, which has inflated over the past year mainly due to the decrease in operating cash flow tied to rising inventories.
Market’s pessimism
This is a company with a big correlation to the overall economy. Boats are notorious for their expensive upkeep, and their fuel costs are no joke, either. With the majority of the boat owners having annual household income of less than $100K, recreational boats would be one of the first expenses to take a hit in an economic downturn. In fact, this article from 2007 highlights just that. The boating industry has always proved to be a bellwether for the rest of the economy. The period between 2008 and 2011 also proved this, as the downturn then eventually led to excess dealer inventories and forced them to raise cash. Some went wholesale or even below wholesale prices.
All of this bad history for the boating industry is nothing but decline in discretionary spending during downturns, which is probably what the market is baking into this stock. Even though the company has grown in size and shown revenue growth, the stock is down more than 40% YTD and is trading at 2020 levels.
So what is the argument for MarineMax?
The argument for MarineMax is that the really affluent who own boats are not affected by inflation or recession, and they alone can move the needle for the company. There is some truth to this, as MarineMax has been able to show organic growth by showing an increase in average same store sales. Could this be connected to the affluent population? Digging through their recent 10-K, we see that although MarineMax offers recreational boats in all segments, the majority of the sales come from their premium segment. Their average selling price in 2022 for new boats is $256K (up from the year before by $30K) compared to the industry average selling price of $71K.
From their recent annual report:
Given our locations in some of the more affluent, offshore-oriented boating areas in the United States and emphasis on high levels of customer service, we sell a relatively higher percentage of large recreational boats, such as mega-yachts, yachts, and sport cruisers..
This indicates that their business could be resilient and insulated to a certain degree.
Wait and watch
MarineMax, Inc. stock is on my radar for its cheap valuation and its acquisition-fueled growth, which has worked in its favor so far. It is also consolidating in a highly fragmented industry which may give it its own edge in the future. But I am going to wait until this one data point improves which would give me full conviction to buy this stock.
Rising Inventories
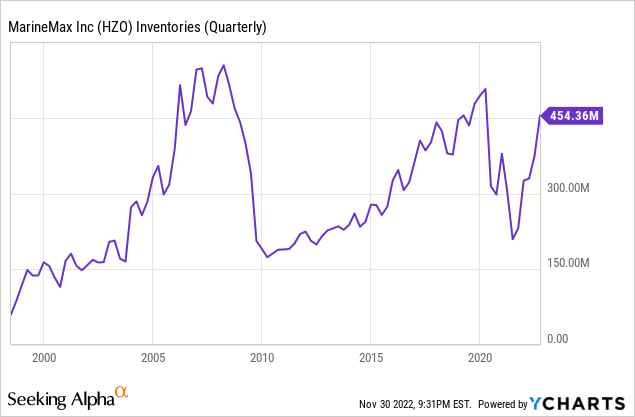
Inventories are close to the highest levels, and when I was looking back at the period leading up to 2008, I saw a similar pattern. Evidently it looked like the company wrote off a significant portion of inventories in 2009 and took a hit to its gross profit margins:
The decrease in gross profit as a percentage of revenue was due to margin pressure arising from the difficult retail environment and the aggressive pricing strategy that we deployed to drive a significant reduction to our inventory levels..
I hate basing my decisions on one indicator, but I cannot shake the indecision over whether this indicator is a harbinger of bad things to come or merely something that would get addressed in the coming quarters.
Even though MarineMax boasts of an affluent clientele this time around and may not see the same effects to its business as last time, I would like to be patient and wait for this to get addressed in the coming quarters before committing to be a shareholder of this company.
Signing off with a Charlie Munger quote on the virtue of patience –
The big money is not in the buying or the selling, but in the waiting.
Be the first to comment