

imaginima
A guest post by Ovi
Below are a number of crude oil plus condensate (C + C ) production charts for Non-OPEC countries created from data provided by the EIA’s International Energy Statistics and updated to March 2022. This is the latest and most detailed world oil production information available. Information from other sources such as OPEC, the STEO and country specific sites such as Russia, Brazil, Norway and China is used to provide a short-term outlook for future output and direction for a few countries and the world.
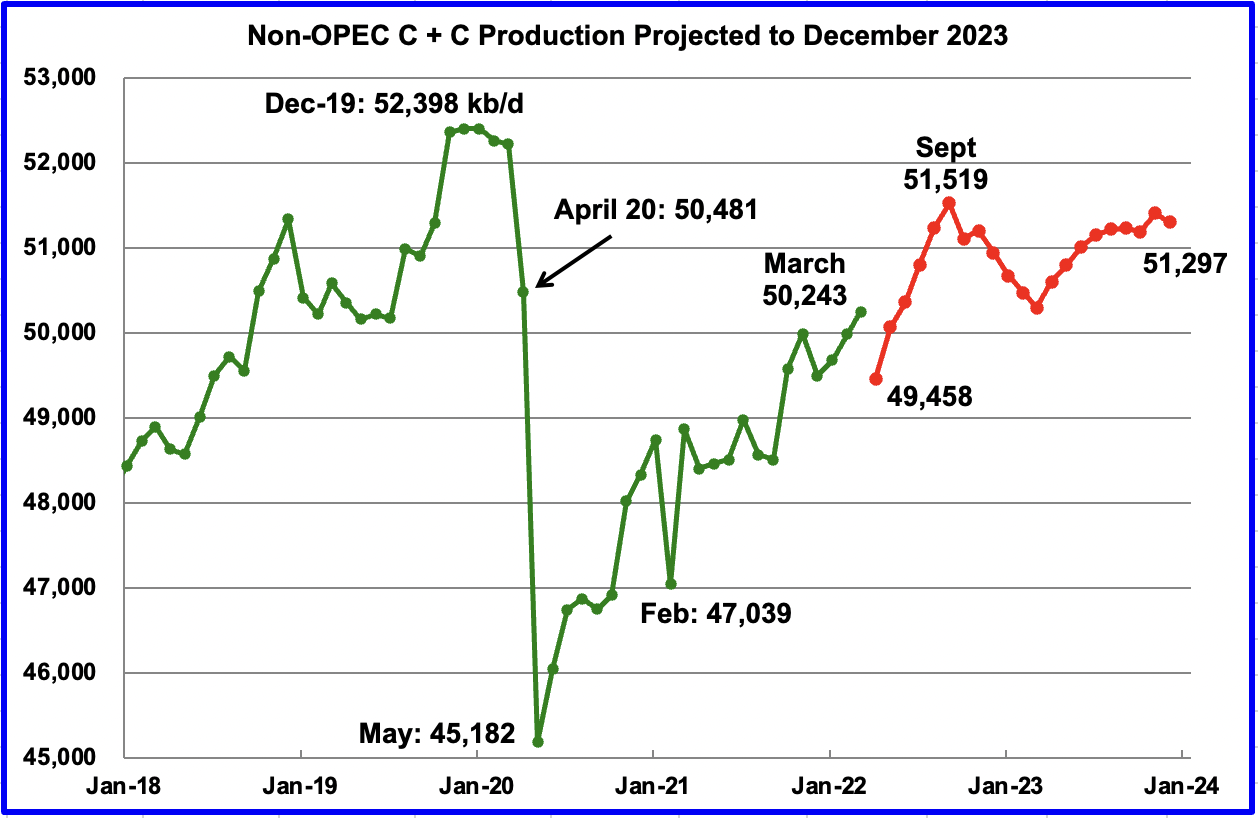
March Non-OPEC production increased by 264 kb/d to 50,243 kb/d. Of the 264 kb/d increase, the biggest increases came from the U.S., 349 kb/d and China, 78 kb/d. Offsetting the increases were decreases from Kazakhstan, Russia and Norway. The March 2022 output of 50,243 kb/d is 1,975 kb/d lower than the March pre-covid rate of 52,218 kb/d.
Using data from the July 2022 STEO, a projection for Non-OPEC oil output was made for the time period April 2022 to December 2023. (Red graph). Output is expected to reach 51,297 kb/d in December 2023. Note the April production drop of 785 kb/d to 49,458 kb/d in the red graph is associated with a projected output drop in Russia. The production rise to 51,519 kb/d by September is related to projected increases by OPEC + and the U.S.
The April 785 kb/d production drop may be realistic since according to this source, April Non-OPEC all liquids production dropped: “Non-OPEC production saw a decrease of 810,000 bpd to 64.92 million bpd in April”.
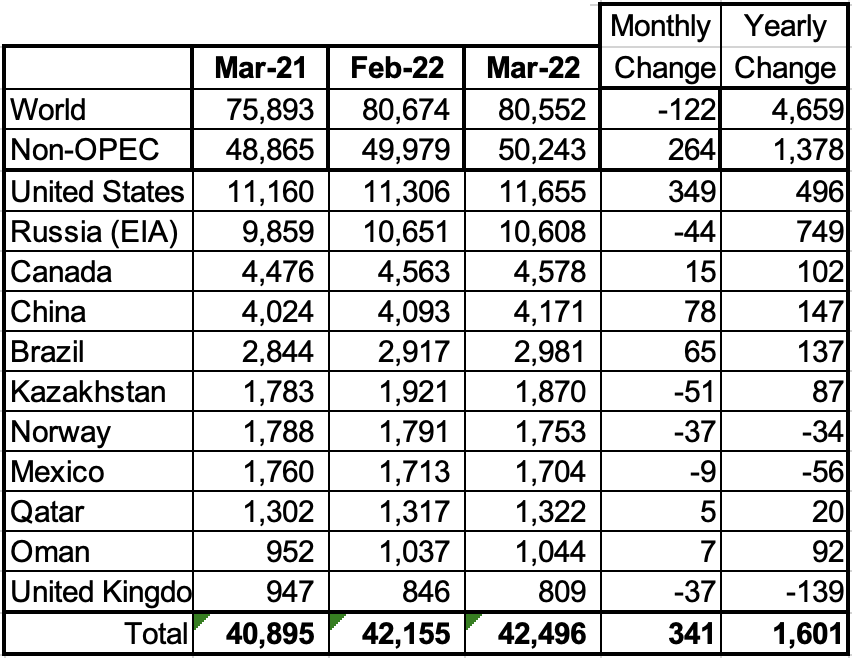
Above are listed the world’s 11 largest Non-OPEC producers. The original criteria for inclusion in the table was that all of the countries produced more than 1,000 kb/d. The UK has been below 1,000 kb/d since January 2021.
In March 2022, these 11 countries produced 84.6% of the Non-OPEC oil. On a YoY basis, Non-OPEC production increased by 1,378 kb/d while on a MoM basis production, it increased by 264 kb/d. World YoY March output increased by 4,659 kb/d.
Production by Country
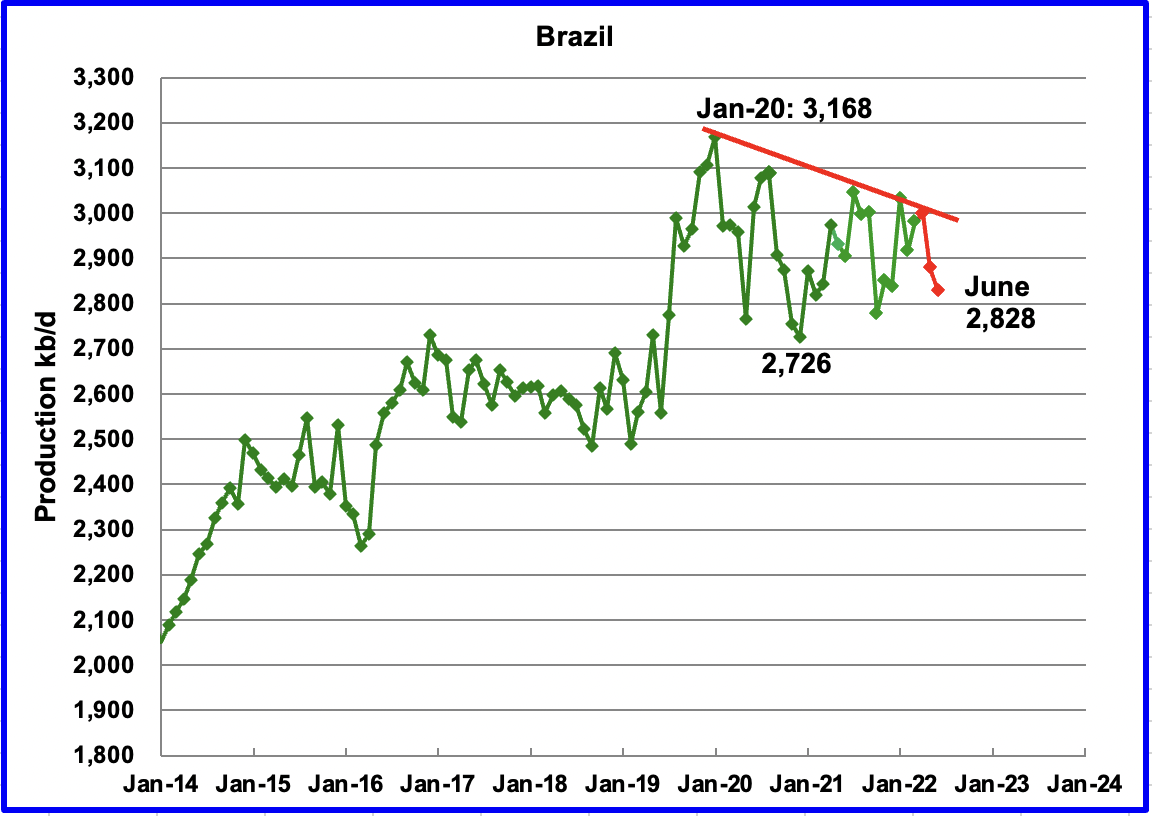
The EIA reported Brazil’s March production increased by 65 kb/d to 2,981 kb/d.
Brazil’s National Petroleum Association (BNPA) reported that May’s output decreased by 123 kb/d to 2,879 kb/d, reversing April’s increase of 18 kb/d. (Red Markers). On a YoY basis, May production is down 53 kb/d. May’s output drop was mainly due to interruptions in offshore maintenance at the Tupi field, according to OPEC.
On July 20, 2022, the BNPA reported that June production dropped again. No information on the June drop to 2,828 kb/d is available. However, a new field came on line on May 1, 2022 and it is surprising that no production increase was reported for June.
Petrobras did announce that “Second quarter production was also affected by an increase in maintenance stoppages”. Are pre-salt fields proving to be more difficult to produce than anticipated?
On May 1, MODEC’s FPSO Guanabara MV31 for Brazilian presalt achieved first oil.
TOKYO, Japan — MODEC Inc.’s FPSO Guanabara MV31 deployed for operations at the Mero Field in the giant presalt region of the Santos Basin off the coast of Brazil, achieved first oil production and started charter services on May 1. It is the largest FPSO built by the company to date.
Moored some 180 km off the coast of Rio de Janeiro at a water depth of approximately 2,100 m, the FPSO is capable of processing 180,000 bbl of crude oil, 424 MMscf of gas and 225,000 bbl of water injection per day, and it has storage capacity of 1.4 MMbbl of crude oil.
Is water injection becoming standard practise for Deep Water wells/basins?
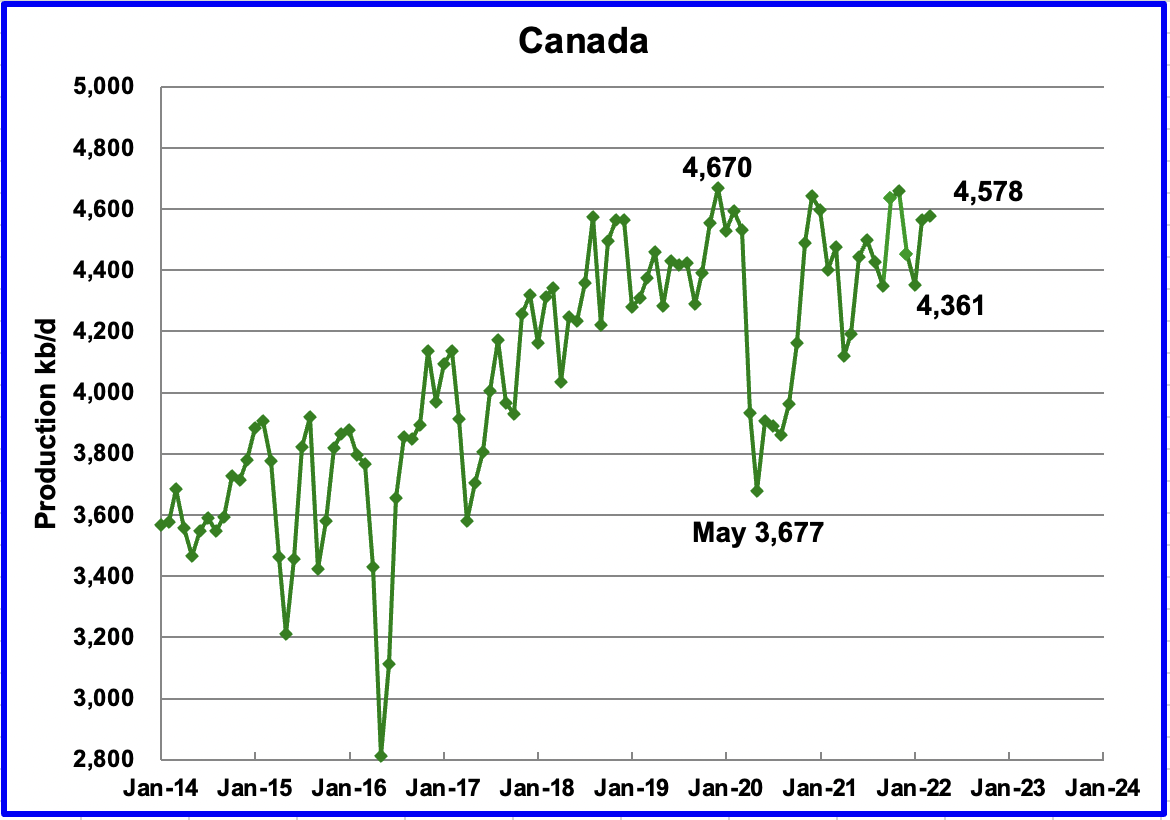
According to the EIA, Canada’s March output increased by 15 kb/d to 4,578 kb/d. Preliminary data from the Canadian Energy Regulator indicates that synthetic crude production was down by 100 kb/d in April.
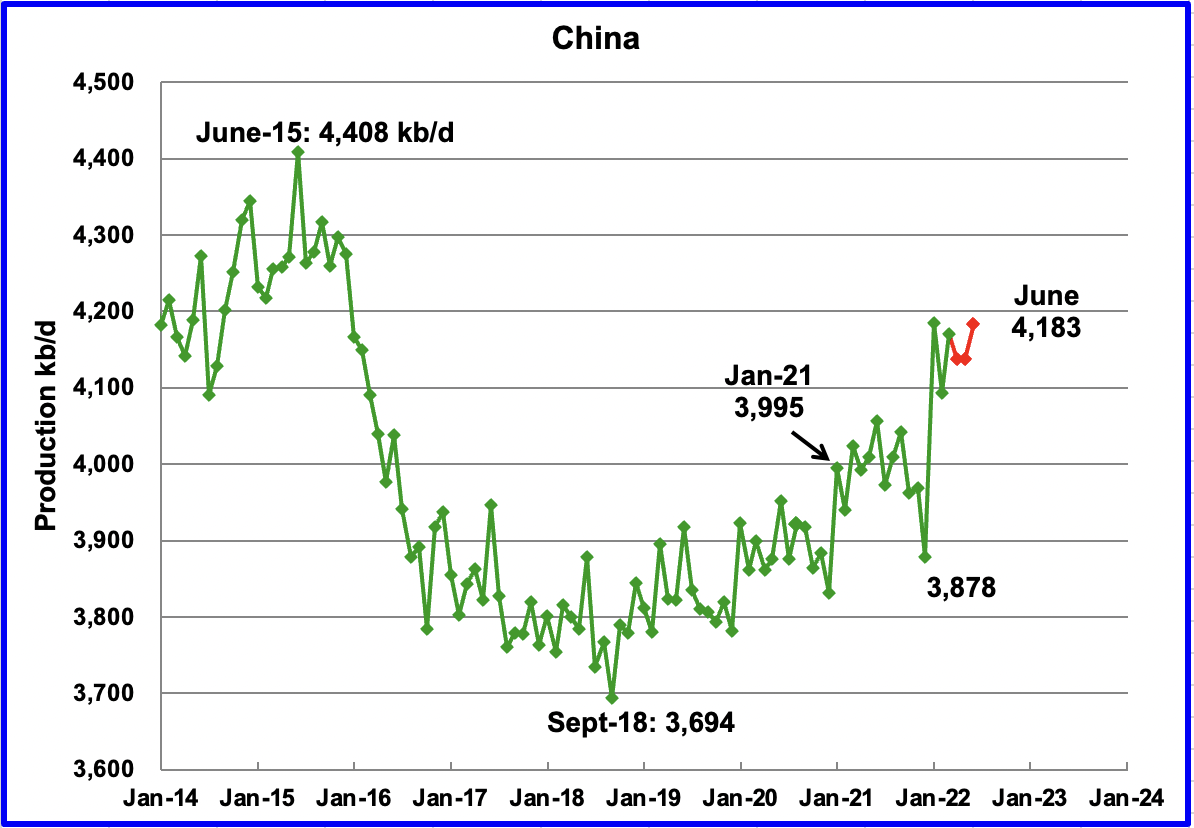
The EIA reported China’s output increased by 78 kb/d to 4,171 kb/d in March. China reported that its output dropped in April and May and increased in June by 46 kb/d to 4,183 kb/d. (Red markers).
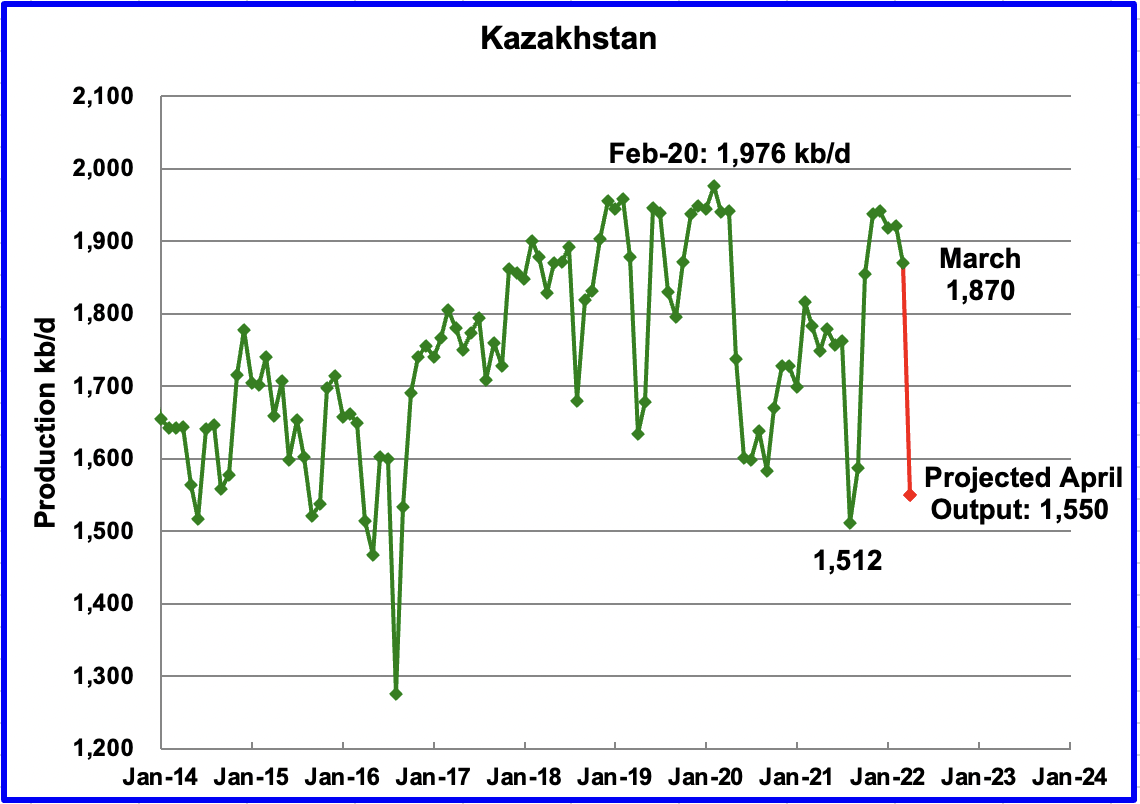
Kazakhstan’s output decreased by 51 kb/d in March to 1,870 kb/d. April output is projected to drop further due to required repairs at a damaged loading terminal in a Black Sea port in Russia, according to this source. The projected drop is 320 kb/d.
“Although energy market observers are bound to link the cutback to the loading terminal incident, Kazakh officials are selling this development as a planned measure to bring the country in compliance with OPEC commitments.”
OPEC reported that Kazakhstan crude production dropped to 1,400 kb/d in April. According to this source: “The data shows output running between 1.5 million and 1.57 million barrels per day on April 4 and 5.”
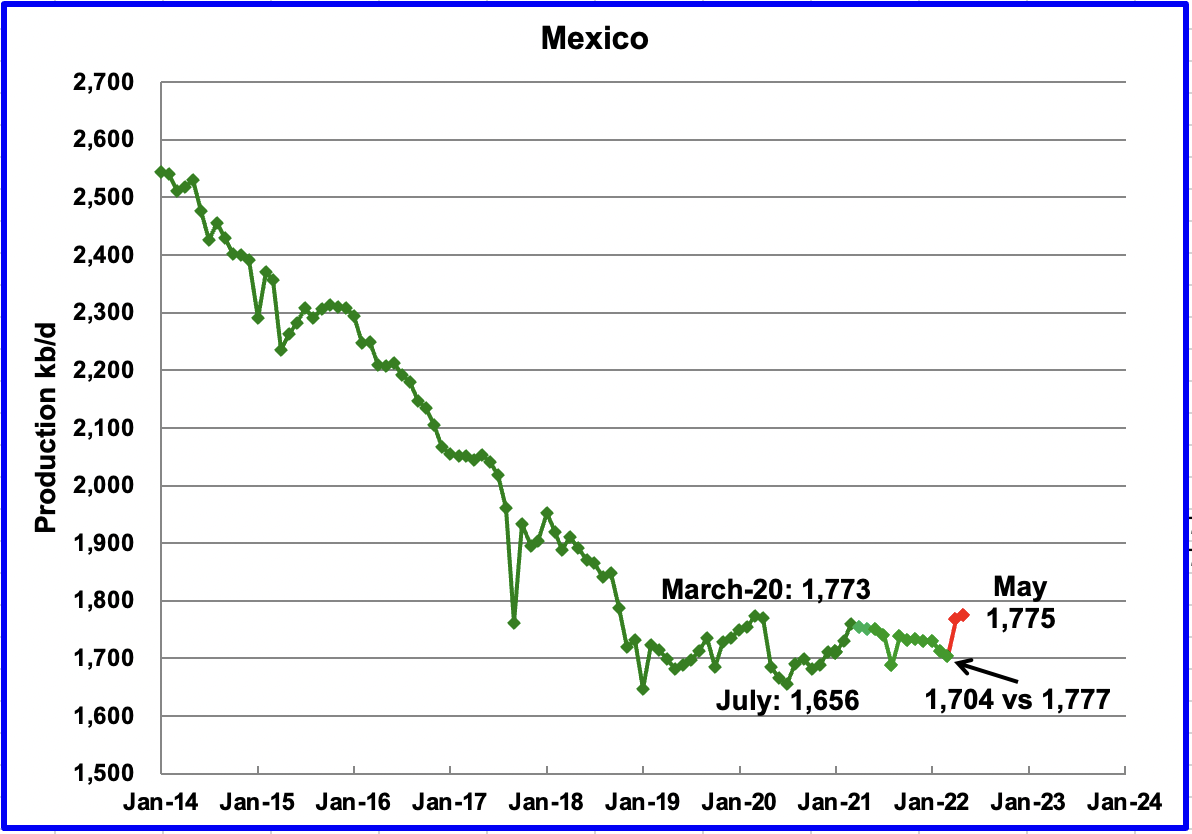
Mexico’s production as reported by the EIA for March dropped by 9 kb/d to 1,704 kb/d.
Data from Pemex showed that May’s output was 1,775 kb/d. However, the EIA reduces Mexico’s official oil production by close to 70 kb/d each month. Note that March was revised down from 1,777 kb/d to 1,701 kb/d. A possible explanation is that Mexico’s definition of condensate may be different than the EIA’s.
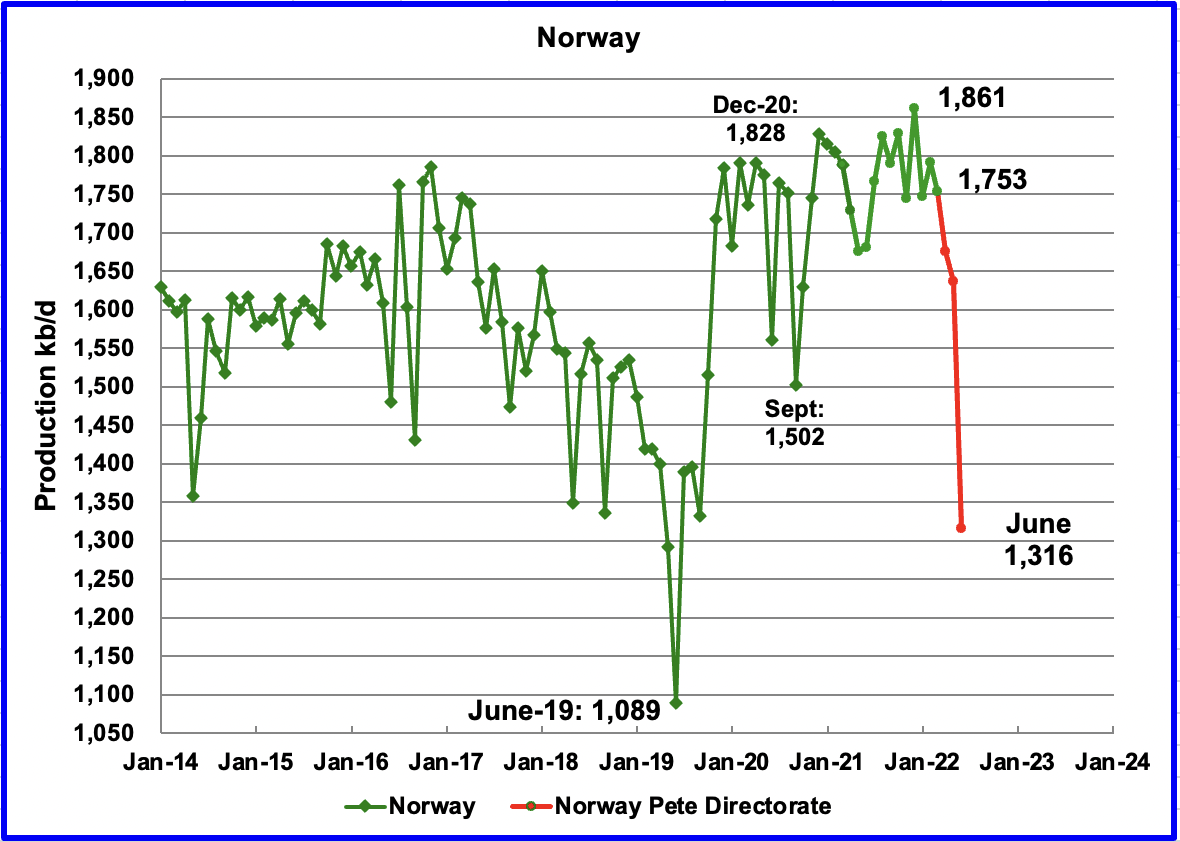
The EIA reported that Norway’s March production decreased by 37 kb/d to 1,753 kb/d.
The Norway Petroleum Directorate (NPD) reported that production decreased from April to June to 1,316 kb/d. (Red markers.). According to the NPD: “: Oil production in June is 0.2 percent lower than the NPD’s forecast and 4.2 percent lower than the forecast so far this year.
According to OPEC, the continuing drop was due to summer maintenance in offshore platforms and some operators prioritizing gas production.
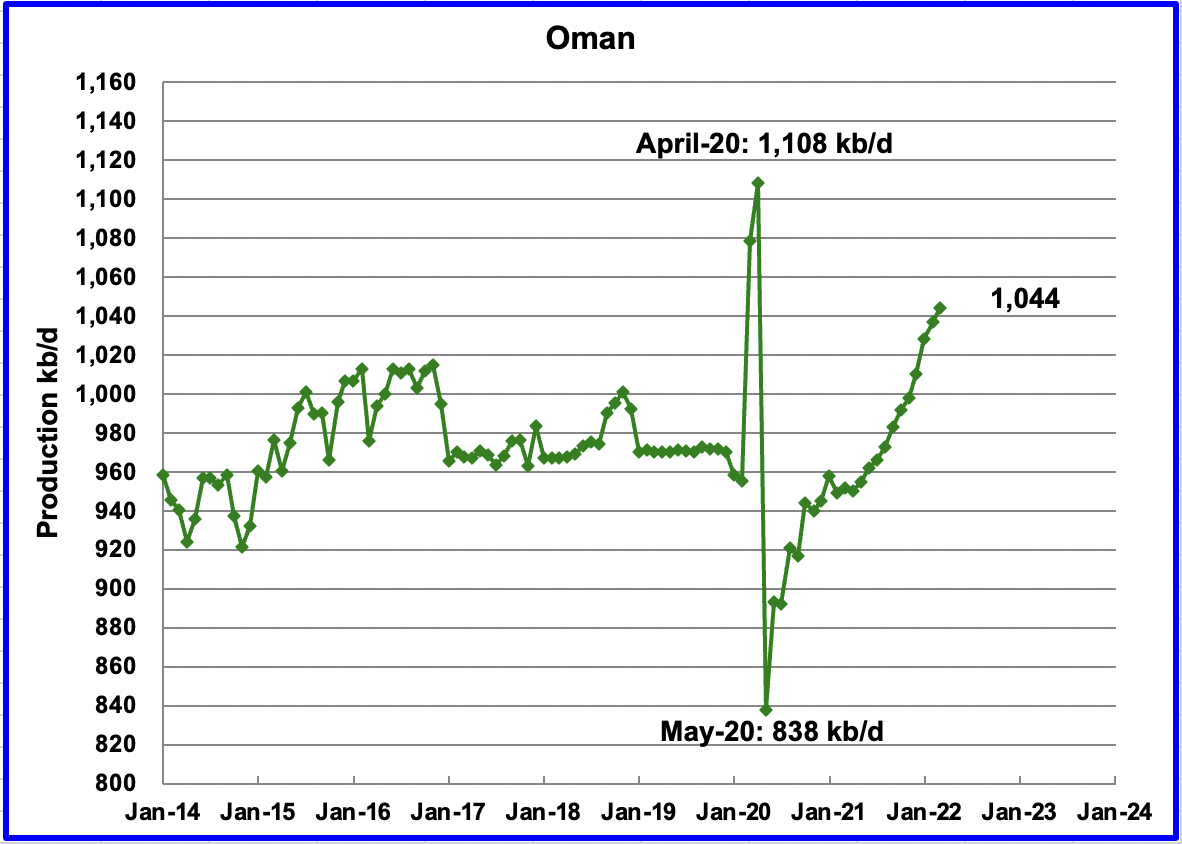
Oman’s March production increased by 7 kb/d to 1,044 kb/d.
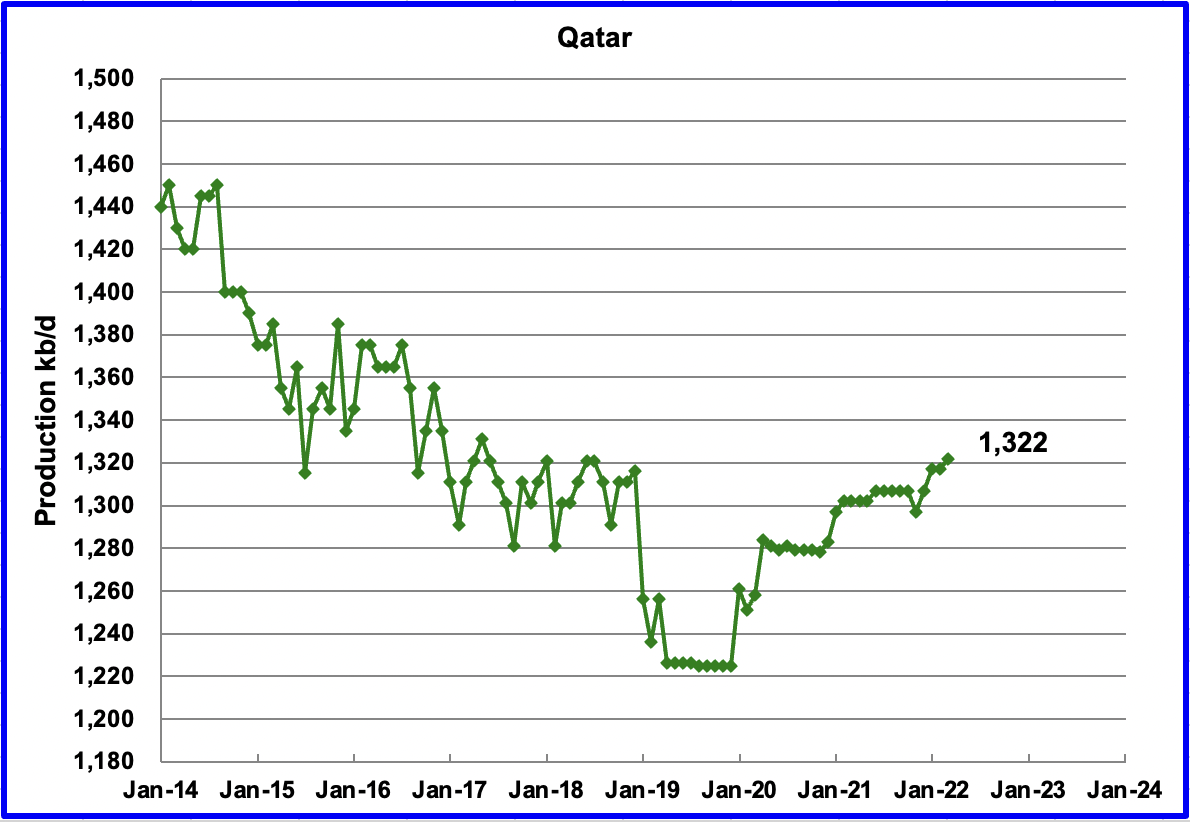
March’s output increased by 5 kb/d to 1,322 kb/d.
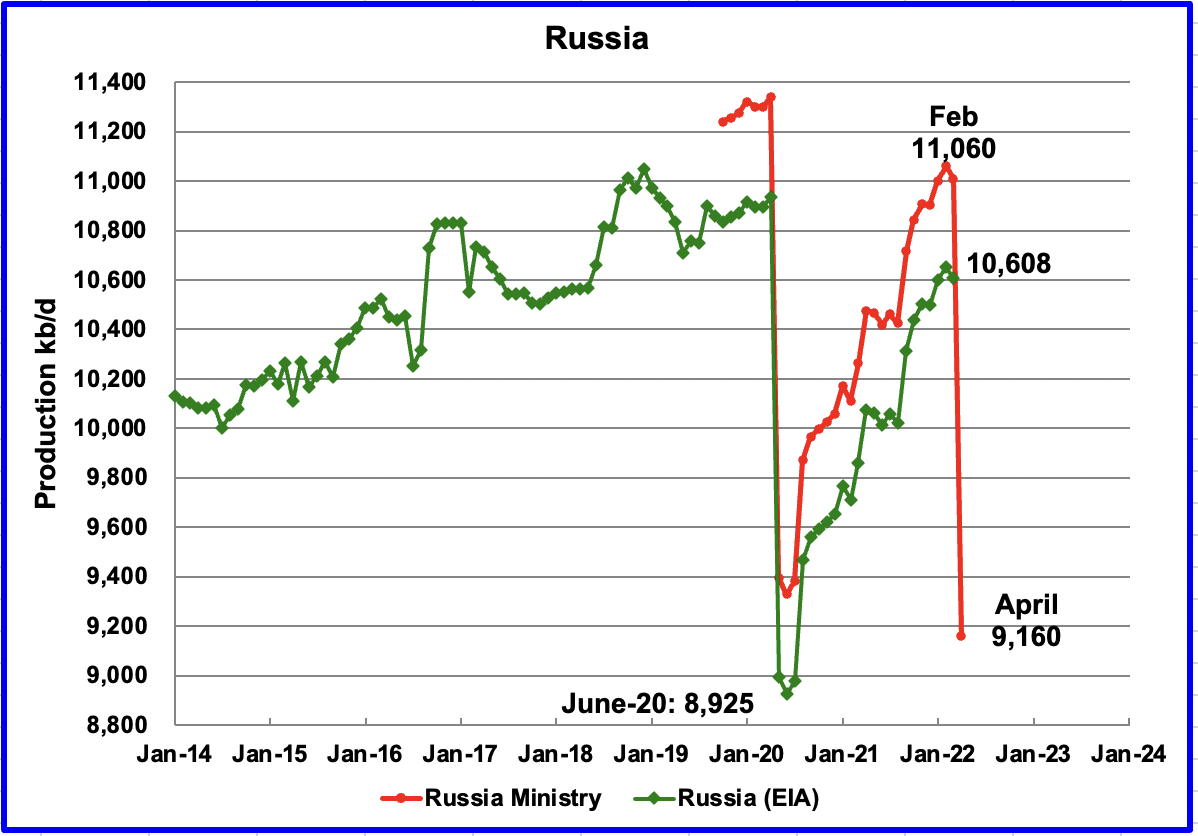
The EIA reported that Russian output decreased by 44 kb/d in March to 10,608 kb/d. According to this source, April’s production decreased to 9,160 kb/d.
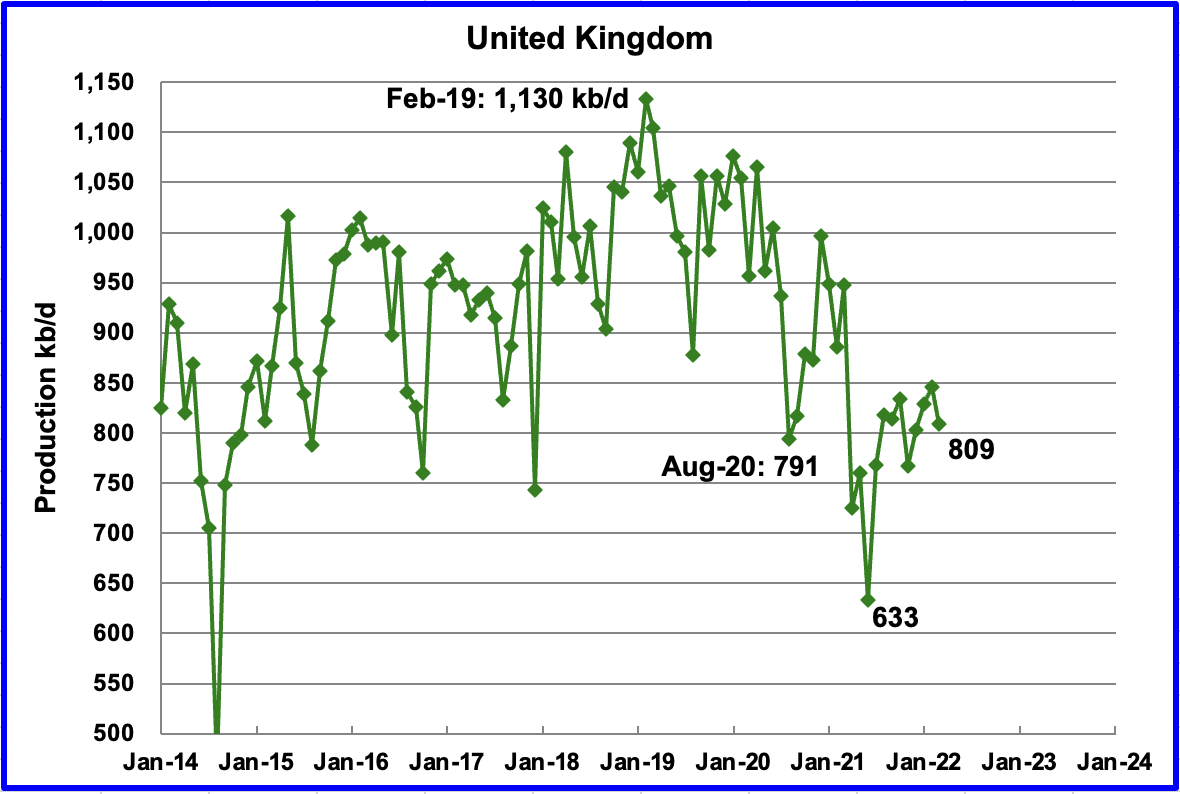
UK’s production decreased by 37 kb/d in March to 809 kb/d. The chart indicates that UK oil production entered a steep decline phase starting in February 2019. On a YoY basis production is down 138 kb/d. April output is expected to increase by close to 80 kb/d according to OPEC.
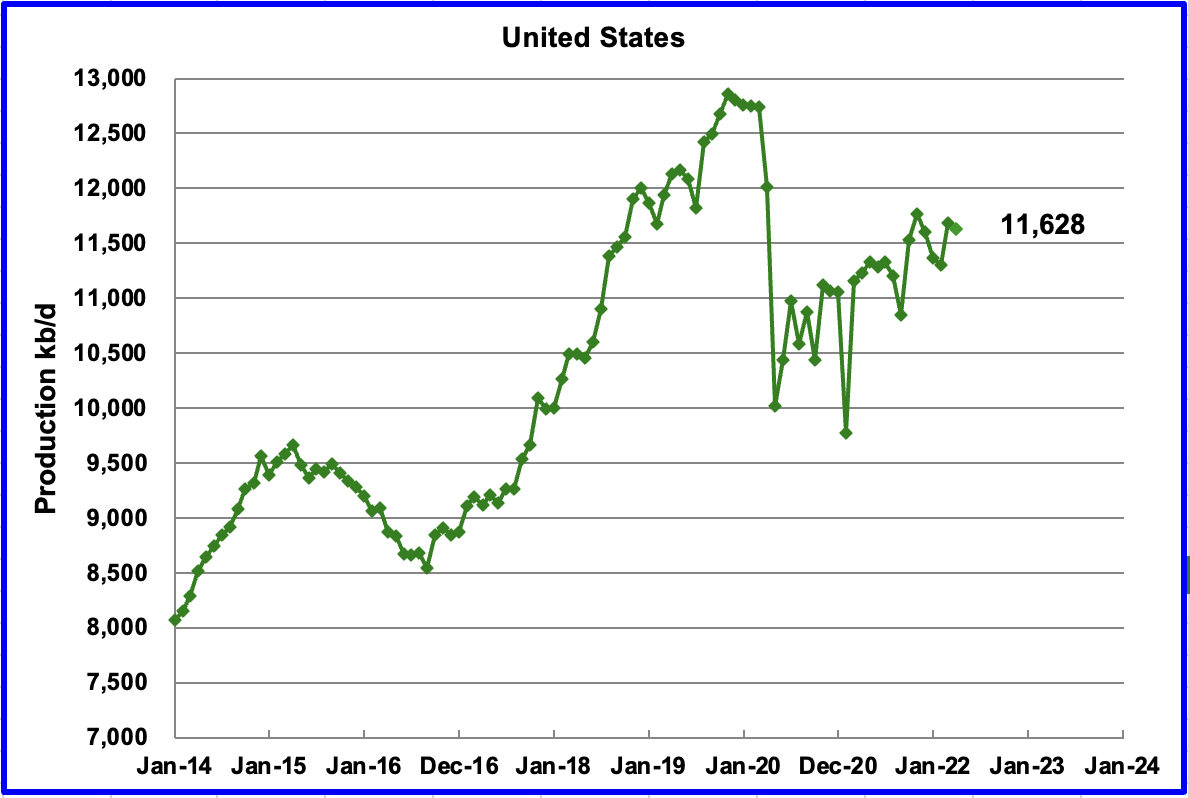
U.S. April production decreased by 60 kb/d to 11,628 kb/d. The largest production increase came from the GOM but North Dakota’s drop of 214 kb/d overcame the GOM increase.
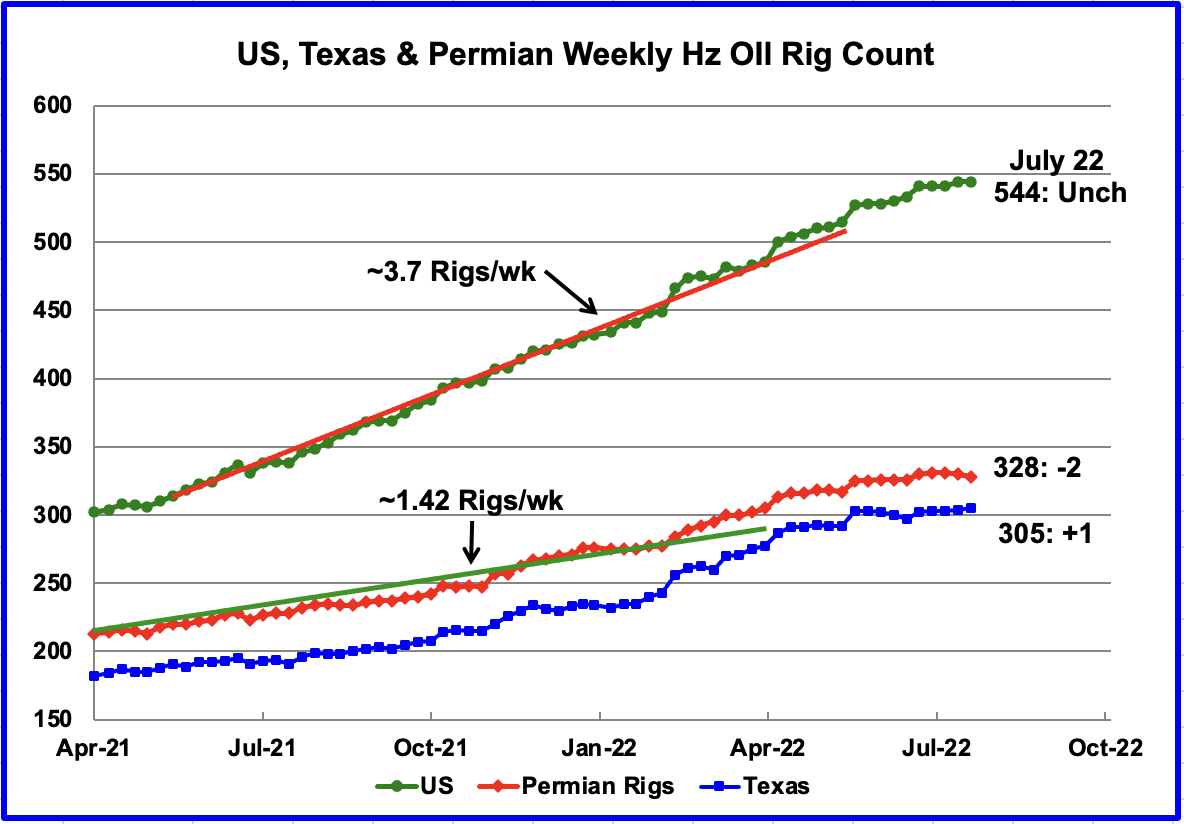
From the beginning of May 2021 to the end of April 2022, the US has been adding horizontal oil rigs at an average rate of close to 3.7 rigs/wk. The primary destination for rig additions appears to have been the Permian and Texas. However, recent data for the last 10 weeks indicates that the rig counts in the Permian and Texas has been essentially unchanged.
For the week ending July 22, the US horizontal oil rig count was unchanged at 544. The Permian dropped 2 while Texas added 1.
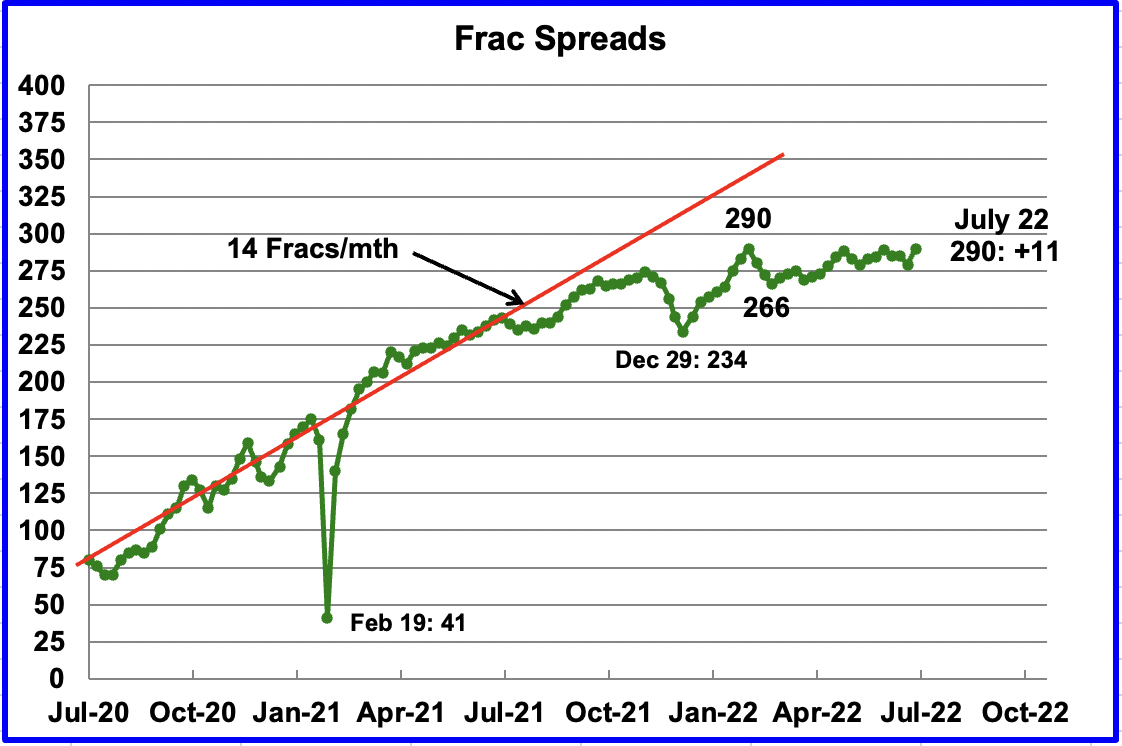
For the past few months, the growth in frac spreads has not been keeping up with the growth in rigs. In the week ending July 22, 11 Frac Spreads were added for a total of 290. The 290 matches the number of Frac Spreads operating in the week of February 25. It is not clear if last week’s increase of 11 Frac Spreads reflects a return to work of personnel after the Independence day holiday or just a correction of an incorrect count for the previous week.
Note that these 290 Frac Spreads include both gas and oil spreads, whereas the rig information is strictly for horizontal oil rigs.
One of the reasons for the slow growth of Frac Spreads is consolidation within the fracking industry according to this source. The effect of slowing growth in Frac Spreads is shown in the next chart.
“Nearly 360 spreads were active in early 2020 but the oil service industry has since consolidated, cutting capacity. “Two years of supply attrition and cannibalisation, plus limitations from labour shortages and a secular shift toward next-generation frac fleet technologies, have led to tightening in the frac space,” Liberty Oilfield Services chief executive Chris Wright says”.
“Rising costs, supply chain bottlenecks and a lack of investor capital are impeding a faster recovery in US tight oil production despite very high oil prices and government pleas for firms to boost supply. “I understand the desire to find a quick fix for the recent spike in gasoline prices,” Pioneer Natural Resources chief executive Scott Sheffield told the House of Representatives Energy and Commerce Committee on 6 April. “But neither Pioneer nor any other US producer can increase production overnight by turning on a tap.”
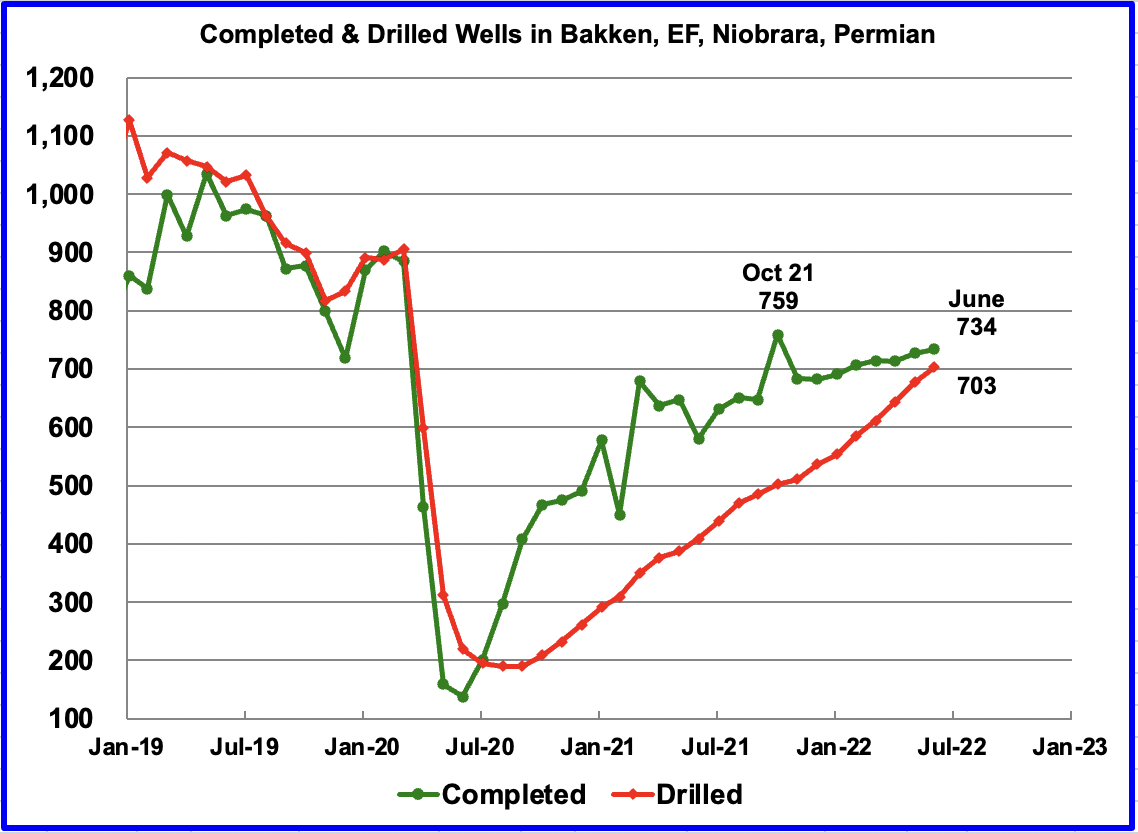
The impact of the slowing growth in Frac Spreads since last November can be seen in this chart. From November 2021 to June 2022, the monthly completion rate of wells/DUCs has slowed relative to the rate in 2021. More wells were completed in October 2021 than in June 2022, 759 vs 734.
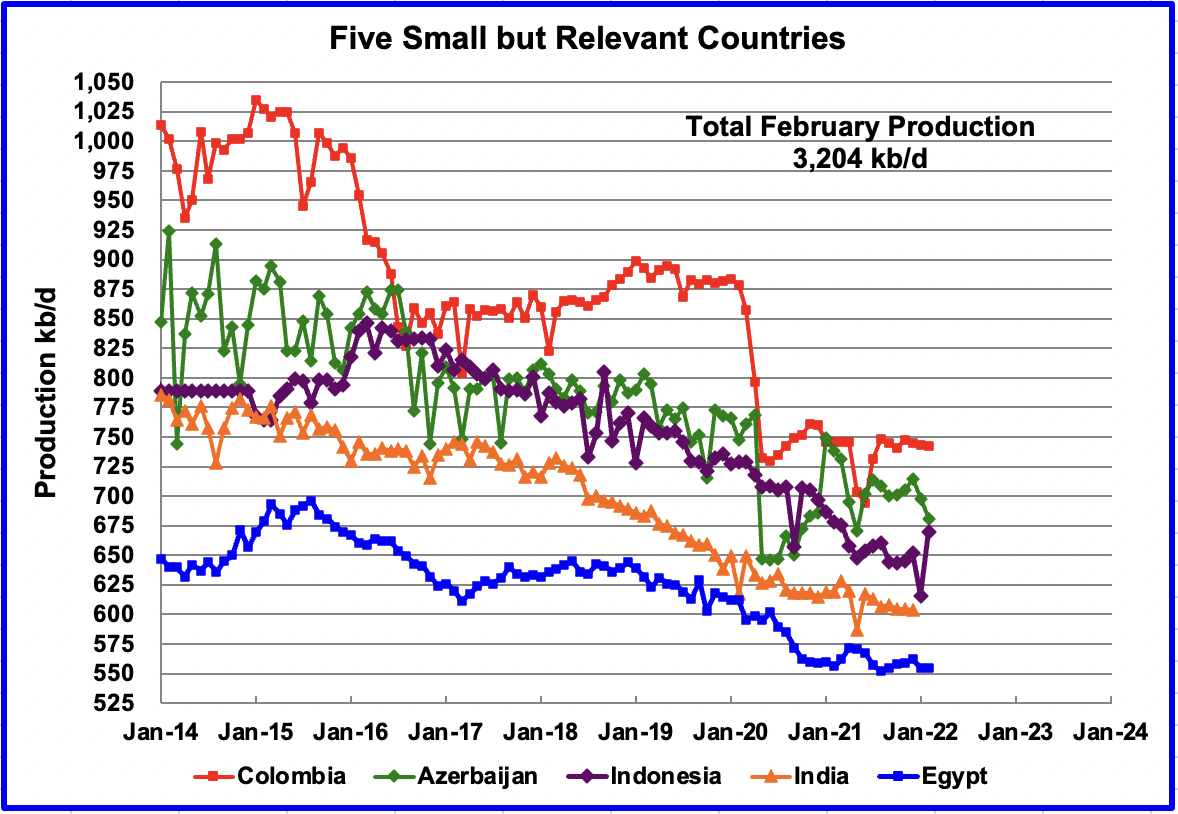
These five countries complete the list of Non-OPEC countries with annual production between 500 kb/d and 1,000 kb/d. Their combined March production was 3,204 kb/d, down 49 kb/d from February’s 3,253 kb/d.
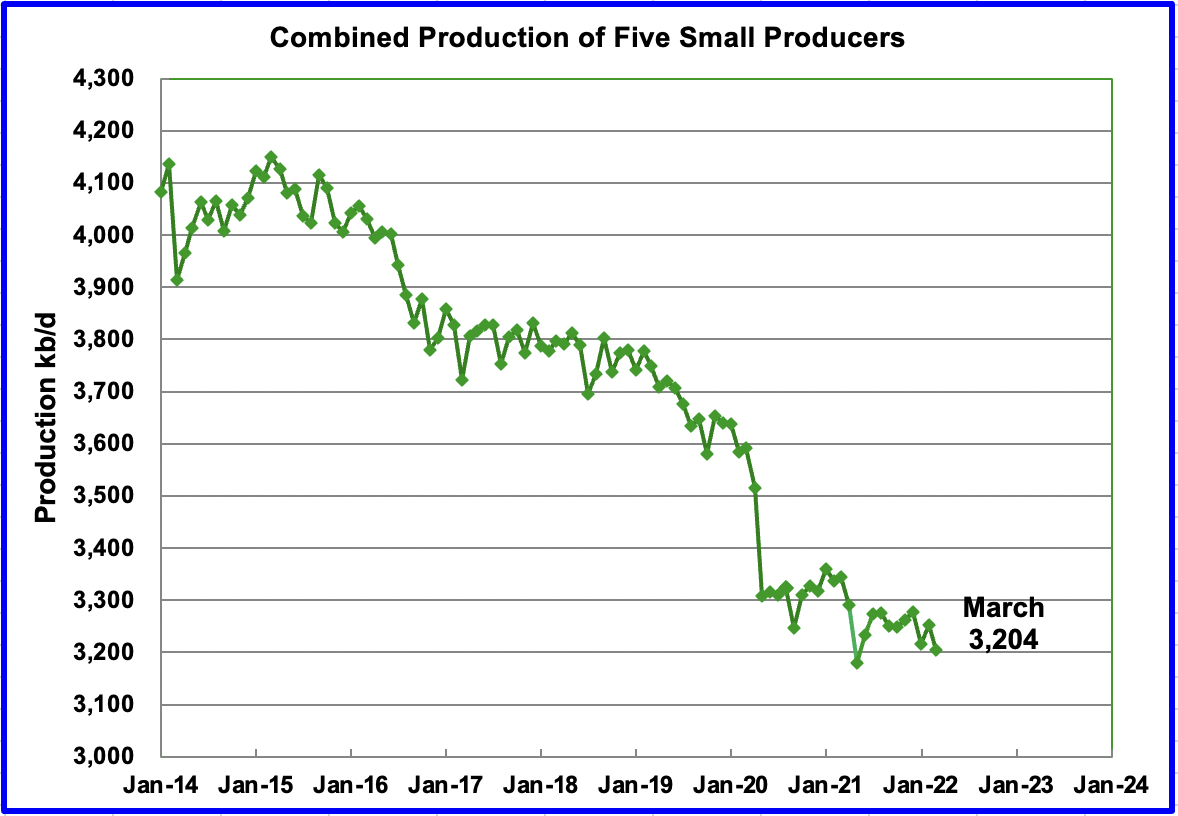
The overall output from the above five countries has been in a slow steady decline since 2015.
OPEC 10 + Production vs Commitment
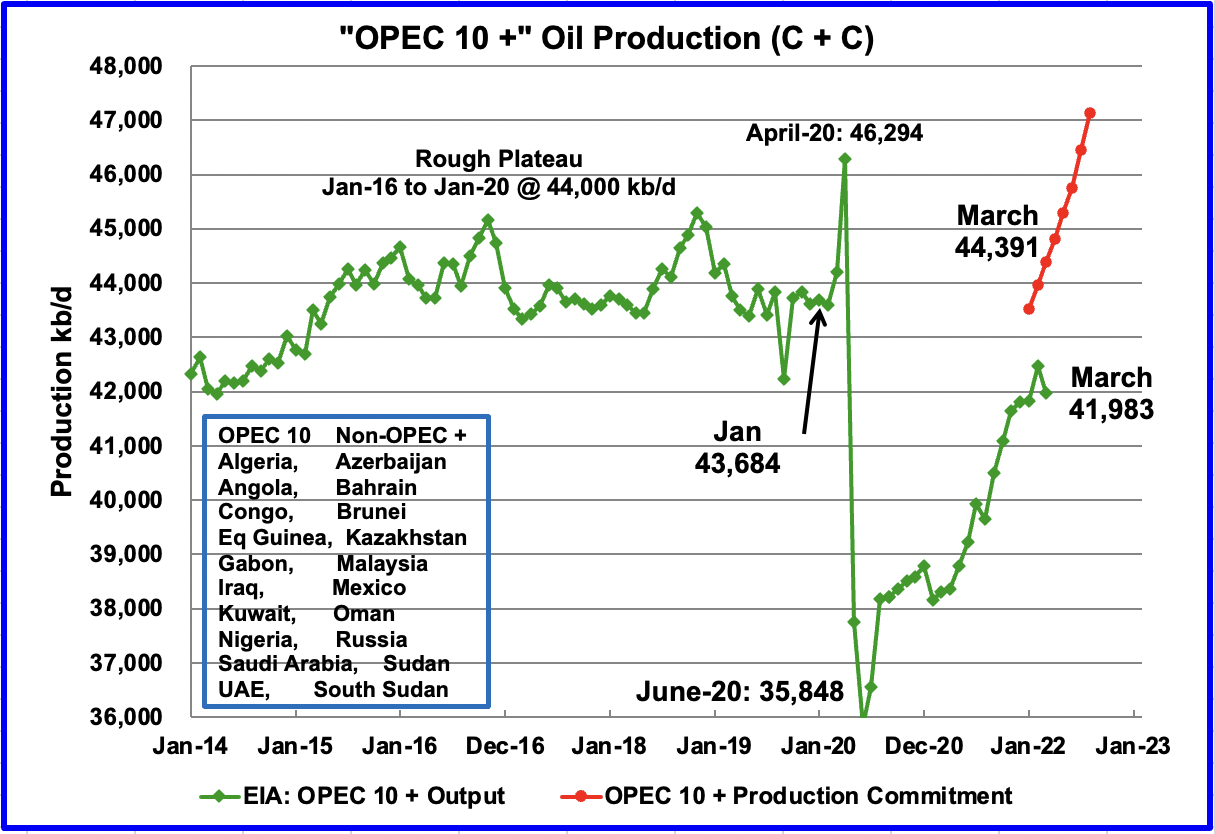
This chart compares OPEC 10 + production with their commitment. For March, the gap between production and commitments is approximately 2,408 kb/d of C + C.
To develop this chart some assumptions had to be made. The OPEC 10 + commitments are for only crude oil production, no condensate. While that information is available for the OPEC countries from the OPEC report, it is not readily available for the Non-OPEC participants. On the other hand, the EIA monthly production information is available for those countries for both crude plus condensate. To get an estimate for the OPEC 10 + commitments in terms of C + C, OPEC crude production was compared with EIA’s C + C production for the OPEC countries.
For the last six months, October 2021 to March 2022, the ratio of EIA C + C OPEC production data to the OPEC crude data was calculated. Over that period, the EIA C+C production was close to 7.5% higher on average than the OPEC crude values. The OPEC 10 + commitments have been increased by 7.5%.
World Oil Production
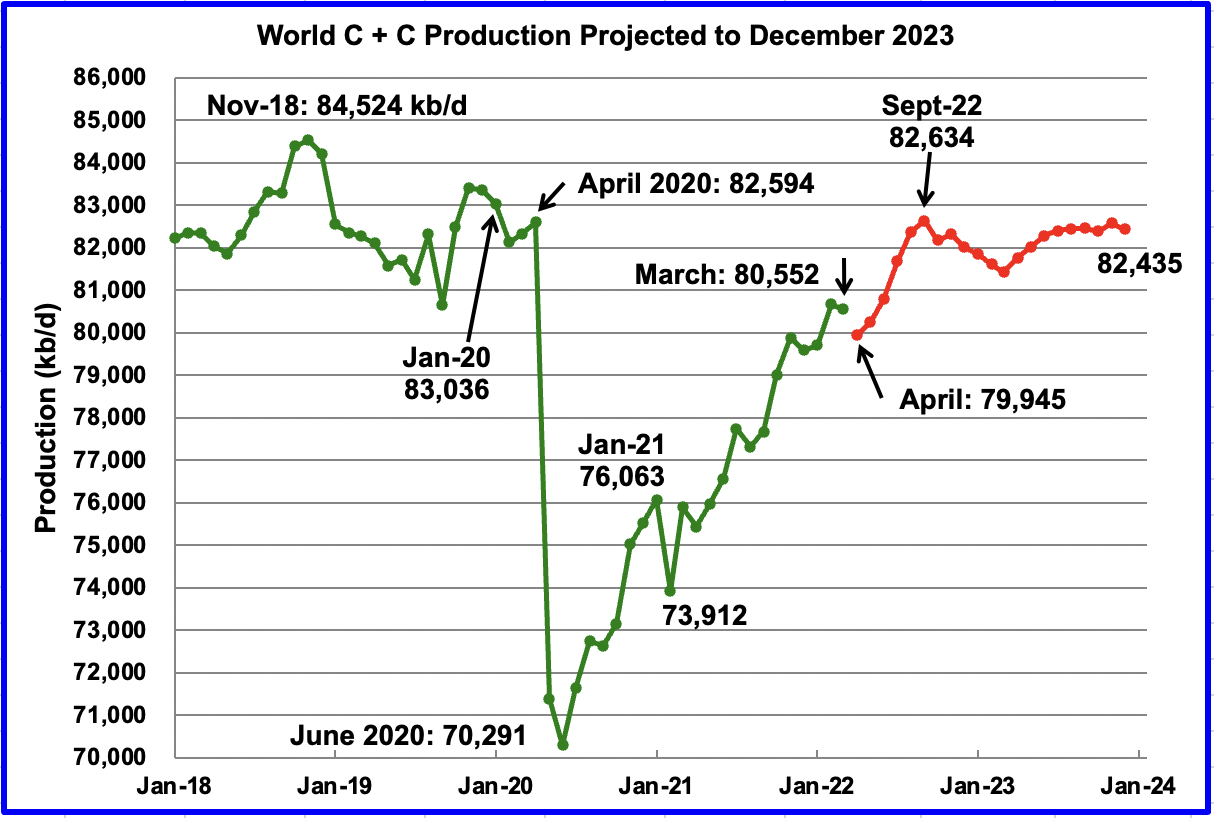
March’s world oil production decreased by 122 kb/d to 80,552 kb/d according to the EIA (Green graph).
This chart also projects world C + C production out to December 2023. It uses the July 2022 STEO report along with the International Energy Statistics to make the projection. (Red markers).
It projects that world crude production in December 2023 will be 82,435 kb/d, 164 kb/d higher than projected in the June report. The rise of close to 2,700 kb/d from April to September seems aggressive but is related to US and OPEC + forecast production increases.
Considering the upcoming production losses shown above in Brazil, Kazakhstan and Norway, the smooth production increase from April to September appears to be optimistic.
Editor’s Note: The summary bullets for this article were chosen by Seeking Alpha editors.
Be the first to comment