

Maria Marganingsih/iStock via Getty Images
Introduction and Article Purpose
Time flies! It’s hard to believe we’re now in April, but I’m happy to be writing the seventh edition of this monthly dividend and income ETF series. For those of you who are new to my work, the purpose of this article is simple: to provide a source of consistent, accurate, and reliable data on all the U.S. dividend and income ETFs available. What separates me as an ETF analyst is that I consider as many options as possible from the over 800+ U.S. Equity ETFs I track in my custom-built database with each fund I analyze. I’m confident I’m giving you the complete picture by calculating dozens of metrics relating to performance, risk, dividends, valuation, growth, and concentration for every ETF in my database. Here’s a summary of what you can expect each month, and I hope you’ll keep coming back to see the changes, as it’s an article series I’m keen on improving to meet your needs.
Author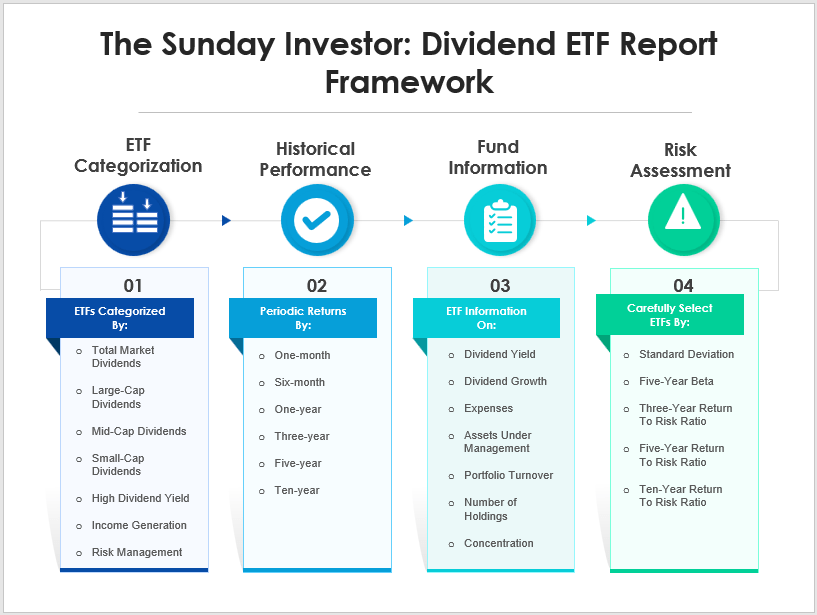
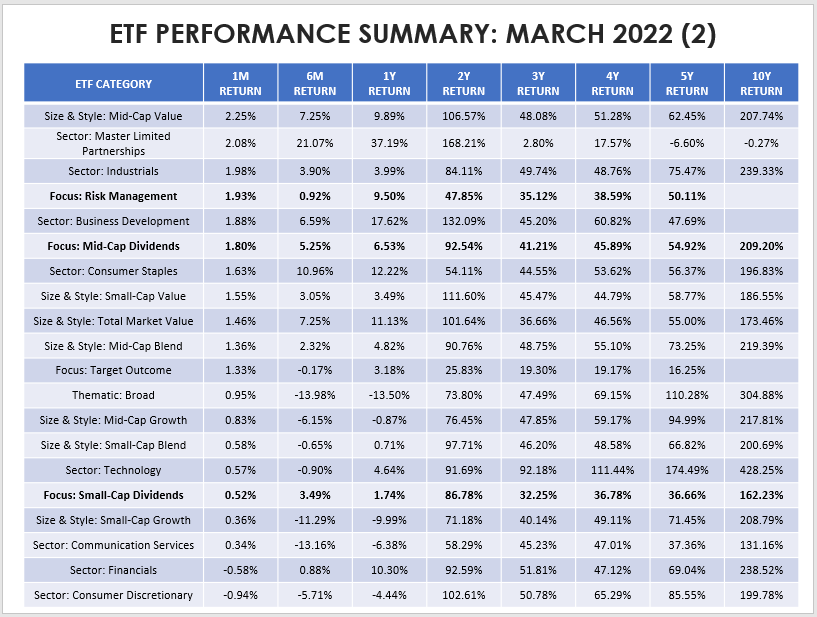
I want to summarize how each category of ETFs performed last month and up to ten years. These tables reflect median returns from my database of 848 ETFs, sorted from best to worst in March.
The Sunday Investor The Sunday Investor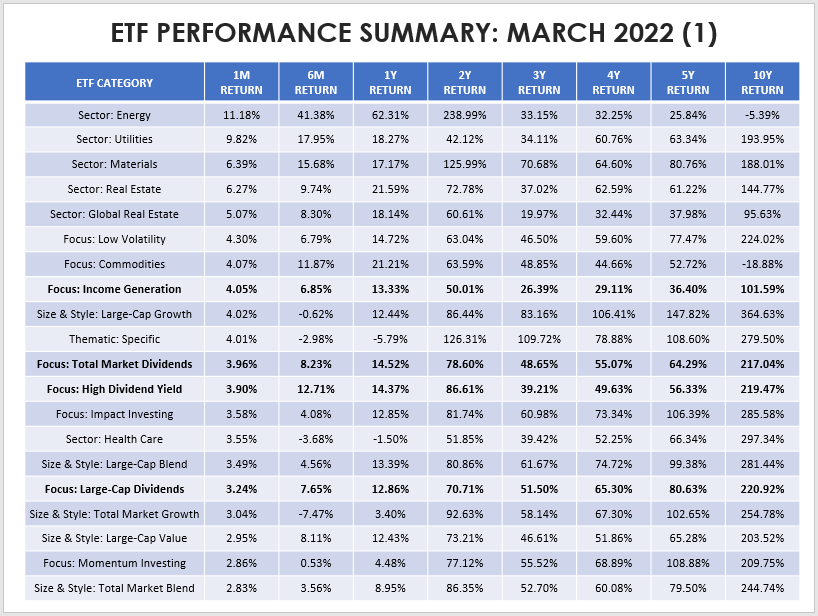
With this information, we can make the following observations:
1. Commodity-driven stocks in the Energy and Materials sector continue to perform well. Utilities also did well in March, with a median return of 9.82%. The Utilities Select Sector SPDR ETF (XLU) gained 10.34%, and you can read why I like the sector despite rising ten-year yields in this recent bullish piece.
2. High-dividend ETFs were up 3.90%, despite most having relatively low betas in the 0.85 to 0.95 range. Usually, this suggests underperformance in bullish months, but remember that many of these ETFs are overweight Energy and Utilities. Looking at six-month median returns, the top five categories were Energy (41.38%), Master Limited Partnerships (21.07%), Utilities (17.95%), Materials (15.68%), and High Dividend Yield ETFs (12.71%).
3. All investors should realize what drives a portfolio’s returns. It’s tempting to attribute success to your superior stock-picking skills or an ETF’s strategy that sounds good on paper. Still, it’s hard to escape the impact sector allocation decisions have on returns. An ETF could have a great strategy for picking underpriced stocks, but if they’re holding stocks in the wrong sectors at the wrong time, they’ll probably underperform.
4. The small-cap space continues to underperform, and I have a theory: low profitability. There are 79 small-cap ETFs in my database with an average Seeking Alpha profitability score of 5.98 out of 10. In contrast, the SPDR S&P 500 ETF (SPY) has a profitability score of 9.27. You can try to time things if you want, but my 30-year analysis of profitable vs. unprofitable stocks shows why it’s easier on the stomach to stick with the large caps.
Author / Ken French Data Library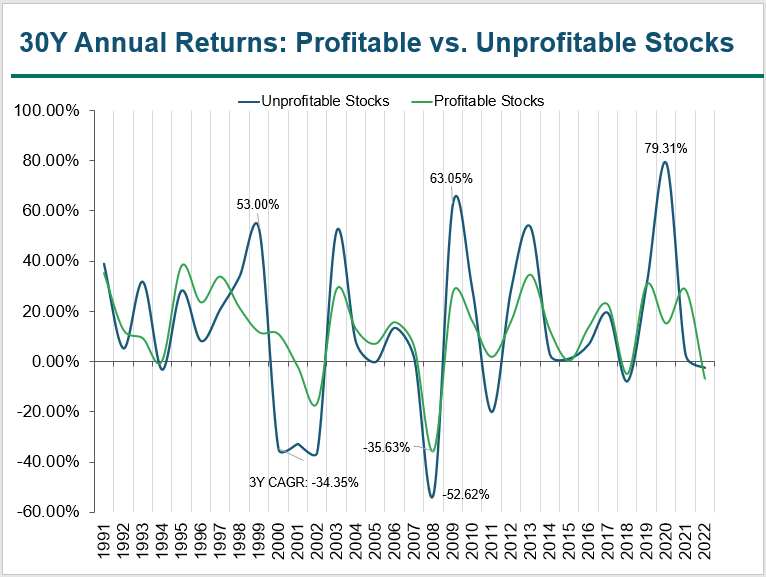
See the huge waves the unprofitable blue line makes relative to the profitable green line? That’s the risk and reward you’ll be more likely to find with small-cap stocks. In 2021, unprofitable stocks gained a value-weighted 79.31%, similar to how they performed in 1999 and 2009. Unfortunately, the trajectory has always been downward in subsequent years, so keep that in mind if you feel like taking some risks right now.
5. Don’t underestimate the power of large-cap growth stocks. They’re the most profitable but have suffered recently due to consistently lower earnings surprises and negative earnings revisions. According to Yardeni Research, S&P 500 EPS surprises were 23.4%, 16.9%, 10.8%, and 5.8% from Q1-Q4 2021. While the trend is undoubtedly negative, potential exists for a turnaround, putting value and dividend ETFs at a disadvantage for the next three months.
6. The 10Y2Y spread sits at 0.01%. An inverted yield curve often leads to a recession, so I think history warrants a cautious approach. The Fed will attempt to execute a “soft landing” by raising interest rates just enough (and at the right pace) to avoid a recession, but it’s a challenging task. The last real success was in 1994-95, but they arguably would have achieved it in 2020 had it not been for the pandemic.
That’s my general take of current market conditions, so with that said, let’s move on to how individual dividend and income ETFs performed last month.
Total Market And Large-Cap Dividend ETFs
There are 31 ETFs in these two categories, and I think it’s an excellent place to start if you’re looking to build out a dividend ETF portfolio. Fees are generally lower, and the size factor goes hand in hand with higher profitability. However, the downside is an uninspiring 2.08% average dividend yield, just 0.79% more than SPY. This first table highlights the top 11 performers last month, including the Invesco Dow Jones Industrial Average Dividend ETF (DJD), which gained 4.03%. I considered it a bargain on February 10. DJD was one of my five bullish picks in February primarily due to its low volatility, low P/E, and solid revenue and earnings growth rates.
The Sunday Investor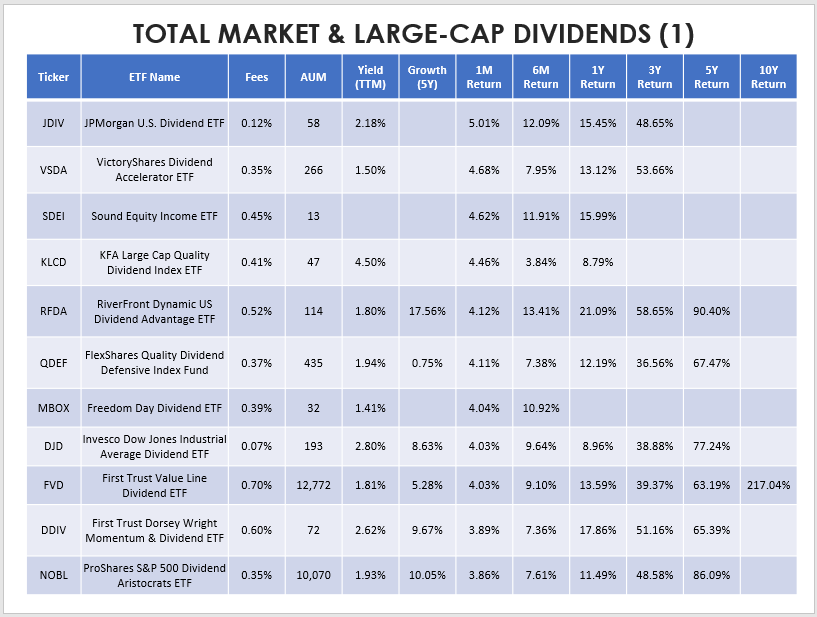
Many of these ETFs have high fees, but that doesn’t equate to high quality. You can see that only the First Trust Value Line Dividend ETF (FVD) has a ten-year history, but even its 217.04% total return since April 2012 isn’t as strong as some of its lower-fee peers found in the following table.
The Sunday Investor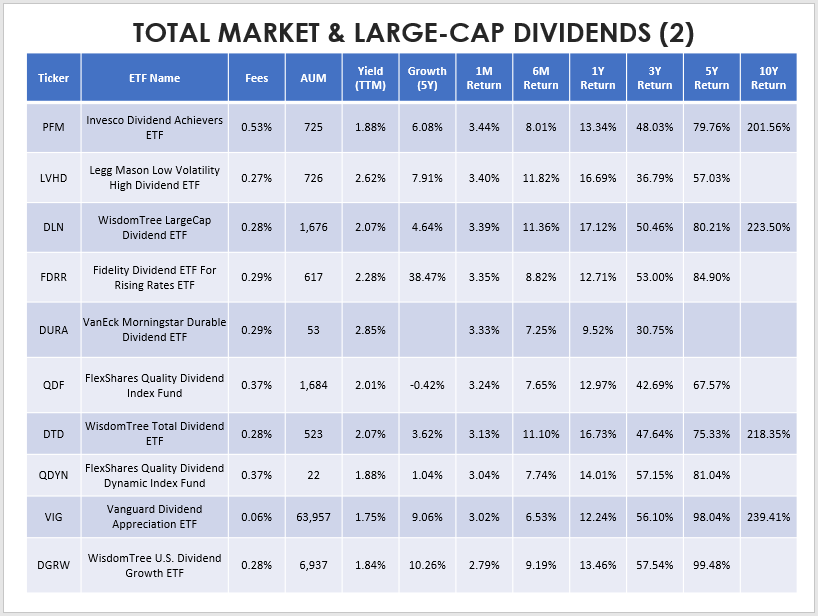
For example, the WisdomTree LargeCap Dividend ETF (DLN) has an expense ratio of 0.28% but has gained 223.50% over the last ten years. The WisdomTree Total Dividend ETF (DTD) is a similar fund but includes a small percentage of small- and mid-cap stocks. Its returns were slightly lower at 218.35%, and all of that difference has come in the last five years as the most profitable large-cap stocks performed best. The Vanguard Dividend Appreciation ETF (VIG) is the most popular choice per its $65 billion in assets under management, but as I wrote in November, it’s lost its appeal. In my view, dividend ETFs should offer “something” extra to make up for the lack of growth in the portfolio. That could mean lower risk, higher yield, or higher dividend growth. As shown above, VIG has underperformed other large-cap dividend ETFs in the last six months and lost more than SPY in Q1.
The final table shows the ten worst-performing large-cap dividend ETFs last month. I reviewed a number of these recently, including the iShares Core Dividend Growth ETF (DGRO). I projected market-like returns, and that ended up being what happened. The reason is that these ETFs are very broad-based. You can tinker with the allocations, but if an ETF has 400 holdings, you can’t expect huge differences versus SPY each month.
The Sunday Investor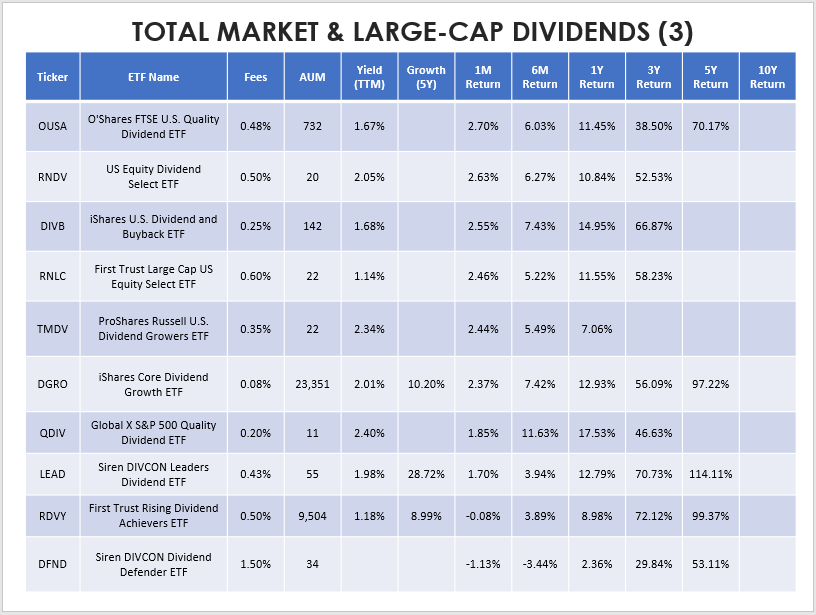
Another example of an ETF closely tracking the market is the WisdomTree U.S. Dividend Growth ETF (DGRW). I noticed my review is the only neutral one in a sea of bullish ratings on the ETF. While I’m not optimistic about its overallocation to Tobacco and Pharmaceutical stocks, they provide stability, so it makes sense why it’s a popular choice.
One thing DGRW and DGRO share is a double-digit dividend growth rate. Dividend growth is reliable with these well-established funds. The reason is that these ETFs have issued so many shares that it’s unlikely dividend payments will be diluted going forward. In contrast, smaller ETFs have this problem. An ETF with only one million outstanding shares could quickly create a few extra hundred thousand units for interested owners anticipating an attractive dividend. If this occurs after the fund has received distributions from the underlying holdings, but before it makes its own distributions, existing shareholders’ dividends get diluted. The difference shows up in the fund’s NAV, but it’s challenging to build a loyal following if your distributions bounce around.
One final ETF I want to highlight is the First Trust Rising Dividend Achievers ETF (RDVY). I’ve favored this ETF in the past but, unfortunately, had to downgrade it in late February. The timing was good since RDVY was the second-worst-performer in its category in March, and perhaps I was lucky, too. However, my reasoning was its high concentration and volatility relating to just two sectors: Technology and Financials. I opt for the more diversified approach in uncertain times, all else being equal. RDVY may have some of the best returns in the last five years, but it’s a lesson why investors shouldn’t cling to past performance. Markets change all the time, and so do an ETF’s constituents. I think it’s more likely we’re moving to a period where value outperforms growth. If I’m right, you might as well throw the five-year charts out the window and focus on what the ETF’s holding today.
Small And Mid-Cap Dividend ETFs
There are far fewer small- and mid-cap dividend ETFs available for purchase than large caps. I found 12, and only two have a ten-year history: the WisdomTree MidCap Dividend ETF (DON) and the WisdomTree SmallCap Dividend ETF (DES). Both are cuts from WisdomTree’s Total Dividend stock universe, and as expected, they’ve underperformed the large-cap version.
The Sunday Investor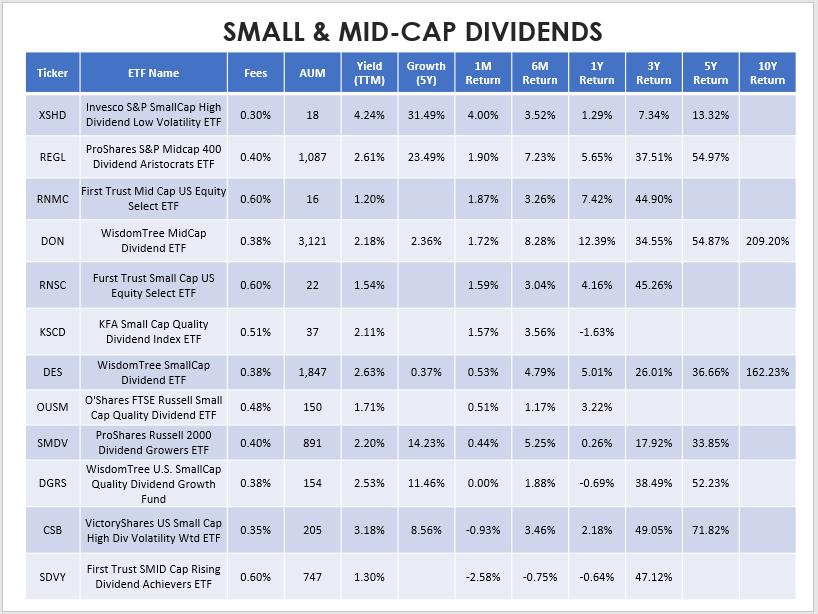
In March, the best performer was the Invesco S&P SmallCap High Dividend Low Volatility ETF (XSHD). Recall from the initial category summary that low-volatility ETFs performed sixth-best last month, so this result isn’t surprising. XSHD is also a leader on fees, though that’s not saying much. Small- and mid-cap stock analysis is a bit of a specialty, but there’s little evidence suggesting it’s worth the fees. As a dividend investor, you know the power of compounding, but I want to remind you that this compounding also extends to fees. I put together this matrix showing what percentage of your total gains are lost over various periods assuming an 8% annual return.
The Sunday Investor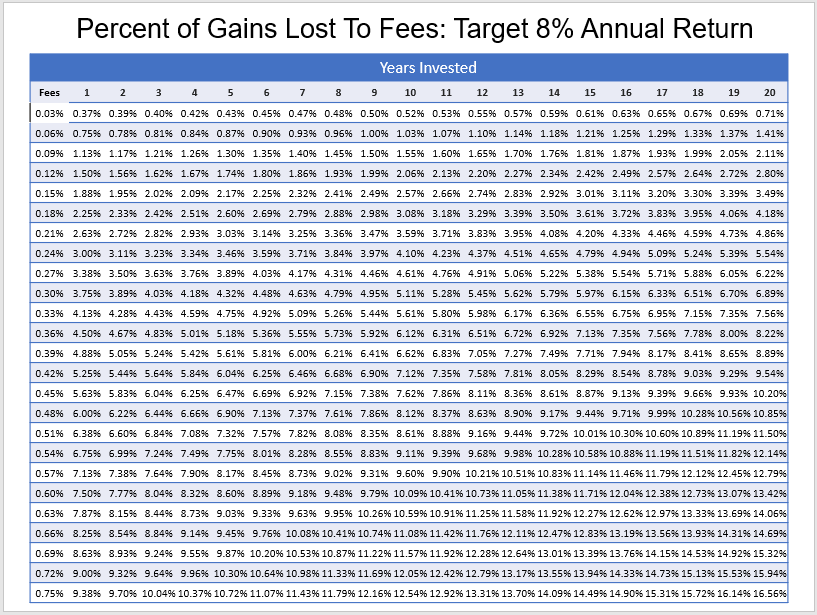
Remember that fees are charged on the amount invested, not on total returns. Long-term holders need to demand more out of high-fee funds, which is why it’s so essential to understand precisely how the product works before taking a position. Again, it’s not as simple as looking at a five-year chart and picking the top performer.
High Yield Dividend ETFs
Depending on your income needs, you may be in the market for a high-quality dividend ETF. I have 21 in my database, and for reasons already discussed, my general advice is to stick with well-established ETFs (long history, high AUM) with low fees. Another advantage of low-fee ETFs is that distributions will be higher since expenses are subtracted directly from distributions. Add in the compounding factor of both costs and dividends, and the difference could be substantial over time.
This first table highlights the top performers in this category last month. The Invesco S&P 500 High Dividend Low Volatility ETF (SPHD) is included, which surprised me. It was an ETF I cautioned readers against last month in this piece and put it on last month’s list of dividend ETFs to be careful with. While its 5.20% return was good enough for fifth place among all dividend ETFs (not just this category), I’m still concerned with the low growth rate of its constituents. If large-cap growth stocks can turn things around this earnings season, SPHD won’t participate much in the gains.
The Sunday Investor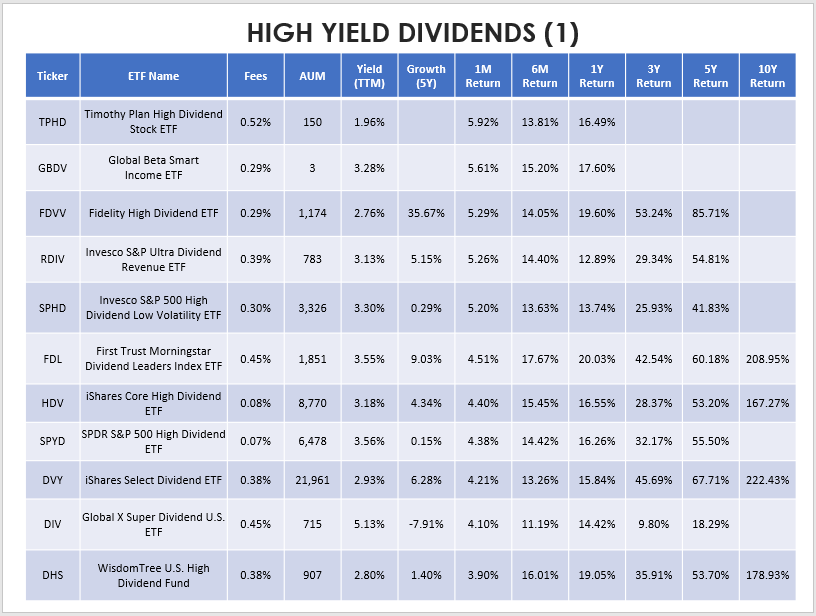
In contrast, the iShares Core High Dividend ETF (HDV), the First Trust Morningstar Dividend Leaders Index ETF (FDL), and the iShares Select Dividend ETF (DVY) all remain solid picks in this environment because of their growth potential. Their forward EPS growth rates are 11.17%, 9.73%, and 11.06%, compared to 6.02% for SPHD. Ironically, SPHD’s forward P/E is the highest among the four. Time will tell whether these factors matter, but I think it’s prudent to try to play both sides.
All high yield dividend ETFs did well last month, so I’m hesitant to designate the next ten as “poor-performers.” Still, the Schwab U.S. Dividend Equity ETF (SCHD) is on the list. In my view, SCHD is the best dividend ETF available for long-term investors. It offers the rare combination of high yield (relatively speaking) and high dividend growth for a low 0.06% fee. It has an outstanding ten-year track record, and its screening criteria make sense. I planned on providing an update on its annual reconstitution last month, but it’s already been covered. For those looking for my take, leave a comment to start a discussion, and if there’s enough interest, I’m happy to provide an update of my own.
The Sunday Investor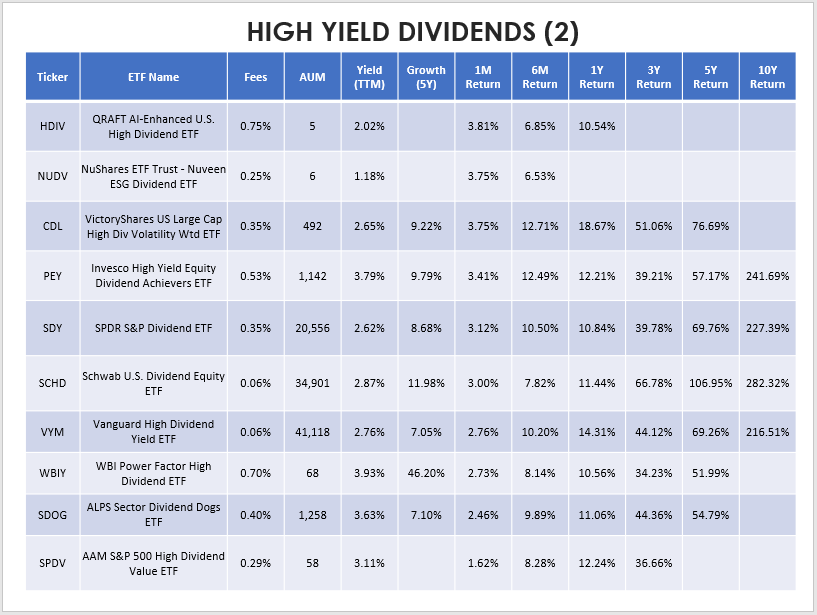
Income Generation And Risk Management
Recently, many new income and risk-management-related ETFs have been launched, and most use either options or treasuries to meet their objectives. The income generation category was the eighth-best-performing in March. Nasdaq-100-linked ETFs like the Global X Nasdaq 100 Covered Call ETF (QYLD) and the Global X Nasdaq 100 Covered Call & Growth ETF (QYLG) each gained over 5% compared to 4.67% for the Invesco QQQ ETF (QQQ). XYLG and XYLD, Global X’s S&P 500 covered call ETFs, also beat SPY. Normally, covered call ETFs underperform in positive months, so this was a nice bonus for income investors.
The Sunday Investor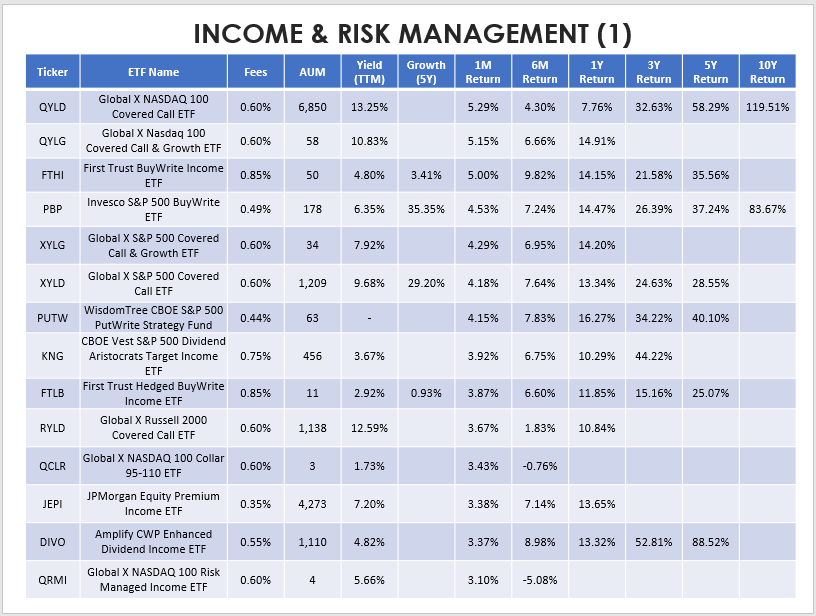
Investors should always consider the quality of the underlying holdings when deciding on which ETF to purchase. Forget about the yield; would you buy the Index that the ETF writes options on? If not, then I don’t think it’s a wise investment. I’d much rather own an ETF with a mediocre strategy writing call options on a high-quality Index than an ETF with an excellent strategy writing call options on a poor quality Index. It’s why I was hesitant about the Global X Russell 2000 Covered Call ETF (RYLD) in November. It may have a 12.59% yield, but that’s due to the volatile nature of small-cap stocks. RYLD underperformed and XYLD by 4.63% since that article was published, so again, we see the value of sticking with the higher-quality Index.
The Sunday Investor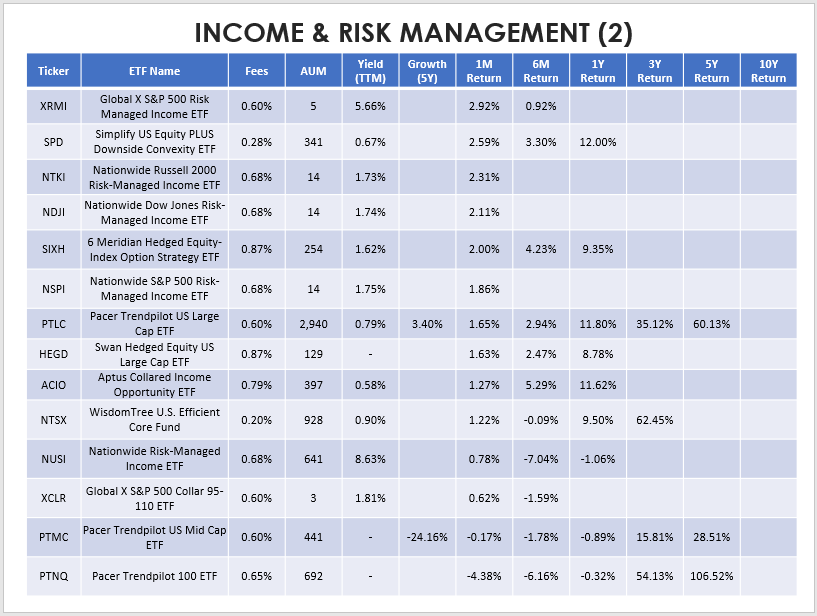
Risk Analysis
There are many ways to measure risk. You may be familiar with a portfolio’s beta, which is a measure of volatility compared to the market as a whole. Standard deviation measures the amount of variation in a set of values (e.g., monthly returns). The Sharpe and Sortino Ratios use standard deviation to measure risk-adjusted and downside-risk-adjusted returns – the higher, the better, since investors are receiving more returns per unit of risk.
I’ve calculated return-to-risk ratios for all ETFs mentioned in this article to keep things simple. This ratio is the same as the Sharpe Ratio, just excludes the risk-free rate. I’ve also included each ETF’s yield, beta, the number of holdings, the percentage of assets in the top ten, and the portfolio turnover rate, if available.
The Sunday Investor The Sunday Investor The Sunday Investor The Sunday Investor The Sunday Investor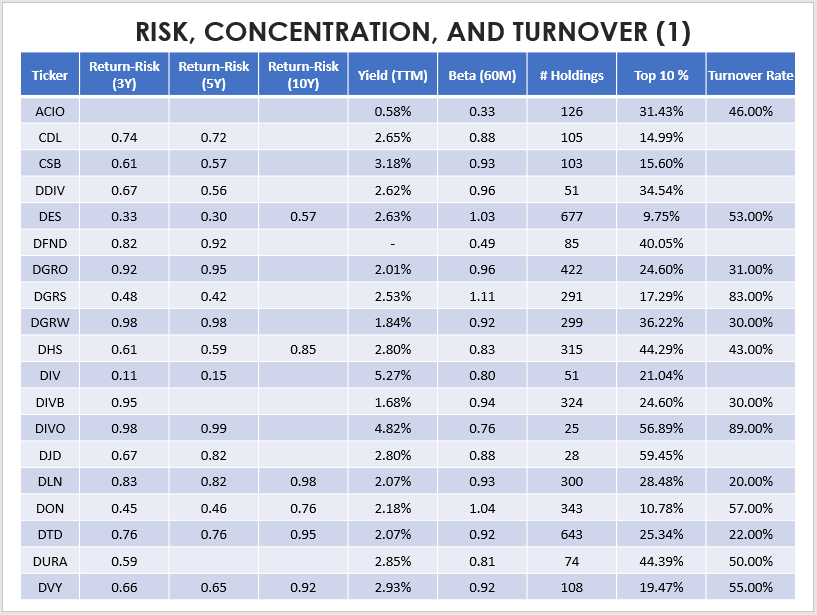
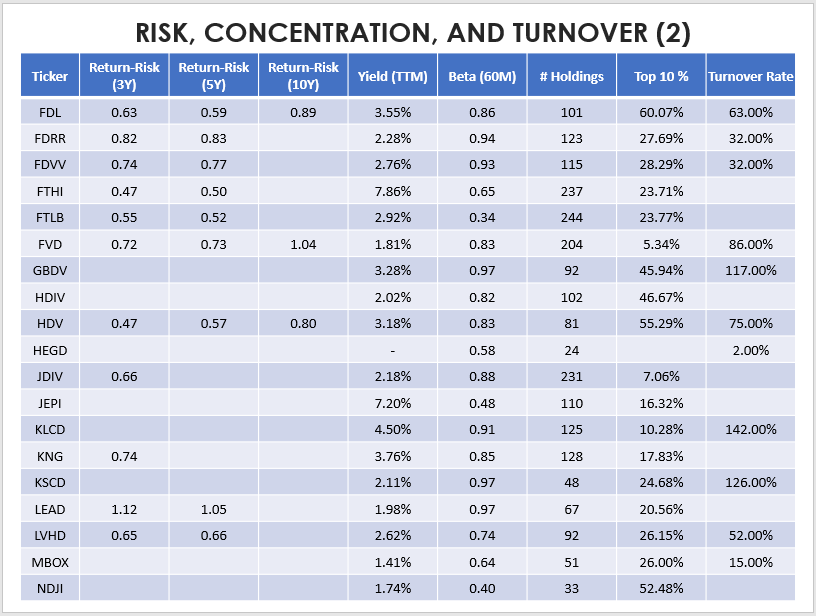
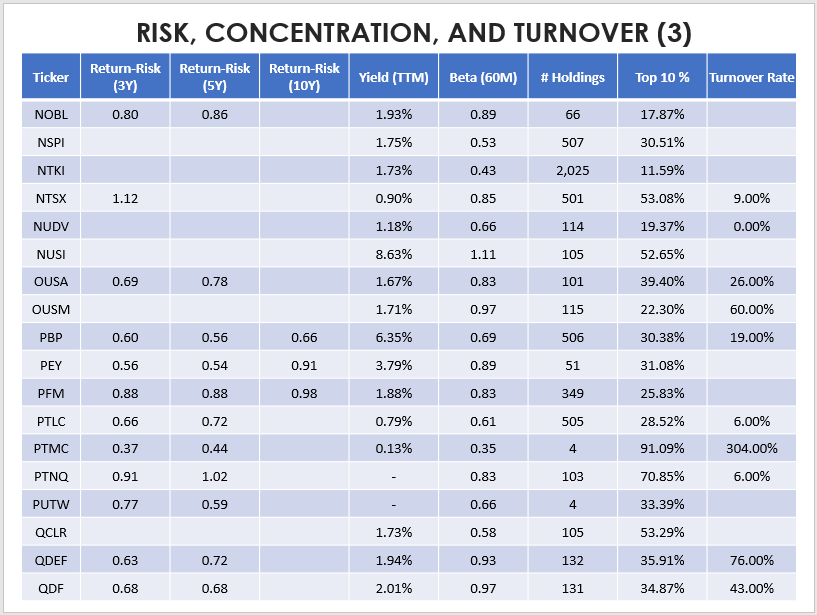
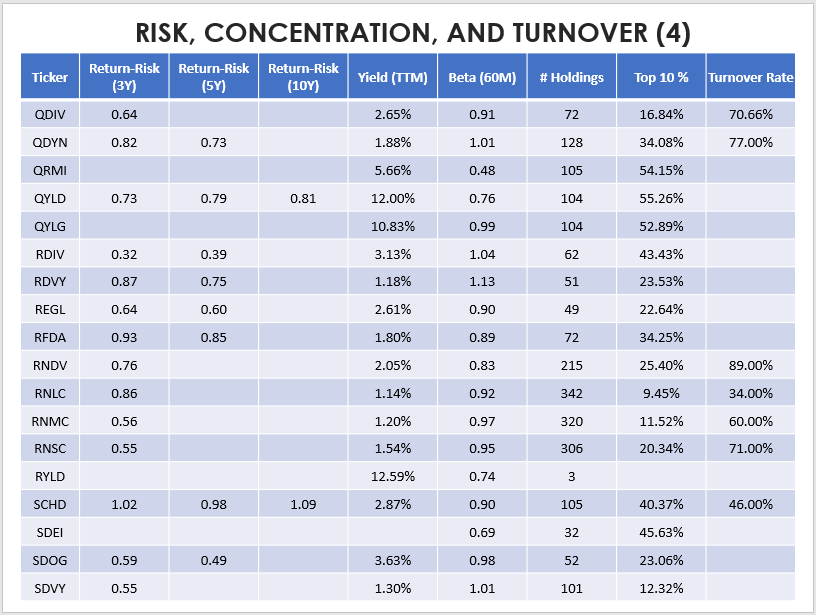
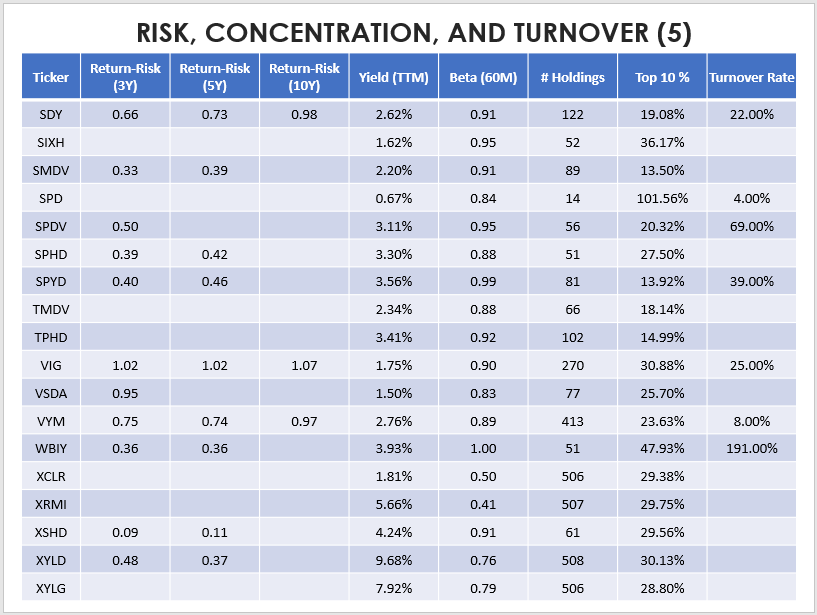
A few takeaways:
1. Only 17 ETFs have at least a ten-year history. That means most dividend and income ETFs launched in a mostly growth-favored period. You can’t expect them to compete with the S&P 500 or the Nasdaq-100 unless they have an outstanding strategy or take on excess risk. The three ETFs with a ten-year return-to-risk ratio above one are:
- The Schwab U.S. Dividend Equity ETF (SCHD): 1.09
- The Vanguard Dividend Appreciation ETF (VIG): 1.07
- The First Trust Value Line Dividend ETF (FVD): 1.04
Still, all three ETFs underperformed SPY in the last ten years. In SCHD’s case, the fact it was able to keep up despite a clear value lean is impressive, and I think it bodes well for its future. The takeaway here is that if you’re looking to buy a dividend ETF, avoid comparing it with SPY. Try to make apples-to-apples comparisons, and you can use the information in this article as guidance.
2. The number of holdings and percentage of assets in the top ten provides insights into how concentrated or specialized an ETF is. Generally, the higher the number of holdings and the lower the top ten percent, the more diversified and market-like the ETF. Passive investors usually prefer this, but investors willing to trade often may want to switch in and out of more specialized ETFs as market conditions change.
3. An ETF’s portfolio turnover rate is also a key feature for passive investors to consider. Remember that ETFs are baskets of securities. They change according to a set schedule (passive rules-based ETFs) or at the manager’s discretion (active ETFs). An ETF’s performance history reveals the strategy’s success for a particular period and not necessarily how the current portfolio would have performed during that same period. If an ETF has a high turnover rate, that means today’s portfolio is much different than it was previously. If you cannot do periodic reviews, my advice is to stick with low-turnover ETFs instead. With those, you can buy the basket of stocks today and be reasonably certain things won’t change much in five or ten years.
Dividend ETF Watchlist
Last month, I highlighted five ETFs that I thought would outperform in March and five others whose fundamentals were lacking. The five bullish picks earned an average return of 4.21%, as follows:
- HDV: 4.40%
- DHS: 3.90%
- DJD: 4.03%
- FDL: 4.51%
- DVY: 4.21%
The five bearish picks earned an average return of 2.90%, as follows:
- SMDV: 0.44%
- REGL: 1.90%
- NOBL: 3.86%
- SDY: 3.12%
- SPHD: 5.20%
For this month, I think the opportunities for outperformance are dwindling. I still think it’s worth holding ETFs like FDL, DVY, and HDV, but my main message is to focus on large-cap dividend ETFs and avoid the small- and mid-cap categories. The earnings season risk is real, as growth stocks could turn things around again. I’ve created the following table highlighting selected fundamental metrics for the ten largest dividend ETFs by assets under management to prepare for this.
The Sunday Investor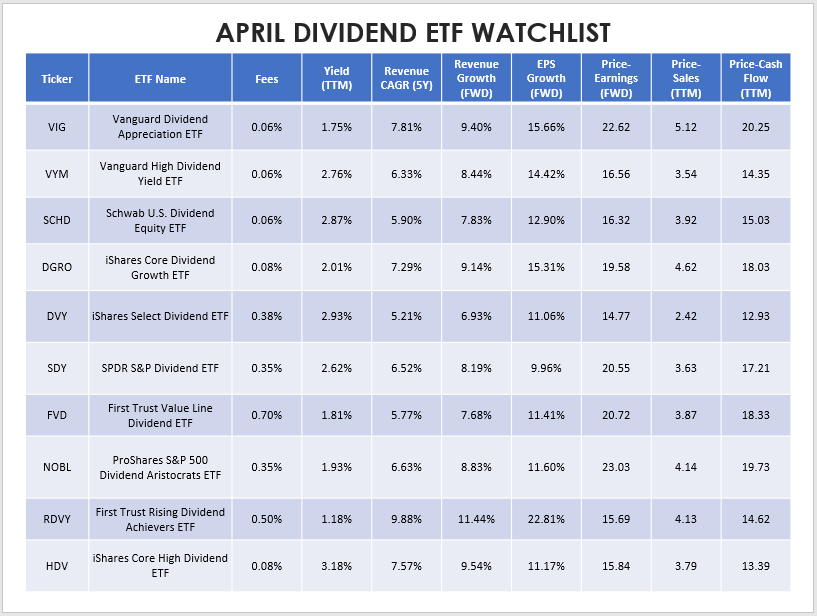
I favor value now, but I always like to have a backup plan and insist on a high revenue and EPS growth rate. VIG has that, but its 22.62 forward P/E is too expensive. RDVY would be a hedge against growth stocks outperforming since it holds many technology stocks, but as mentioned previously, I don’t think overconcentration is the way to go right now. Instead, the Vanguard High Dividend Yield ETF (VYM) is a nice compromise, and its fees are low as a bonus. SCHD looks a bit worse but isn’t bad. In contrast, the ProShares S&P 500 Dividend Aristocrats ETF (NOBL) has a bad combination of growth and value. I’ve often said it, but you sacrifice a lot when you require 25 years of consecutive dividend payments.
Conclusion
Thanks for taking the time to read through this lengthy article, and as you become more familiar with the format, hopefully the tables will be sufficient. Until next month, I hope you’ll continue to follow my work, and if you have any suggestions on how I can improve, I hope you’ll take the time to comment below.
Be the first to comment