

Oksana Zueva/iStock via Getty Images
As a quant analyst and trader, I reject any cause and effect between astrological patterns and stock market moves. My very first website article in October 2010 was about disproving claims that lunar cycles could provide signals that outperform buy and hold. Then, after 10 years, in January 2020, I wrote another article on attempts to predict market tops based on the “Puetz Window” astrological pattern.
Something curious happened that is puzzling to me. Based on Google analytics results, the 2020 article on the Puetz Window has received a high number of clicks, consistently. I looked deeper and I found out that there is high interest in the application of astrology in forecasting market moves, something I was not aware of.
I have attributed any success of astrological patterns in predicting major market moves to spurious correlations and cognitive biases. In my opinion, the reasons many investors turn to astrology are complicated. Astrology has been practiced for nearly two millennia before the industrial revolution and there is probably some element of it in human DNA. Then, some investors have been disappointed by quantitative methods and technical analysis and have turned to metaphysics for clues about market direction. The existence of hundreds of websites that make stock market predictions based on astrology means there is some demand.
Astrology suffers from some of the same problems that plague technical analysis: when it fails, the practitioners claim there was a confounder that messed up the predictions. In other cases, the claim is that the application was incorrect without providing any justification. It is hard to counter such arguments.
In this article, I will concentrate on the Puetz Window and the claim that it predicts market crashes.
This is an excerpt from my January 2020 article:
Steve Puetz has studied market cycles. Among his interesting work is the analysis of cycles triggered by lunar and solar eclipses. The “Puetz window” opens after the first full moon following a solar eclipse when there is also a lunar eclipse.
I then showed the S&P 500 (SPX) 1987 crash chart in that article.
Daily Chart of S&P 500 Showing The 1987 Crash (Price Action Lab Blog – Norgate Data)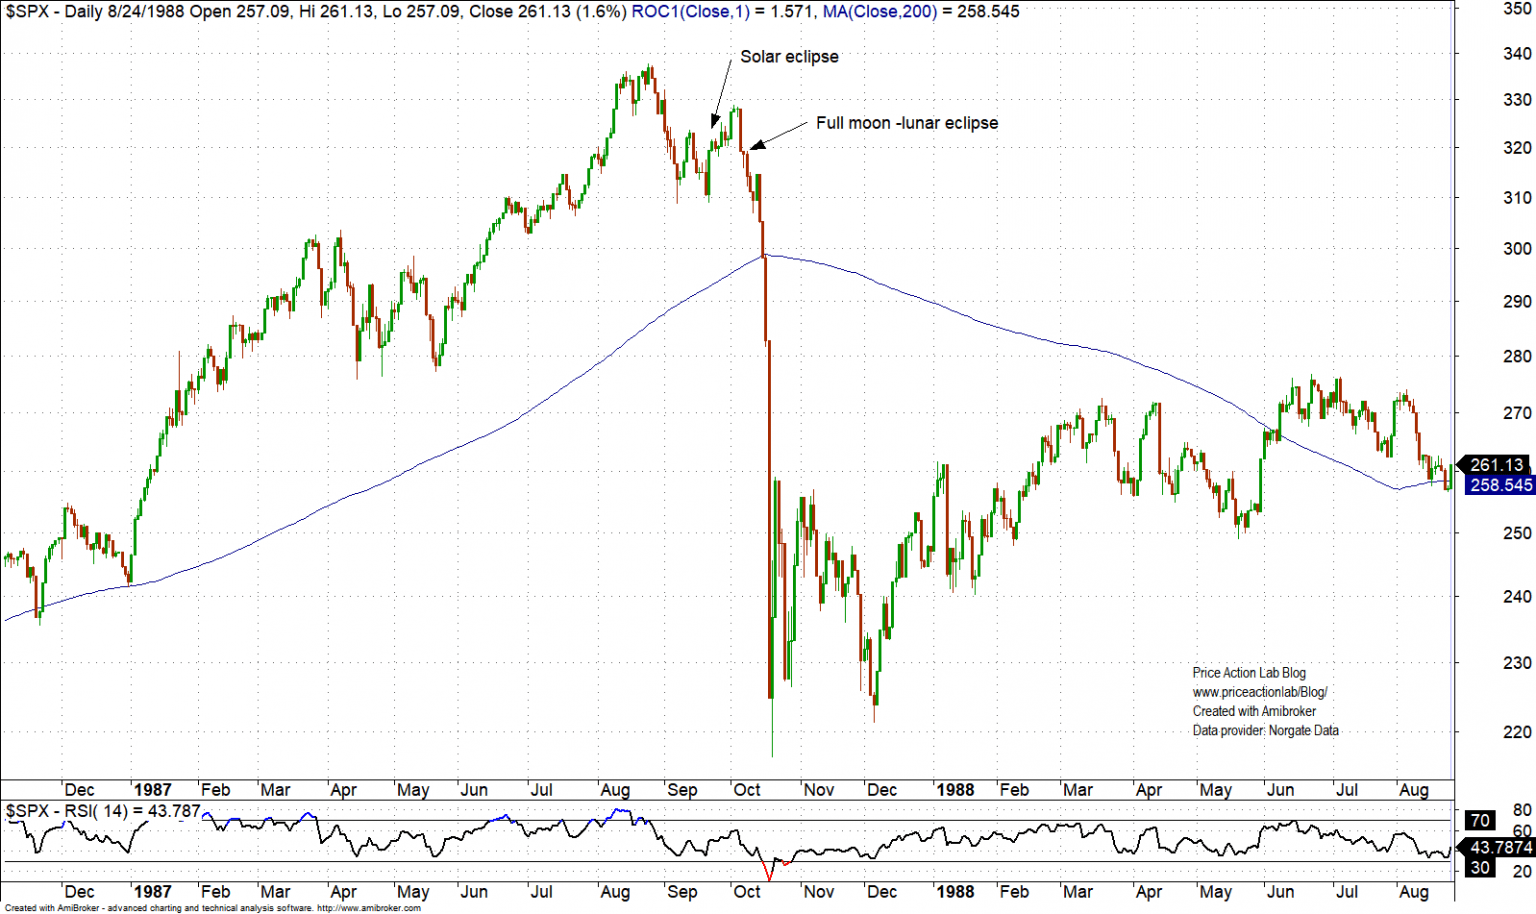
The crash occurred after a full moon and lunar eclipse that followed a solar eclipse, as marked on the chart. In astrology terminology, “a Puetz Window opened” after the full moon and lunar eclipse that followed the solar eclipse.
I tried to find a counter-example when this ominous “Puetz Window” pattern failed. I found one for 2013.
Daily Chart of S&P 500, 2013 – 2014 (Price Action Lab Blog – Norgate Data)
There was no crash in 2013 after a full moon and lunar eclipse following a solar eclipse. My conclusion was that the correlation between a “Puetz Window” and market crashes was spurious and probably based on hindsight bias.
The next chart I showed in my article in 2020 was about a new Puetz Window that opened in January.
S&P 500 Daily Chart Ending January 10, 2020 (Price Action Lab Blog – Norgate Data)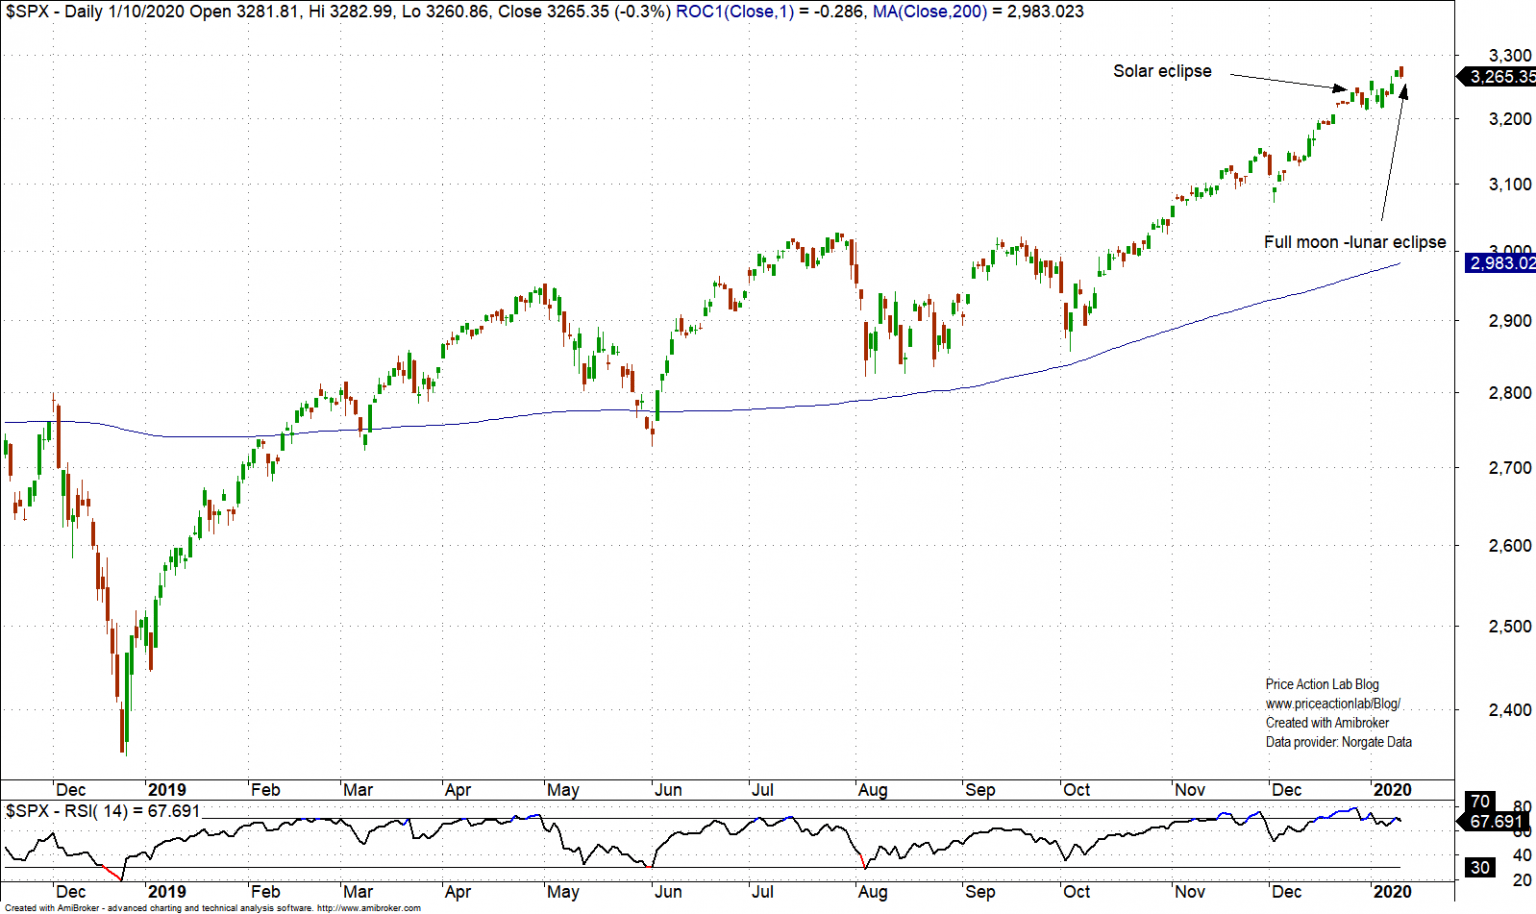
Then I asked a question in that article:
If a crash starts, should we attribute it to an astrological pattern?
A crash started inside the Puetz Window on February 20, 2020, due to the pandemic, and the S&P 500 fell 34% from previous all-time highs.
It took extraordinary money printing for the market to recover from the 2020 crash.
Recently, the “Puetz Window” pattern resurfaced, as shown below.
S&P 500 Daily Chart (Price Action Lab Blog – Norgate Data)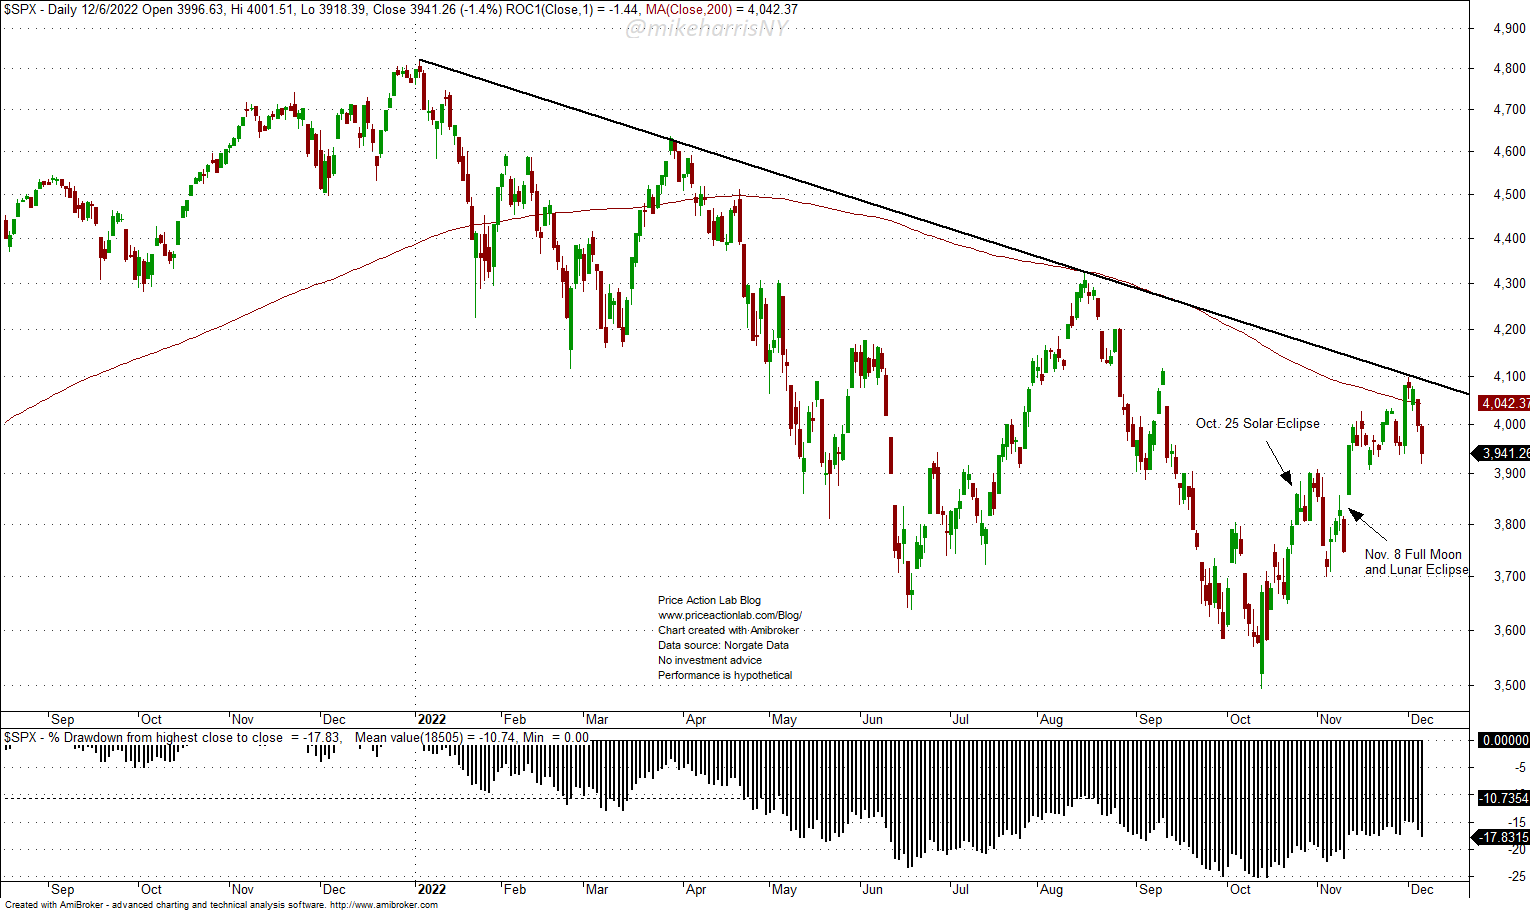
On October 25, there was a solar eclipse, and on November 8, there was a full moon-lunar eclipse. A new Puetz Window has opened, according to the practitioners of astrology. Some expect a market crash to follow in the next few weeks.
Some may claim that the 2013 crash was averted due to QE3, the quantitative easing. This is a valid point, but the correlation with a Puetz Window may be spurious.
Conclusion
The correlation between astrological patterns and market moves is spurious, as is also the correlation between most technical analysis patterns and market price action.
The Puetz Window is considered a significant pattern that predicts a market crash. I have shown an example in 2013 when this astrological pattern failed. However, some may claim quantitative easing played a role in this failure.
A new Puetz Window opened after November 8 of this year. Practitioners of astrology are warning about a pending market crash due to this signal.
As a quant trader, I believe many confounders can cause a market crash, or evert it, and the correlation between market moves and astrological patterns is spurious.
It is interesting, that in 2022, there are still many people who try to predict market direction using astrological patterns. Some of these people may claim that technical analysis is not any better than their practice. I do not disagree with that claim, but that does not confirm the validity of their practice.
Be the first to comment