Dimitrios Kambouris
In an interview last September, Tesla’s CEO, Elon Musk, forecast that half of all cars made will be electric by 2030 and that the percentage will rise to 80% in 2035. In a tweet posted at the time, I argued that the jump to 80% in the next 13 years seems to be connected with the bans of internal combustion engine (ICE) cars in Europe and California and it could imply almost 4TWh battery capacity and 3.1 million metric tons of lithium carbonate equivalent (LCE).
Tweet 1 (Twitter)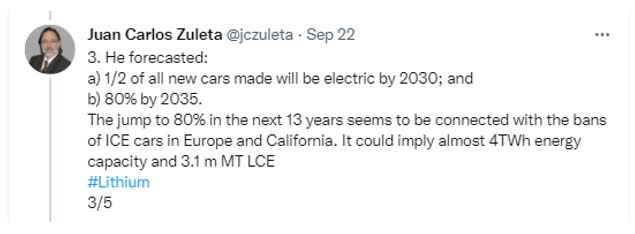
In another tweet published only four days later, I referred to a new International Energy Agency (IEA) projection that raised the 2030 forecast to around 60% which would, in addition, amount to over 300 million electric vehicles (EVs).
“The Net Zero Emissions by 2050 Scenario sees an electric car fleet of over 300M in 2030 and electric cars accounting for 60% of new car sales.” (Yoel Minkoff, Seeking Alpha, News Editor)
Tweet 2 (Twitter)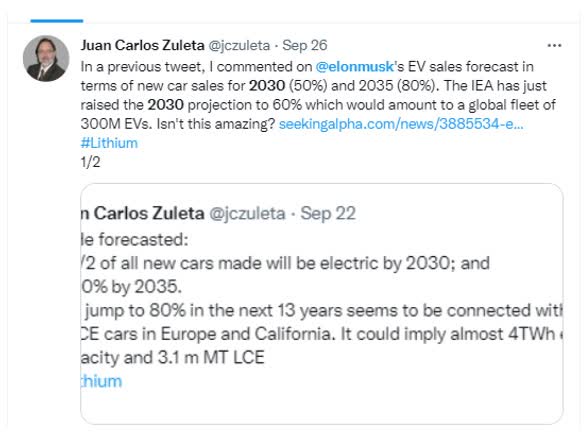
True, Elon Musk talked about vehicle production while the IEA referred to vehicle sales. But these two series at least for the period 2016-2021 were found to be almost perfectly correlated (0.99).
In Table 1, I show how many EVs would have to be sold in 2030 to attain that percentage and how the global EV fleet would grow over the following 8 years to reach that number. I proceeded as follows. Firstly, with data for the period 2015-2022, I estimated global EV sales for the period 2023-2030, using the equation exhibited in Figure 1. Note that the number for 2022 is a projected figure from EV-Volumes.com. Secondly, global vehicle sales for the period 2022-2030 were estimated using an average between the percent change of 2016-2017, and that of 2020-2021. The rationale for this is that these are the only two positive percent variations (one pre-pandemic and another post-pandemic) found in the data for 2016-2021 obtained from the International Organization of Motor Vehicle Manufacturers (OICA). See Table 2 for the results of this estimation. And thirdly, 62.6 million EVs were divided by 113.3 million vehicles (including light passenger and commercial cars) and multiplied by 100, which resulted in 56%, close enough to “around 60%”, as suggested by the IEA.
Table 1
Global EV Fleet Projection
EV-Volumes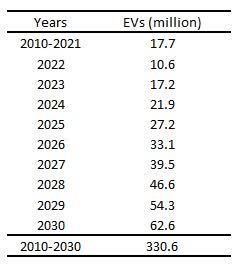
Source: EV-volumes.
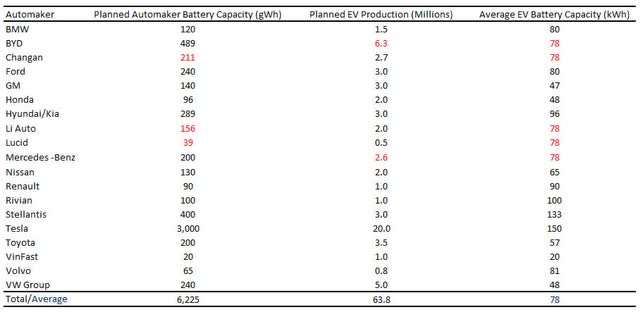
Next, we examine the plausibility of Musk’s percentage (50%) and the IEA percentage (60%) in light of a recent analysis by Reuters of 18 automakers for which data on planned battery capacity and EV production is available.
Figure 1
EV-Volumes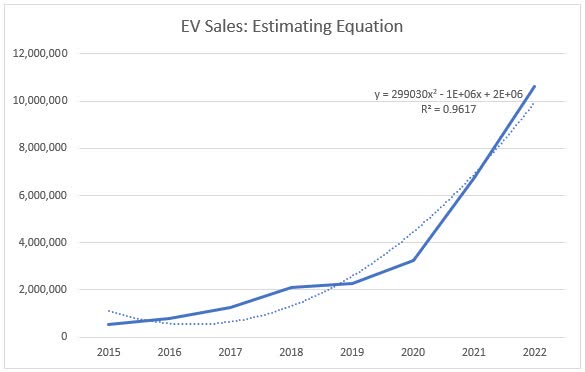
Source: EV-Volumes.
As can be seen in Table 3, in 2030, the total planned automaker battery capacity would amount to 6.2TWh, the total planned EV production being almost 64 million, and the average EV battery capacity reaching 83 kWh. Hence the new percentage of EVs in global vehicle sales would now be 57%, further validating the IEA figure.
Table 2
Global Vehicle Sales
(million EVs)
OICA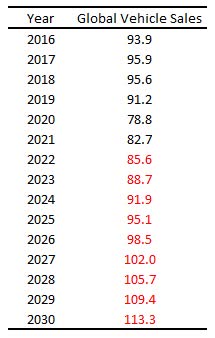
Source: OICA. The numbers in red were estimated based on the procedure described in the text.
Table 3
World: Planned Battery Capacity, Planned EV Production, and Average EV Battery Capacity by 2030
Source: Reuters. Numbers in red were estimated using the average EV battery capacity (83 kWh) calculated for only 13 automakers for which data (in black) are available. VinFast figures on planned automaker battery capacity and EV production were deliberately excluded due to an inconsistency of the data with the resulting average EV battery capacity.
The following conclusions are in order.
First, the fact that the EV penetration rate would rise to 57% would lead us to conclude that the EV revolution could end up being a bit faster than what Elon Musk previously thought and more in line with the IEA forecast for 2030.
Second, installation of a 6.2TWh battery capacity would require almost 5,000 tons of LCE. This constitutes 55% more battery capacity and 61% more LCE requirement than what I anticipated for 2035 in my September 22 tweet. It is also at least 3 times the most fairly recent battery capacity forecasts and about 10 times the demand for LCE in 2021.
Third, an average EV battery capacity of 83 kWh suggests that 8 years from now many automakers will prioritize range and likely favor SUVs and light trucks over other types of EVs. It would also hint at the fact that an affordable EV would still be years away.
Fourth, the relatively low average EV battery capacity of GM, Honda, Toyota, and VW Group indicates that these carmakers will probably continue to produce both PHEVs and BEVs.
Fifth, Tesla’s high average EV battery capacity might be a signal that this automaker may become a supplier of EV battery capacity for other carmakers. By contrast, Stellantis’ figure could only be taken at this point as a puzzle.
Figure 2
Revenue of Leading Automakers Worldwide in 2021
(In Billion U.S. dollars)
Statista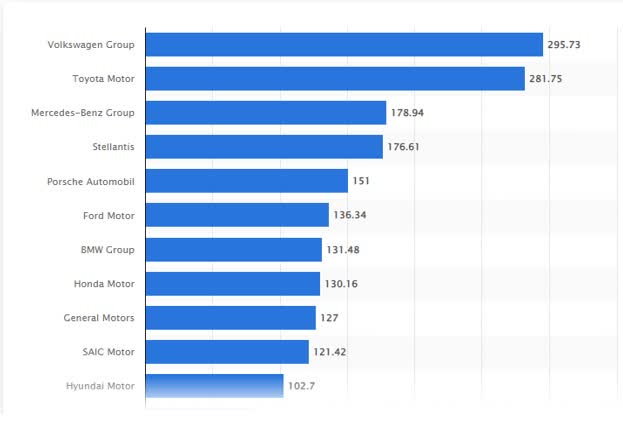
Source: Statista.
Sixth, due to a lack of information, only 18 out of 37 automakers included in the Reuters analysis were considered in this study. This points to an underestimation of both global planned battery capacity and global planned EV production in 2030. It also highlights the likelihood that many automakers, either included or not included in Table 3, may not be able to enter the EV market succumbing to competition by then. Note here that numbers from four Chinese automakers not incorporated in Table 3, though part of the Reuters analysis, point to this possibility. One automaker (SAIC), for example, ranked in the world’s top 9 in 2021 by revenue (See Figure 2) and beat Tesla in market share year-to-date, while three others (Chery, GAC, and Geely) proved to be its third, fourth, and fifth largest competitors by market share. (See Table 4).
Table 4
China: Top Brands by Share in the Plug-in Segment
January – September 2022
Insideevs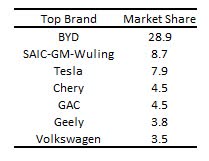
Source: Insideevs.
In closing, the question arises as to whether there is a strong investment case for EVs now or whether investors should wait to see who does or does not succumb to competition over the next 7 or 13 years before they make up their minds in this regard. One reasonable way to go about this problem might be to look at the factors affecting investment decisions. In this connection, nine such variables have been suggested, namely: 1) Investment objective; 2) return on investment; 3) return frequency; 4) involved risks; 5) maturity period; 6) tax benefit; 7) volatility; 8) liquidity; and 9) inflation rate. In what follows, and for the purpose of this short note, I will limit my commentary to the discussion of the first two only. To begin with, the investment objective is related to whether investors are interested in a short-term or long-term fund allocation which in this case may have to do with their decision to invest in EVs now or in the future. To the extent that, specifically, the BEV market constitutes a promising market in process of consolidation, it might make more sense to think of a BEV investment as a long-term allocation of funds rather than a short-term one. This would also lead investors to invest now in lieu of the future. However, this decision should not be exempt from a crucial consideration: The expected return on the investment. If its current measure can be taken as a guideline, investors should choose those options with the highest returns on investment or returns on total capital. Interestingly enough, as shown in Table 5, there seems to be an almost perfect correlation (0.97) between the sales of the world’s top 5 BEV automotive groups in 2022 H1 and their corresponding returns on total capital on 11/01/2022, which would clearly indicate investors where to invest.
Table 5
Global BEV Sales and Returns on Total Capital
Insideevs, EV-Volumes, Seeking Alpha
Sources: Insideevs, EV-Volumes, Seeking Alpha (1), Seeking Alpha (2), Seeking Alpha (3), Seeking Alpha (4), and Seeking Alpha (5).


Be the first to comment