

jaturonoofer
Main Street Capital (NYSE:MAIN) is one of the most popular Business Development Corporations (BDCs), and it’s been on quite a run. Since my last article about MAIN was published on 5/24/22, shares have appreciated by 16.51%, and when its dividends are taken into consideration, its total return has been 18.39%, compared to the S&P’s change of 3.94%. It’s been a busy August for MAIN, as they beat earnings estimates on EPS and total investment income, they priced an offering of $50 million worth of common shares, and investment firm Raymond James downgraded MAIN on valuation worries. As shares have started to retrace, I wanted to revisit MAIN and see if there is an opportunity to add shares or if the valuation looks inflated compared to its peers.
Seeking Alpha
Main Street Capital is pricing an offering of 1.17 million shares. What does this means, and is it a positive?
The market doesn’t seem to be thrilled with MAIN’s offering of 1.17 million shares. I hate share dilution because it decreases the equity my shares represent. When public offerings arise, investors should investigate what the proceeds are being used for and determine if the management team has a good track record of creating shareholder value.
On 8/15/22, MAIN closed on its public offering of common stock. The public offering consisted of 1.17 million shares at a public offering price of $42.85 per share. The underwriters exercised their option to acquire an additional 175,500 shares. The total number of shares included in the offering totaled 1.35 million, bringing MAIN’s net proceeds to $55.1 million.
Now that MAIN has generated $55.1 million in net proceeds, how will they be used? MAIN intends to initially repaying outstanding debt borrowed through its credit facility. Once this occurs, MAIN will look to reborrow against its credit facility to make additional investments. In addition to generating new business, MAIN will look toward allocating capital to marketable securities and other idle funds investments to be used in the future for general corporate purposes such as operating expenses or other cash-related obligations.
Main Street Capital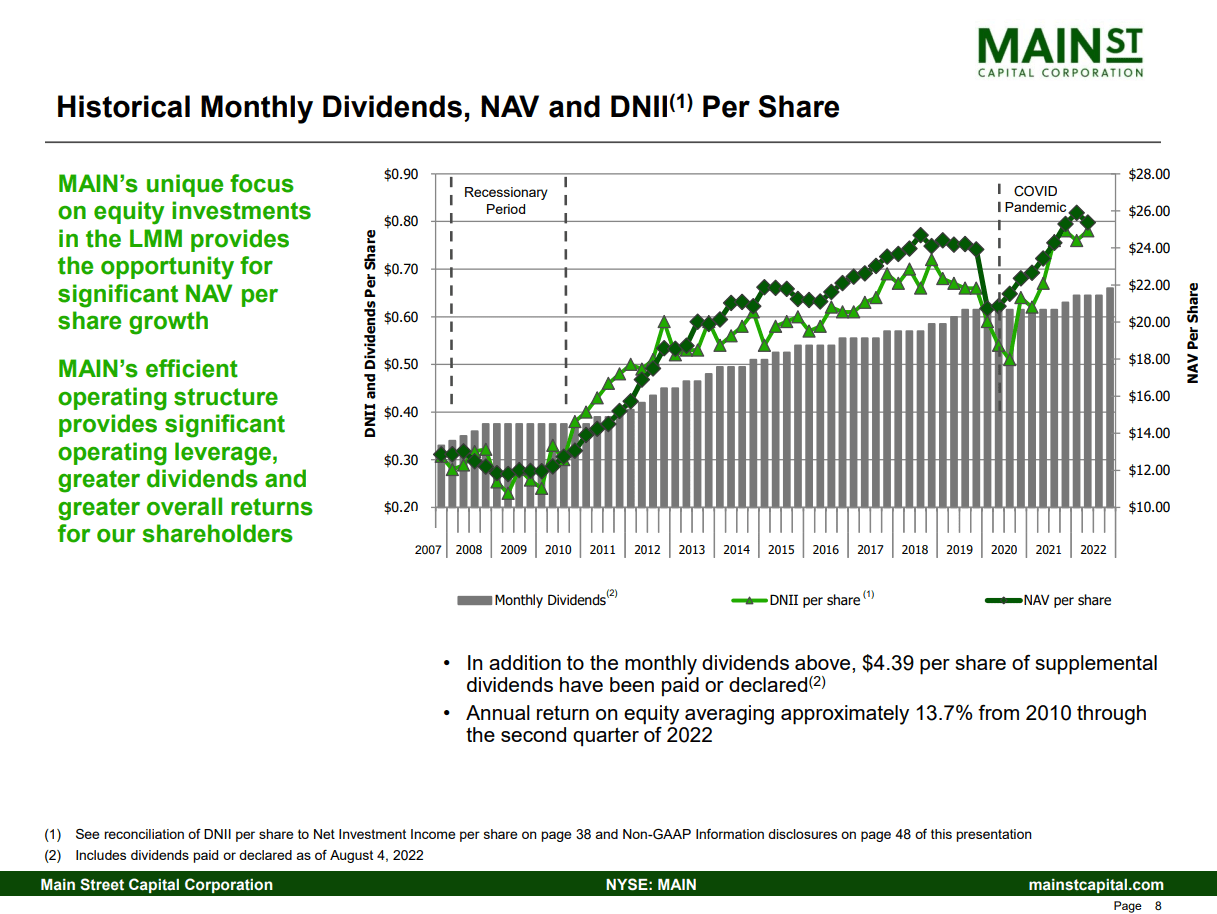
When I see that MAIN closed on its public offering, has diluted me as a shareholder, and raised a significant amount of capital, I want to examine its track record of generating value for shareholders. The share price will fluctuate with market dynamics and sentiment toward MAIN as a stock. I am looking to see if MAIN’s management team has created an established track record of increasing MAIN’s net asset value (NAV), and net investment income (NII). NAV and NII are two important factors when looking at BDCs because NAV represents assets minus liabilities, and NII measures how well MAIN’s assets are performing, as this is where their income is generated from. If management flatlined growth in these area’s then the offering would be negative in my eyes, but if management has continued to drive these metrics higher, then arming them with additional capital to make future investments is probably worth the dilution in shares.
MAIN’s quarterly presentations are phenomenal as they detail many aspects of their business clearly. On page 8 (image above)it indicates that MAIN has an established track record with a cause and effect I look for. For me, MAIN is an income investment. I want to see MAIN making investments that drive their NAV higher, which leads to larger amounts of NII, which correlates to dividend increases. When MAIN is generating more NII, they have the ability to increase its dividend to shareholders. Market fluctuations will always cause MAIN’s NAV to appreciate or depreciate, so I am looking for an entire picture of MAIN’s history, not what they did over a specific quarter. Going back to 2007, there have been lulls in MAIN’s NAV and NII, but ultimately, they always move higher and have driven the dividend to increase. It’s hard not to back management on the share offering when MAIN’s annual return on equity has averaged 13.7% from 2010 through Q2 2022. While I hate being diluted, I don’t have a problem with the offering because I believe MAINs management can drive additional value in its NAV and NII, which should correlate to future dividend increases.
While I agree with the share offering, I need to see how MAIN’s valuation looks compared to its peers
Now that I have looked at MAIN’s track record of growing its NAV, NII, and dividend, I want to see how its valuation is positioned compared to other BDCs. I am specifically interested in how its valuation looks compared to Ares Capital (ARCC), as this is the largest publicly traded BDC by NAV. I use three metrics to evaluate BDCs: the NII to market cap multiple, price to NAV discount, and the dividend yield. NII is a better metric than EPS to utilize for a BDC, so the NII to market cap is a more effective measure than a P/E ratio. This is why I utilize this metric to see how cheap BDCs are trading against their NII. I also like to see if there is a steep discount or a heavy premium with a BDCs price to NAV valuation, in addition to looking at the yield and dividend coverage.
I will be comparing MAIN’s discount to NAV, NII to market cap, and dividend yield to the following BDCs:
- Ares Capital (ARCC)
- FS KRR Capital Corp (FSK)
- Apollo Investment (AINV)
- Goldman Sachs BDC (GSBD)
- Prospect Capital Corp (PSEC)
- Owl Rock Capital Corp (ORCC)
- Barings BDC (BBDC)
- Golub Capital BDC (GBDC)
- Sixth Street Specialty Lending (TSLX)
- Gladstone Capital (GLAD)
MAIN is trading at an extreme valuation to its NAV, as its premium is 66.68%. MAIN has a NAV of $25.39, and with its share price of $42.21, this seems like a large premium considering the rest of its peer group. I am surprised at how much of a premium Mr. Market has placed on MAIN compared to ARCC. The average premium across the 11 BDCs I have used for MAIN’s peer group is 2.83%. This could be a sign that much of the upside is priced into shares already.
Steven Fiorillo, Seeking Alpha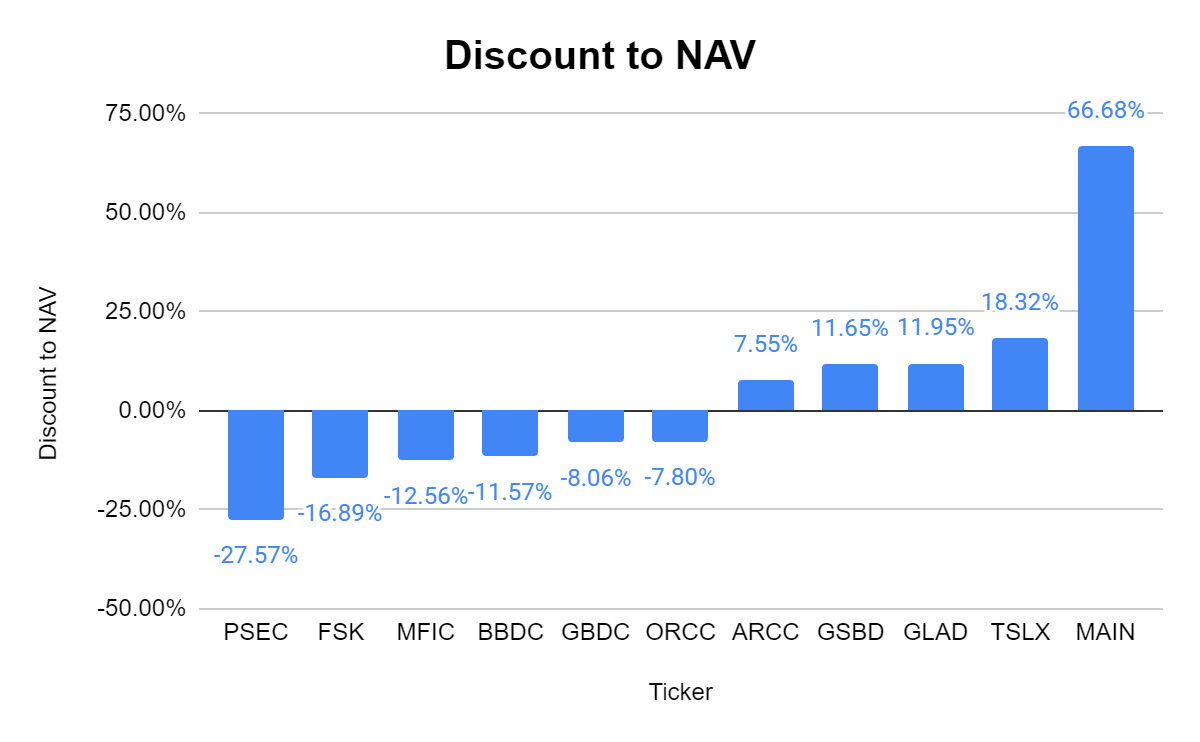
As the market has placed a 66.48% premium on MAIN’s NAV, I wanted to immediately look at MAIN’s NII to market cap. This is the same methodology as looking at funds from operations (FFO) to market cap for REITs, or distributable cash flow (DCF) to market cap for MLPs. I want to pay the lowest price for a BDC’s NII. I look at the NII to market cap to make sure I am not paying a large premium on a company’s ability to generate NII, and because I am cheap and want to get a price for a BDC’s NII.
MAIN has generated the 5th largest amount of NII at $258.3 million over the TTM. This places MAIN’s NII to market cap ratio at 12.32x. The peer average is 14.71, as BBDC has an extreme multiple of 50.25x. Without BBDC, the peer group average would be 11.15x. This is interesting because MAIN has such a large premium on its NAV but is trading at a reasonable valuation on its NII to market cap.
Steven Fiorillo, Seeking Alpha
The last metric I will look at is how much each of these BDCs generates on their dividend yield. MAIN generates the lowest yield at 6.1%, while FSK is at the top of the range generating 11.13%. The peer group averages a dividend yield of 8.97%. MAIN is substantially lower than the peer group average, and there are several BDCs that trade at a discount to NAV, have a lower NII to market cap multiple, and have a larger dividend yield. While 6.1% is nothing to complain about, as a pure income investment, there are other BDCs that are more attractive.
Steven Fiorillo, Seeking Alpha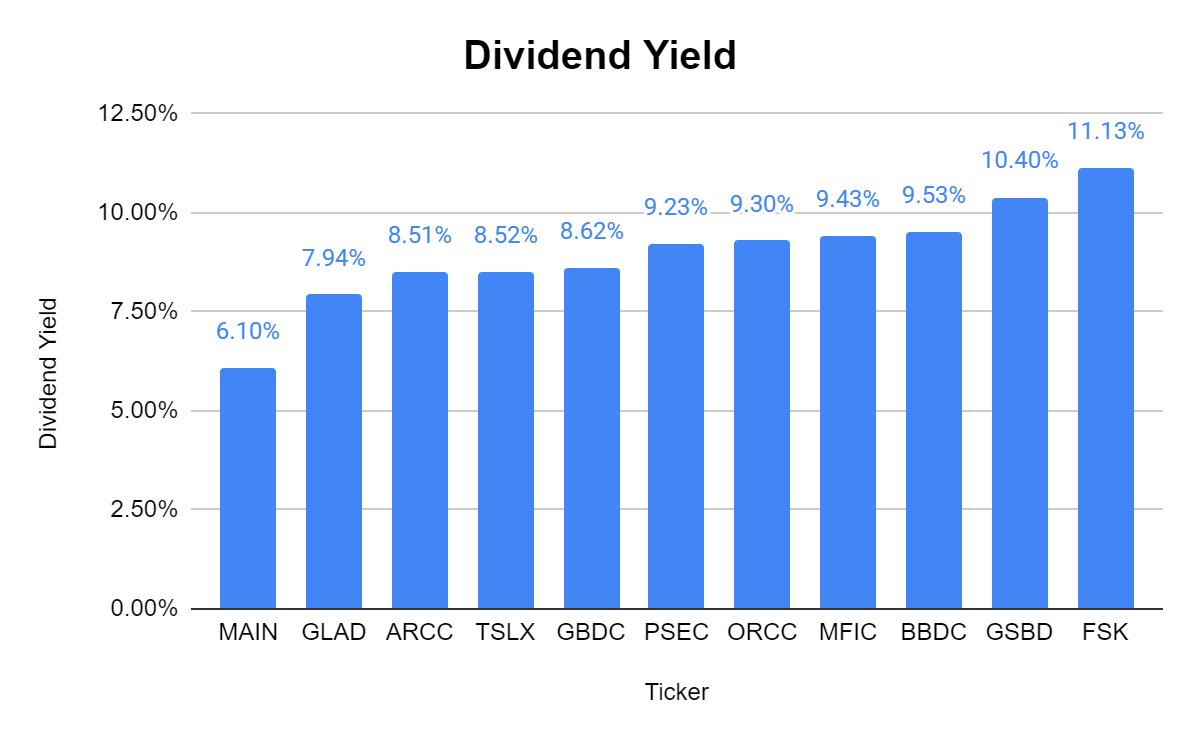
Conclusion
After looking into how MAIN will utilize the proceeds from its stock offering, I am not concerned about the share dilution. MAIN’s management has a longstanding track record of ultimately driving its NAV and NII higher, which has resulted in larger dividends for shareholders. While I am on board with the offering, the valuation isn’t flashing a for sale sign at me. MAIN’s share price premium to its NAV is quite large, and it’s the most expensive BDC I looked at in the peer comparison. While the premium placed on MAIN’s NAV is high, it trades at a respectable price to NII, which is appealing. If I was scoring this with 1 point per category, the dividend yield would be a tie-breaker causing me to refrain from adding to the position at these levels. My investment thesis hasn’t changed, and I am still a fan of MAIN. I just see more value in other BDCs. I think MAIN is certainly a hold, and if its share price comes back to the $37-$38 range, it will get me excited about adding to the position.
Be the first to comment