

Macro Will Matter (More) To Bitcoin
2021 has proven to yet again be an exciting year for bitcoin investors. The nascent asset (yes, I believe it’s still early) has risen to a market cap just under $1 trillion while notching a +100% return along the way.
Over the course of the year, bitcoin has undergone increased institutional adoption, the launch of a futures ETF, and the first major upgrade to the Bitcoin network in four years. The path forward has been anything but smooth as bitcoin investors have consistently weathered periods of gut-wrenching volatility. For some traders, this is an attractive feature of the asset, they eat volatility for breakfast. For others, it’s enough to keep their capital away entirely.
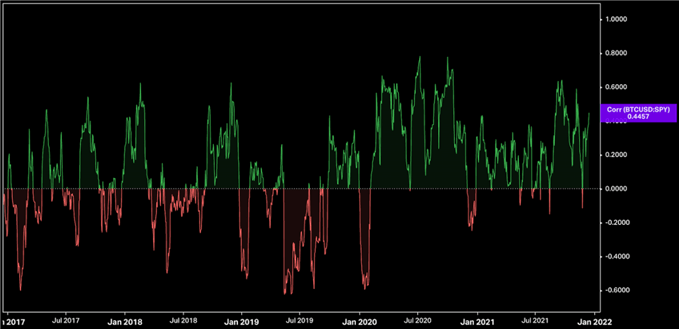
BTC/USD vs SPY Relative Performance 1Y
Source: Koyfin
Bitcoin’s volatility is likely to dampen over time, but it’s not going away. The future of crypto is tethered to technological advancements, and higher prices likely hinge on exponential network growth, making the task of forecasting a specific price target a difficult endeavor. Regardless, as bitcoin undergoes further institutional adoption as an asset class, its returns will likely become more of a function of the current macro regime. Hence, without a view of cross asset class relationships and an understanding of where we are in the economic cycle, you might be trading in the dark.
Cross Asset Correlations
When looking at bitcoin’s historical correlations with traditional assets, there’s a positive relationship with the S&P 500, as well as commodities such as gold and crude oil. This trend in correlations among bitcoin and equities has also been strengthening for much of the year.
BTC/SPY 21-Day Rolling Correlation
Source: Koyfin
This could be further evidence that bitcoin is similarly influenced by the outsized impacts of both monetary and fiscal policy in a post-COIVD world, or that growing intuitional adoption has ushered in the same risk management processes employed by these investors across traditional assets. Either way, since January of 2020, bitcoin’s returns have mirrored equities more frequently than ever before.
It’s also worth noting, that like most individual securities within a broad-based equity index, cross asset correlations will strengthen during periods of elevated volatility. Investors often reduce risk exposures in volatile markets, resulting in strengthening correlations across markets. Should equity volatility remain elevated as the Federal Reserve embarks on its process of monetary tightening, this could make for a more challenging environment for bitcoin during Q1 and into Q2.
Bitcoin is also likely to struggle, should the persistent dollar strength of Q4 21 continue. Whether you prefer to view bitcoin as a currency or a commodity (I classify it as a commodity), the dollar is a factor. The strength of this inverse relationship can certainly wane, but going forward, like most commodities, a strong dollar could impede performance while dollar weakness might offer a tailwind.
BTC/UUP 21-Day Rolling Correlation
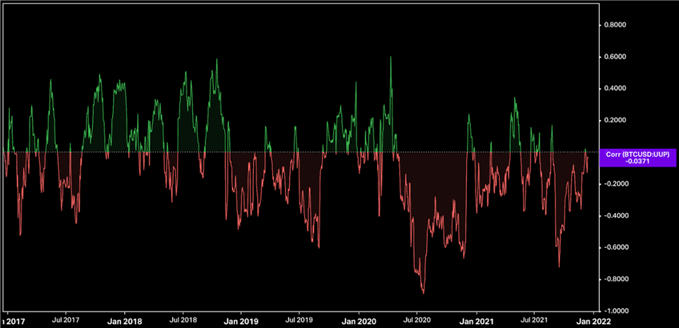
Source: Koyfin
BTC, UUP Price Chart QTD
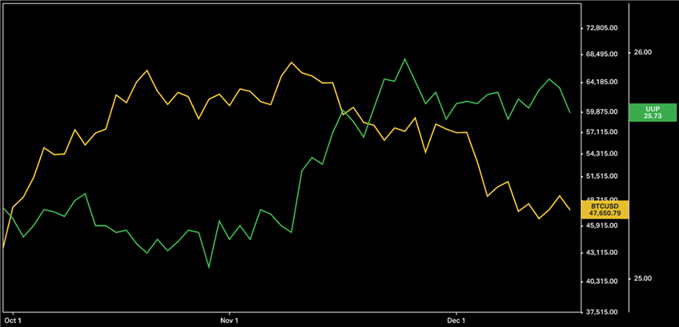
Source: Koyfin
The Economic Engine
Given these observations, as we look ahead to Q1, I believe bitcoin will ultimately become a prisoner of economic growth and inflation. The macro environment will begin to have a more pronounced impact. The liquidity implications of tighter monetary policy, coupled with a potential growth slowdown, could negatively affect the market’s most volatile asset. No matter how bullish we might be on crypto’s potential over the long run, this warrants consideration.
The yield curve is sending a warning. Bitcoin often exhibits a strong positive correlation with the U.S. Treasury yield curve. As the slope of this curve is often used as a barometer of investors’ future expectations for economic growth and inflation, a flattening curve is cause for concern. Bitcoin has done well during periods of curve steepening, while struggling as it flattens. For most of 2021, if you’ve been able to get the slope of the yield curve right, directionally it’s kept you on the right side of the bitcoin trade.
Should this hold true, going forward we’d expect bitcoin’s price to perform well during periods of economic growth and inflation, often coinciding with higher long-term interest rates, while a growth slowdown and disinflationary backdrop could make things difficult for BTC. Similar as to how equities tend to underperform during periods of economic deceleration.
BTC/USD, UST 10Y-2Y 1Y
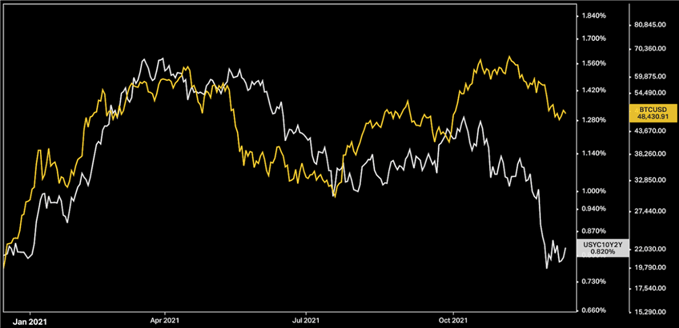
Source: Koyfin
Making Sense of Volatility
To establish a realistic expectation for bitcoin’s price over the next quarter, let’s model potential outcomes through the lens of historical volatility.
Bitcoin Historical Volatility Chart
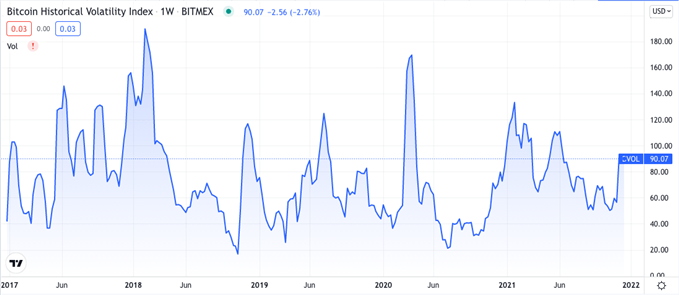
Source: TradingView
As bitcoin has matured as an investable asset, its realized volatility has declined over time. Volatility spikes have resulted in lower successive highs, falling from 190% in 2018, to a lower peak of 110%, during bitcoin’s spring rally.
If we model an expected annualized move using these prior realized volatility highs and a spot reference price of $47,000 BTC/USD, we get the following theoretical trading ranges for the next year.
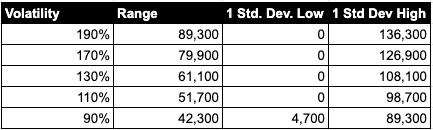
Due to its highly speculative nature, there’s often a positive correlation between the bitcoin spot price and its underlying volatility. Therefore, it’s certainly within the realm of possibilities that bitcoin vol can reach levels in excess of 100%, though the price itself cannot go below $0.
To calculate the standard deviation of an expected range for bitcoin’s price over any time period, we can enter our volatility input into the following formula:
P*V*(SQRT(n/360)
P=Price
V=Volatility
n= # days
forward SQRT = Square Root
Applying this same calculation to the Q1 period on a forward basis and assuming a current realized volatility of 90%, we get a statistically probable range for bitcoin of +/- $21,910. Meaning, should bitcoin volatility remain sticky at these levels, it’s entirely reasonable for bitcoin to reach $68,000 on the upside or trade as low as $25,000 on the downside over the next quarter. A wide range, but in line with how bitcoin has traded historically.
Be the first to comment