

Drew Angerer
Federal Reserve Chairman Jerome Powell has a tough job to begin with, but when monetary conditions aren’t the primary driver of inflation, it’s even tougher.
In evaluating inflation and central bank responses, we need to understand the primary cause of today’s inflation. The main cause of inflation is energy prices accounting for about half of inflation. Everything else, supply chains, real estate, labor, etc… added together, is also about half.
The Fed can’t fix energy prices. And, in tightening monetary conditions, it can hurt the buildout of reliable supply chains which is needed to reduce inflation. They are having some success with real estate prices, which is good, but they are walking a fine line with employment.
In October, I expect significant downward earnings revisions on persistent energy inflation, creeping wages, slower growth and new taxes on large corporations.
You know my conspiracy tilt is that corporate executives will do what is best for their pocketbook. That means they want all the downside priced in this year given it’s been a tough year already. That way, they can look forward to big paydays on a rebound. Basically, I expect them to have a kitchen sink quarter to set up the next bull market. The last quarter of the year, though, could be very rough.
Timelines are funny things. I could be off a quarter or five. That’s why it is important for us to realize that it is a market of stocks. We need to know our companies so we can buy when prices tell us to. We also need to use volatility to our advantage, not let it cause us to do panicky things.
We are currently back around the high-end of our cash asset allocations after getting a little longer and selling puts over the summer. Cash is the most effective hedge for non-traders. We will want to opportunistically deploy that money as prices come to us.
Inflation Is Energy Driven
You know all the narratives about why inflation is happening by now. Hyper-partisan and dogmatic Austrian economists point to the stimulus response to Covid-19 and the Federal Reserve staying looser for longer. Others point to real estate prices, while others point to wages.
But, numbers don’t lie. They just tell a story. Here’s the story. Inflation is primarily being driven by energy prices, which are largely being impacted from OPEC policy and Russia’s invasion of Ukraine.
Here’s a couple of simple charts to put it in perspective.
Where Inflation Is From (BLS)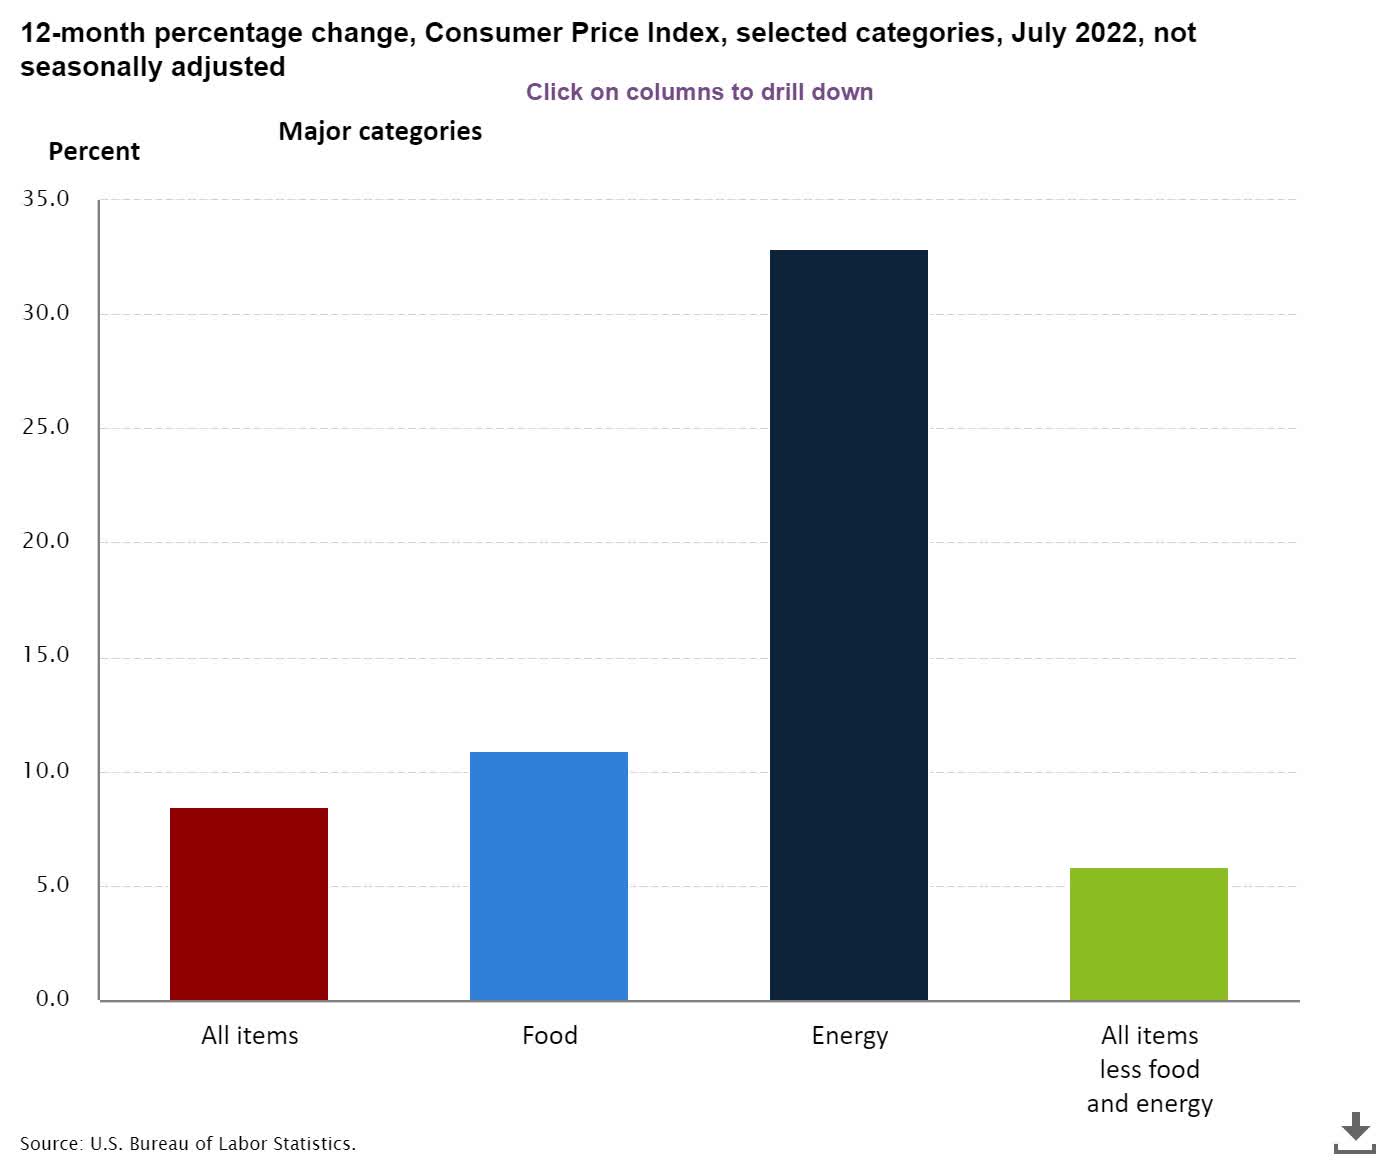
I continue to show this chart as it is very clear what is happening. And, remember, energy prices impact the underlying prices of other goods, including food.
Excluding the impact of energy and food (seen far right), inflation has already fallen significantly. I would hypothesize that implies improving productivity, which is important long term as we face labor shortages with the Baby Boomers retiring.
Here’s another way to visualize things using BLS data:
Energy impact on inflation (BLS via Trading Economics)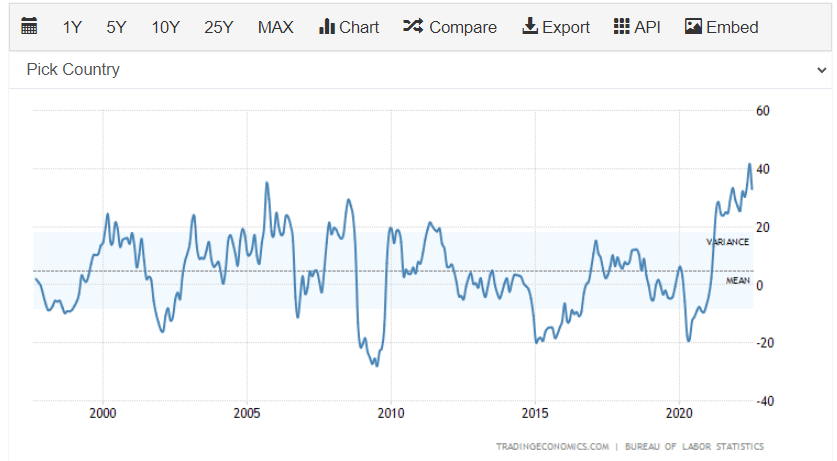
We are well outside of the normal range for energy impact on inflation.
Here’s Jerome Powell’s take today.
Powell hawkish (Bloomberg)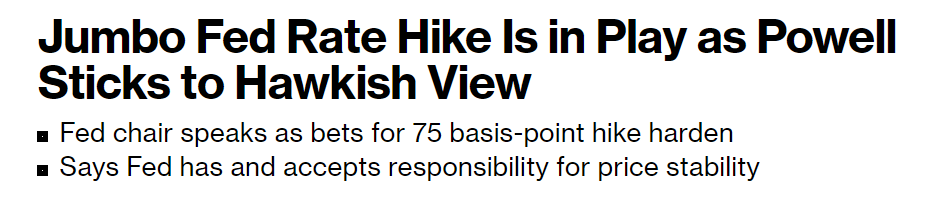
And while I disagree with his take due to him having very little impact on energy, it doesn’t really matter what I think is the right policy choice – he doesn’t call me.
So, all we can go on is the fact that energy is the most important influencer of inflation and that Chairman Powell is intent on lowering inflation by any means necessary – at least by his recent statements.
Tighter Fed impact (Goldman Sachs)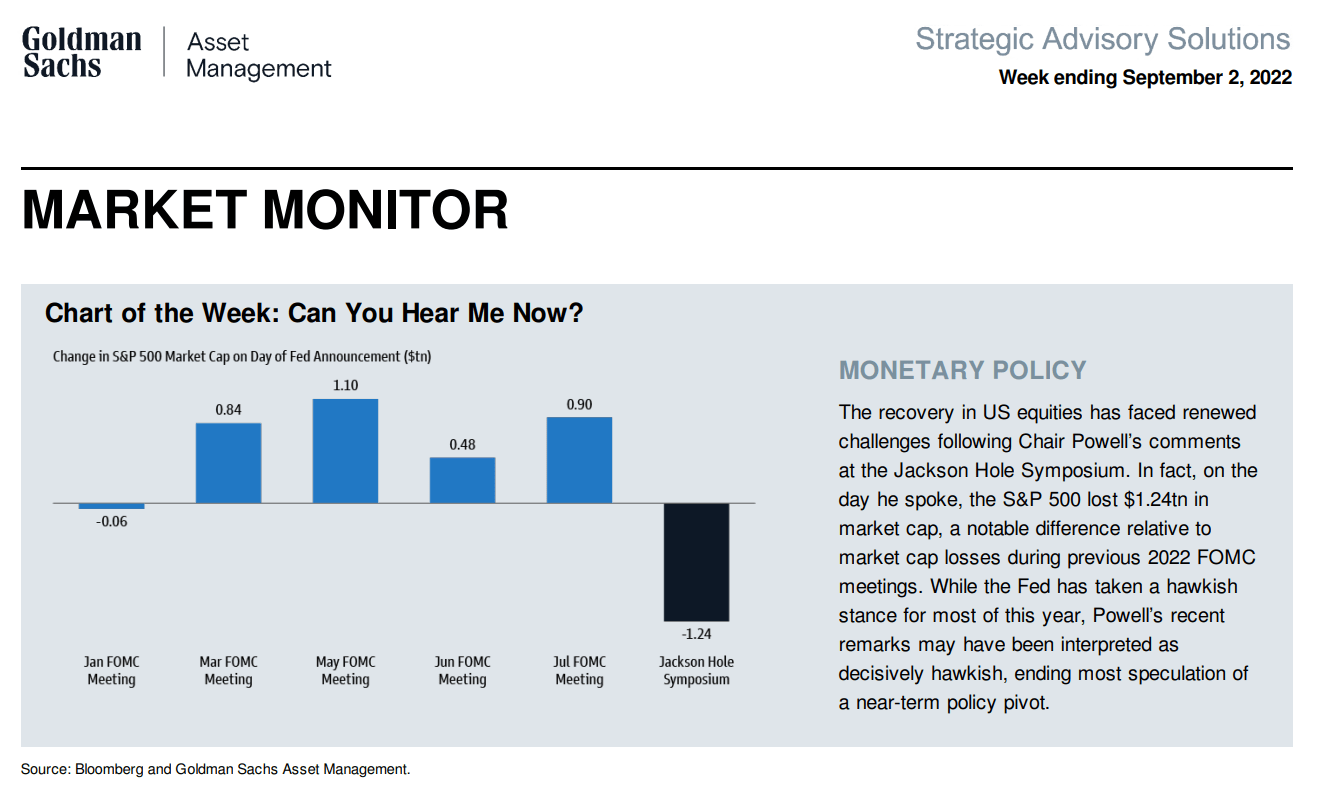
Again, I think much more tightening is a policy mistake that will drive the U.S. into what I have called a “skip straight recession” or a very choppy economy.
Under those circumstances, at some point, the stock market has to discount a recession since it seems that lowering aggregate demand vs improving supply is the side Powell is taking. Sinful in my opinion, but, all I can do is react to reality as it is presented to me.
European Contagion Risk
You think it’s bad in the U.S. Take a look at Europe. It’s even worse.
Europe natural gas prices (U.S. Chamber)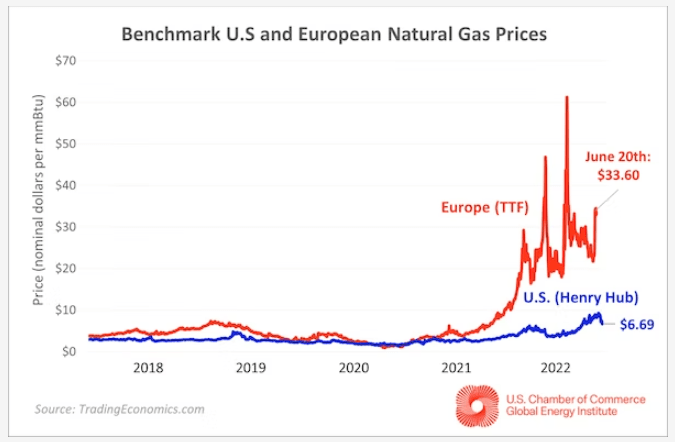
This implies a very strong chance that we see a shock from Europe to the global economy. Simply, there is no quick solution to high energy prices unless OPEC and Russia make drastic changes to their recent approaches on energy and war.
Today the European Central Bank raised interest rates .75 and outright said that more hikes like that are coming in the next several months. This is at the same time that European growth is under 1% and approaching zero.
ECB tightens (New York Times)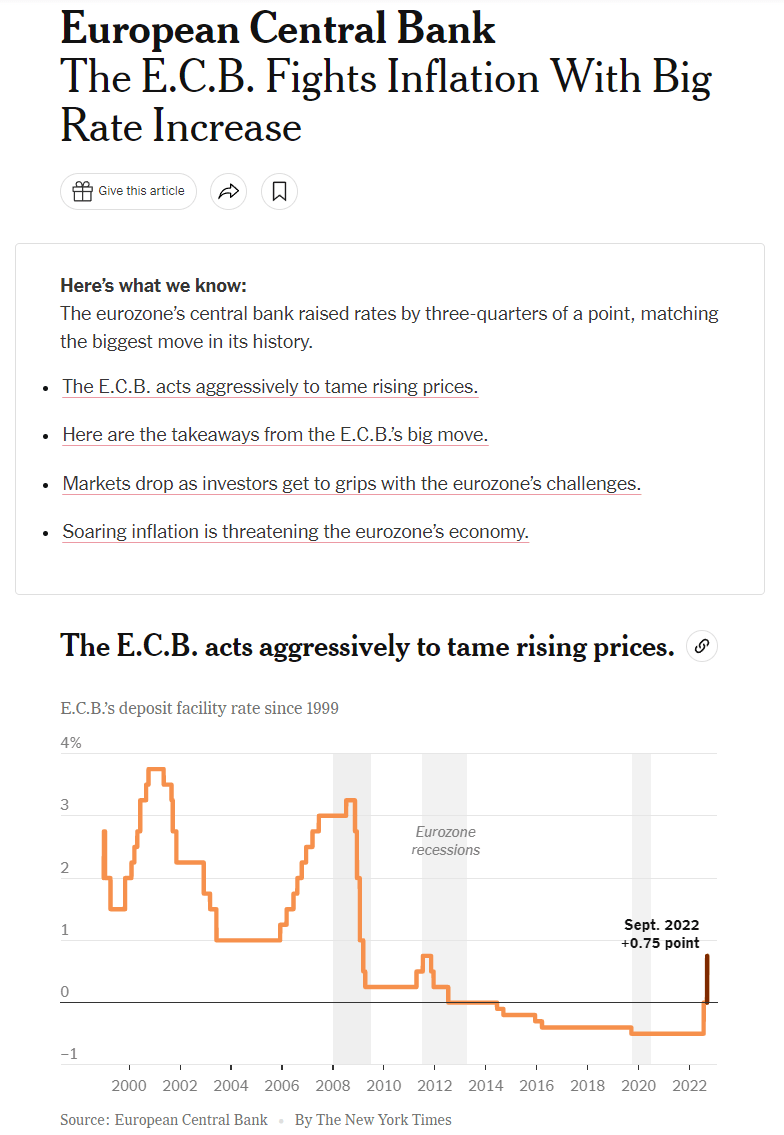
Already we are seeing dramatic impacts from higher energy prices in Europe. How bad will it get with tighter monetary policy?
German industrial slowdown (Financial Times)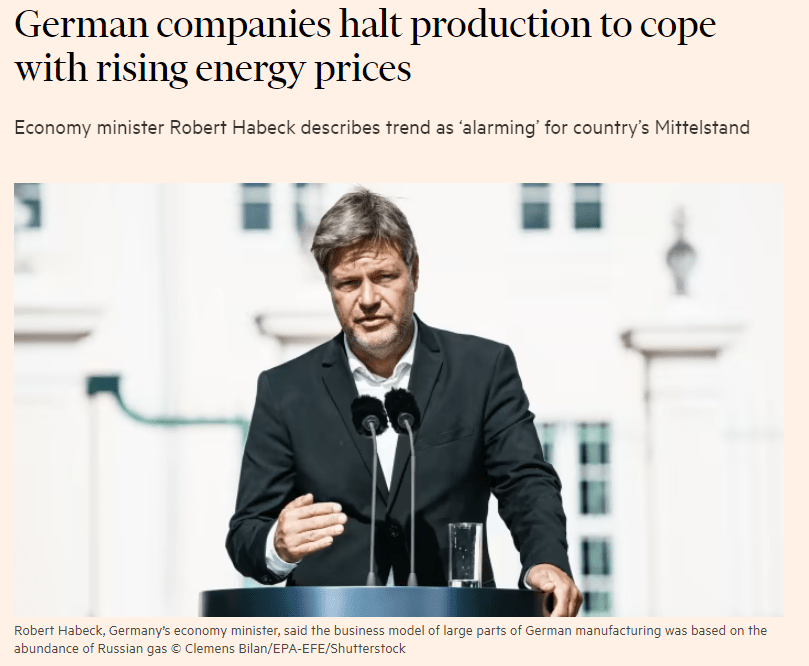
The impact is being felt all over Europe. Do a search on Twitter for “European Energy Crisis” and you find hundreds of posts like this:
Crab Man tracking European energy bills (Twitter @crabcrawler1)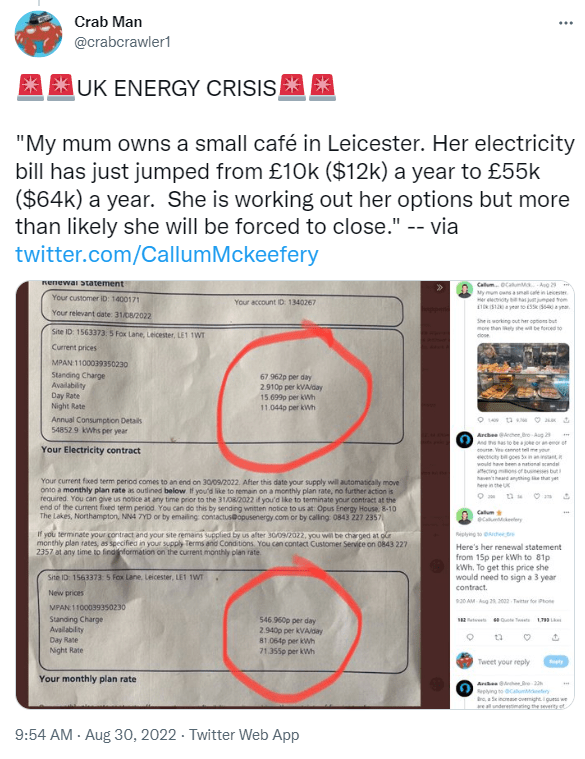
From the BBC:
Soaring European Energy Prices (BBC)
The risk of a deep recession in Europe seems very high and imminent. There’s virtually no way that doesn’t spill over.
European Risk (Bloomberg)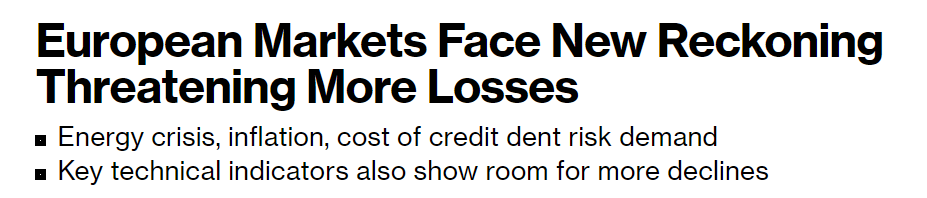
Q4 Earnings Outlooks
Corporations face a tough task keeping earnings expectations up while energy is expensive and labor markets are tight. Add that large corporations effectively had a limit set on their use of tax avoidance strategies and we have a recipe for downward revisions on earnings.
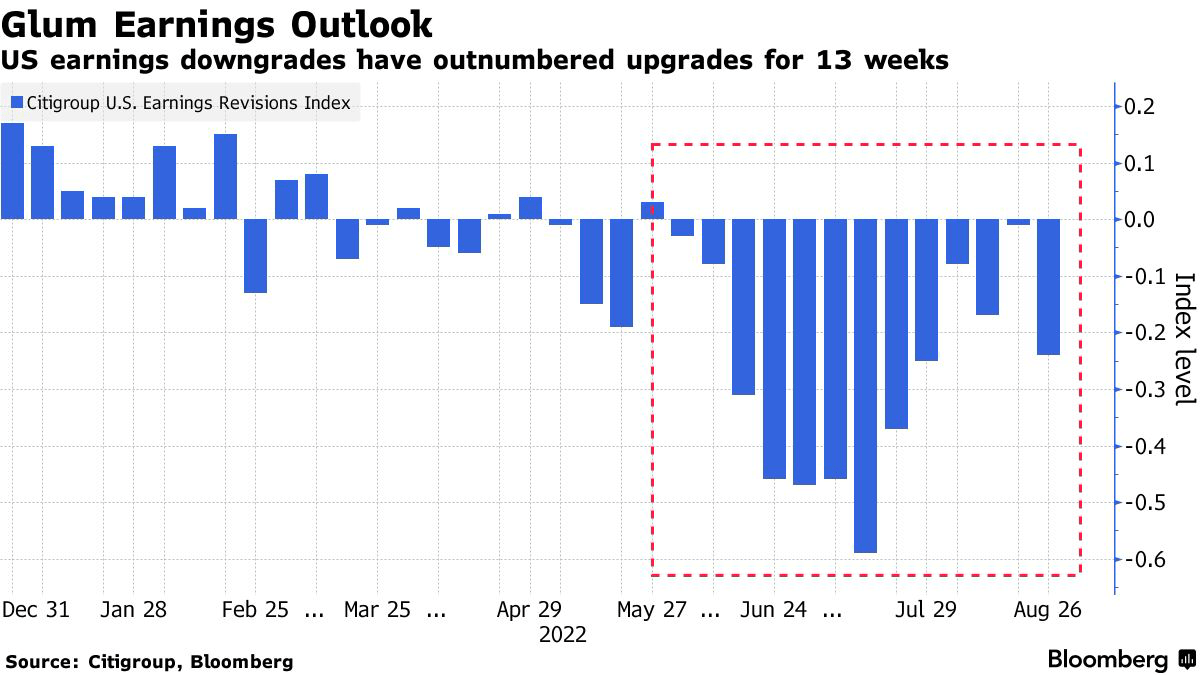
I’m not the only one in the earnings bear camp.
Citi’s Wilson on earnings (Investing.com) Citigroup on earnings (Bloomberg)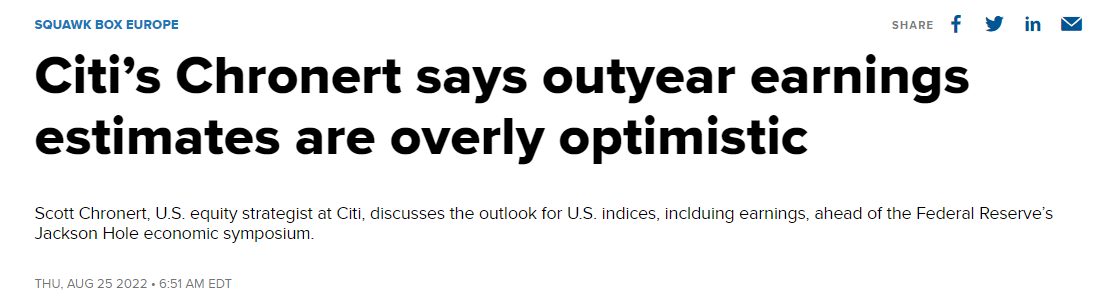
Even Yardeni is saying current earnings forecasts are wrong.
Yardeni on earnings (Yardeni Research)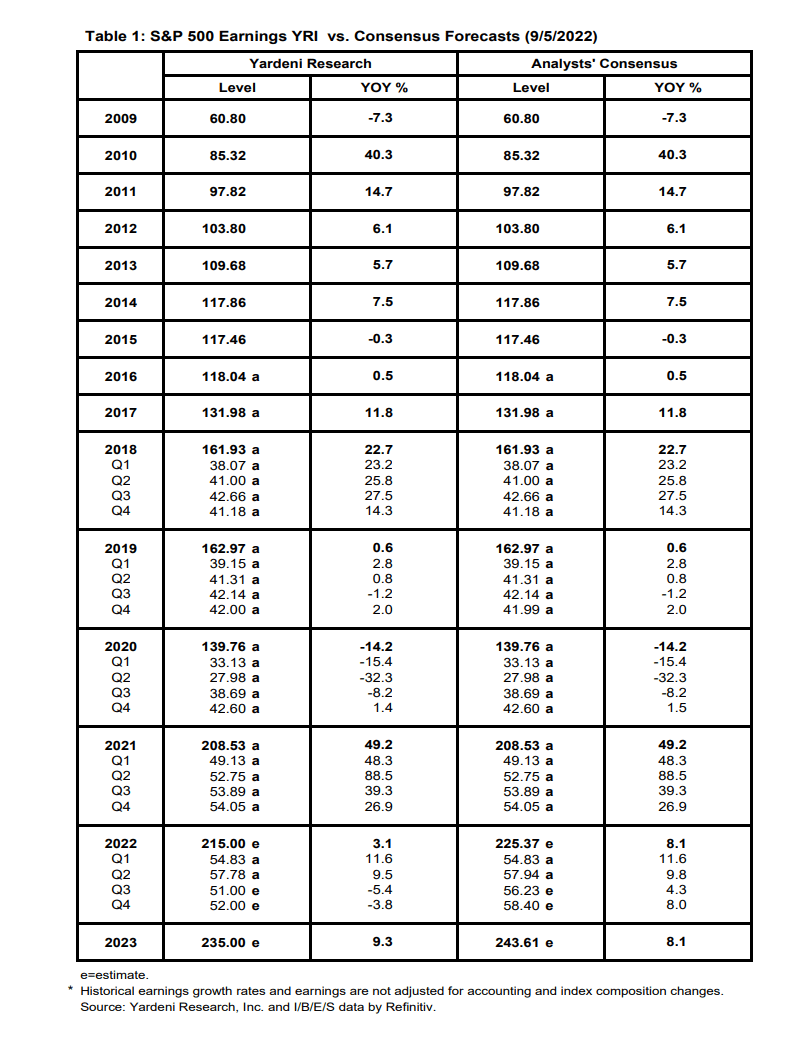
Yardeni’s track record is very solid long-term. You don’t find many arguing with him ever.
From Morgan Stanley:
Morgan Stanley on earnings (Investing.com)
This jives with my thinking. Middle 3000s for the S&P 500 (SPDR S&P 500 Trust ETF (NYSEARCA:SPY)) as a base case with lower very possible.
Technical Analysis
Each week we track the major markets. Here is a recent weekly chart from our Elliott Wave analyst Scott Henderson.
SPY Elliott Wave (Scott “Shooter” Henderson)
Scott trades more frequently than I do, so he incorporates shorter-term outlooks into a longer-term view. He has participated in the recent rally, but sees a likely range of 366 to 338 as price target for SPY in coming months.
He also identifies the risk of much lower prices which would be triggered by some sort of shock.
I take a more traditional technical view with some quant included. I mainly focus on longer-term time frames. Interestingly, Scott and I are normally pretty close on the ultimate pivot points for the longer-term trades (position trades lasting quarters to years).
SPY Weekly Chart (Kirk Spano)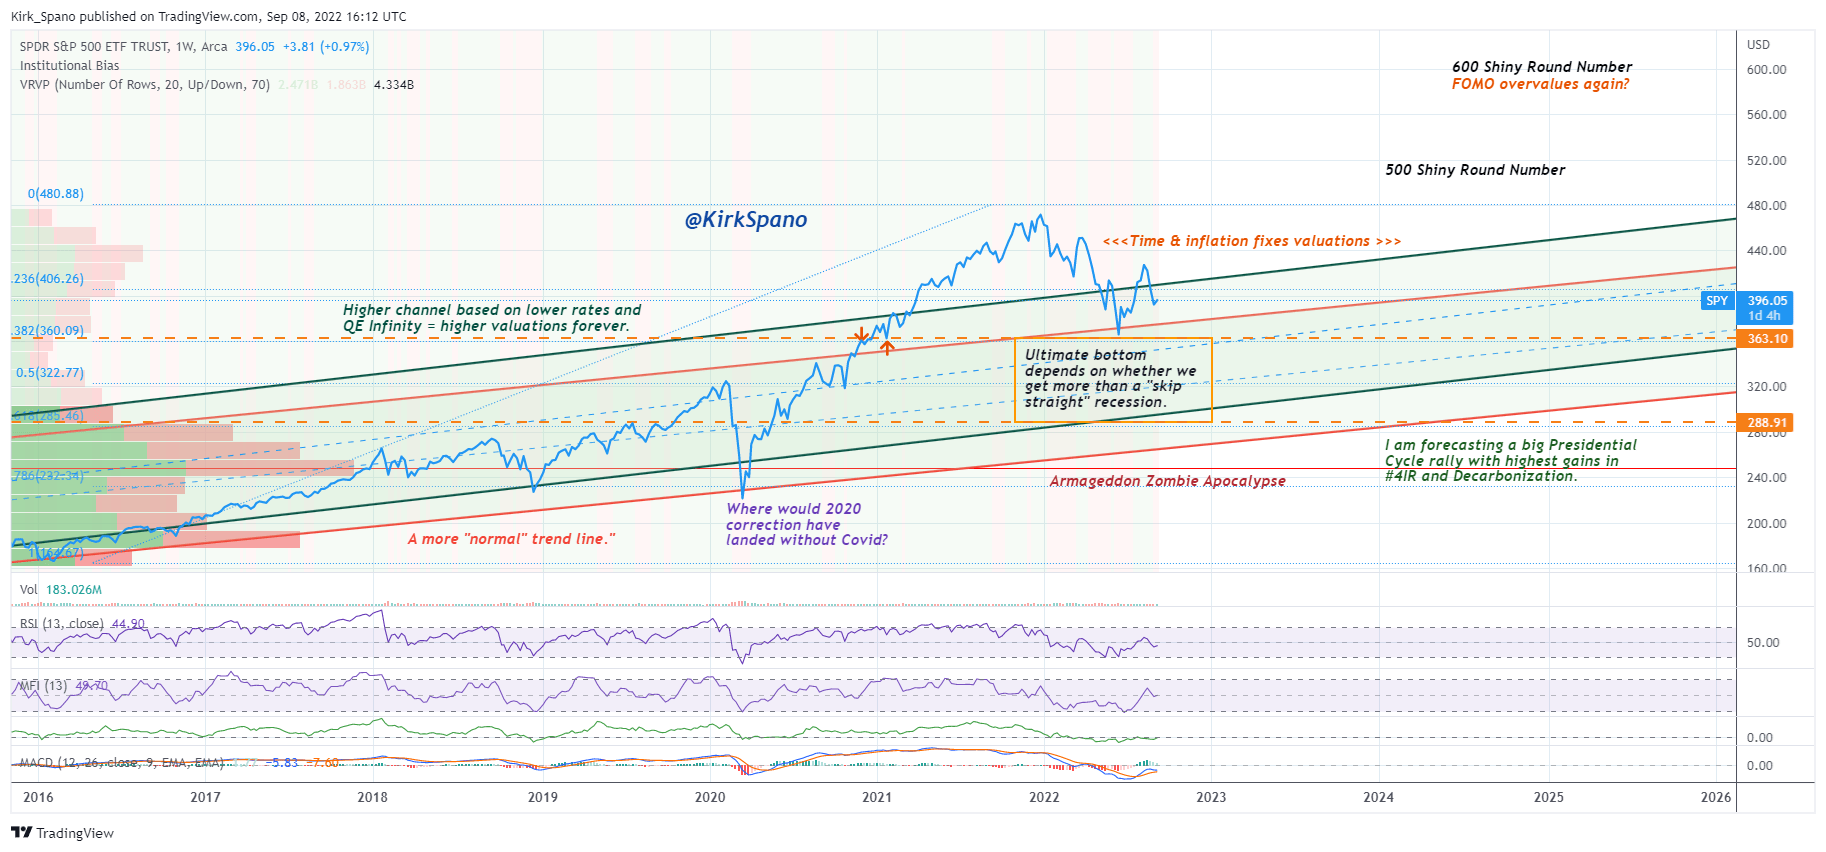
The current weekly charts are showing that indicators like RSI (Relative Strength Index) are coming down from both overbought earlier in the year on both the monthly and weekly time frames.
When the weekly and monthly RSI are both oversold has always, and I mean I’ve never found an exception, a great time to buy for long-term investors.
Here’s the monthly chart of SPY.
SPY Monthly Chart (Kirk Spano)
Notice that the monthly RSI was overbought at the end of 2021, which is when I wrote a series of articles to lighten up on stocks.
My 2022 Futile Forecast: The Dollar, Stocks, REITs, Crypto, Inflation
S&P 500: Historic Overvaluation Is Tinder Under Stock Market
Bear Markets, Liquidity And How Low Stocks Can Go
SPY: Large Caps Are On Thinning Ice (NYSEARCA:SPY)
Let’s focus on the RSI because it’s a great directional momentum indicator.
RSI Monthly Charts (Kirk Spano)
If you were a net seller when the stock market had an overbought RSI and a net buyer when it gets below 50 you have done well.
I do not know how low the stock market goes. Nobody does. If they say they do, they are lying.
But, I think the range is to test the June lows to significantly lower. I bought certain stocks around the June lows and intend to hold those. I intend to deploy the rest of my cash as stocks trend lower. I will be scaling in very slowly. There are already bargains in the SMID caps in my opinion.
Investment Quick Thoughts
I believe that the S&P 500 (VOO) tests the lows of June.
It could get worse, especially if central banks turn an energy induced slowdown into a deep recession.
There are already bargains in SMID caps in my opinion, which we have been picking up for months now.
My recent article on S&P 500 stocks to buy on a double bottom or worse is what I plan to mostly shop from for large caps.
For details on hearing the webinar on this topic please visit my blog.
Be the first to comment