

ismagilov/iStock via Getty Images
2022 International Value Review
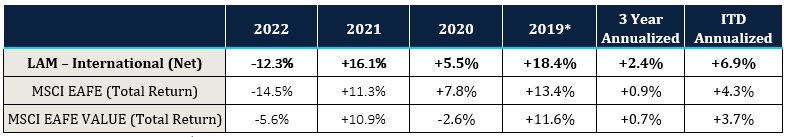
Our international portfolio outperformed the MSCI EAFE index by 220 bps in 2022. For the first three quarters of the year we were slightly ahead of the index, before surging in the fourth quarter, with a +19.8% return, compared to +17.3% for the MSCI EAFE.
Longer-term the fund continues to do well. Since inception in 2019, we have generated a 6.9% annualized return, with 260 bps and 330 bps of outperformance, against the EAFE and EAFE Value indices, respectively. We have achieved this result while climbing a wall of worry that has included: a value downcycle in 2019, COVID in 2020, an economic reopening in 2021, and then inflation, rising interest rates, the war in Ukraine, and a weakened European economy in 2022.
Looking forward, we have high expectations. We’ll put it bluntly: sentiment towards international markets, particularly in Europe, is sour. But, as we will show you in this letter, we believe this is creating an opportunity to find high-quality global businesses that are on sale because of where they trade.
From a valuation perspective, the portfolio is trading under 9.5x 12-month forward earnings, which is as cheap as it’s been since we launched the strategy in 2019. And from an earnings perspective, the portfolio shows superior fundamentals with better historical earnings growth and more resilient earnings during economic downturns.
If you would like to learn more, please reach out. The strategy is also available as a mutual fund (ticker: MUTF:LYRWX).
Looking Back
We ended 2022 ahead of the EAFE but behind the EAFE Value, which was the first year we trailed our style benchmark since launching the strategy in 2019. Although we lagged the value index in 2022, this underperformance was mostly because of differences in sector composition. Our portfolio has more tech exposure and less commodity exposure, both of which hurt us and explain almost all the underperformance. We lagged the EAFE Value by 670 bps and 75% of that came from our higher exposure to the tech sector, with another 25% from our lower exposure to commodities.
As a result of our focus on quality and analyzability, we avoid many of the industries that led markets through a tough 2022, notably pure commodity businesses and interest-rate sensitive companies. Over the long haul, we believe this is the right approach, as we avoid these industries that tend to be both lower quality and more difficult to analyze.
Europe: Global Compounders on Sale
In 2022, the EAFE had its worst year since 2008, as macro fears drove down international markets. Against this backdrop, we added five European businesses to the portfolio. With those investments, we now have 53% of the portfolio exposed to the region, up from 43% at the end of 2021. Increasing this exposure during the year that Europe saw a ground war, an energy crisis, and a collapsing currency may raise some eyebrows. With such a tumultuous macro backdrop, investors may wonder why one would want more European exposure? While we don’t disagree with these macro concerns, we believe this broad-based macro fear has created a wonderful opportunity to own good, global businesses, trading with European discounts.
Added European Exposure in 2022, now 53%
Source: Factset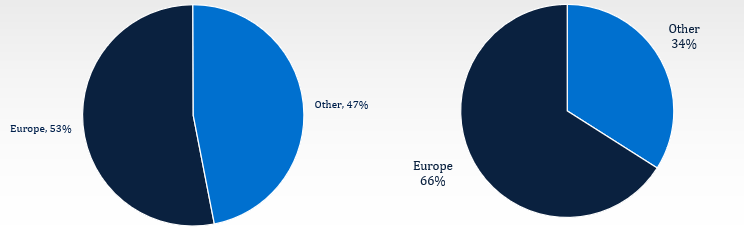
While macro concerns around Europe are real, these concerns have depressed the valuations of many European-listed businesses that are, in fact, global businesses. In the chart below, we show our portfolio exposure by stock listing and by business revenue. As you can see, while 53% of our portfolio is listed or headquartered in Europe, only 35% of portfolio revenues are derived from Europe. This is because we tend to own global businesses in this portfolio.
Portfolio Revenues are Globally Diversified
Source: Factset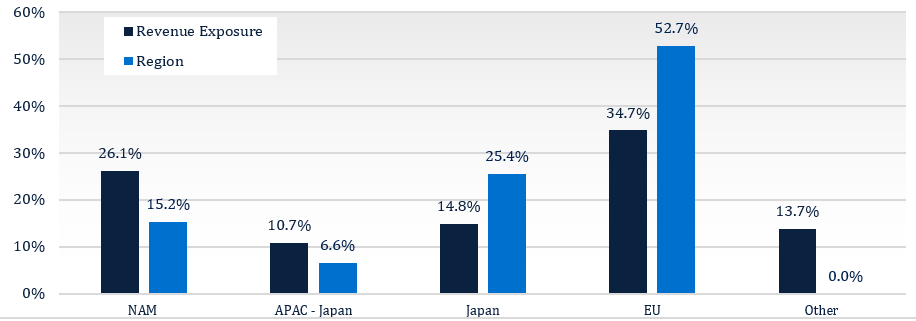
Valuing Resiliency
It’s important that our European businesses are more global in nature, but it is equally important that they have flexible business models that can withstand macro shocks. Because we don’t forecast macroeconomic conditions, it’s critical we own resilient businesses; if we can’t predict the macro, we must own businesses that can quickly adapt to changing economic scenarios.
As a result, we favor variable cost and low capital-intensity businesses. Of our exposure to European-listed businesses, 70% of it is in consumer or business services. Even when times are tough, these businesses can adjust. In the financial crisis and during 2020, the earnings for our European businesses (in the current portfolio) fell significantly less than those of the market, as you can see below.
Lyrical European Companies Resilient in the Worst of Times
Source: FactSet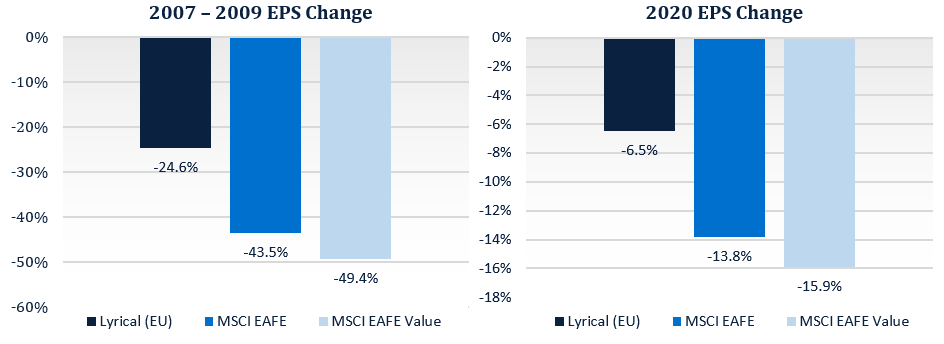
Source: Factset
Owning Companies that Grow in Any Macro, Including Euronext
For example, in 2022 we purchased Euronext (OTCPK:EUXTF), a market exchange business that operates seven local country exchanges across Europe, including the Paris Stock Exchange and the Borsa Italiana in Italy. In the chart below, we show the stock price, EPS, and forward P/E for Euronext since the company was spun off from the Intercontinental Exchange (ICE) in 2014. As shown, in the middle of the chart, the company has compounded EPS at a 19% annualized rate. In spite of this impressive growth, we were able to acquire the shares for only 12x P/E, one of the lowest valuations ever for the business and 50% cheaper than market exchange peers that have grown at a slower rate on average.
Euronext: Cheapest Global Exchange despite Industry-Leading EPS Growth
Source: Factset.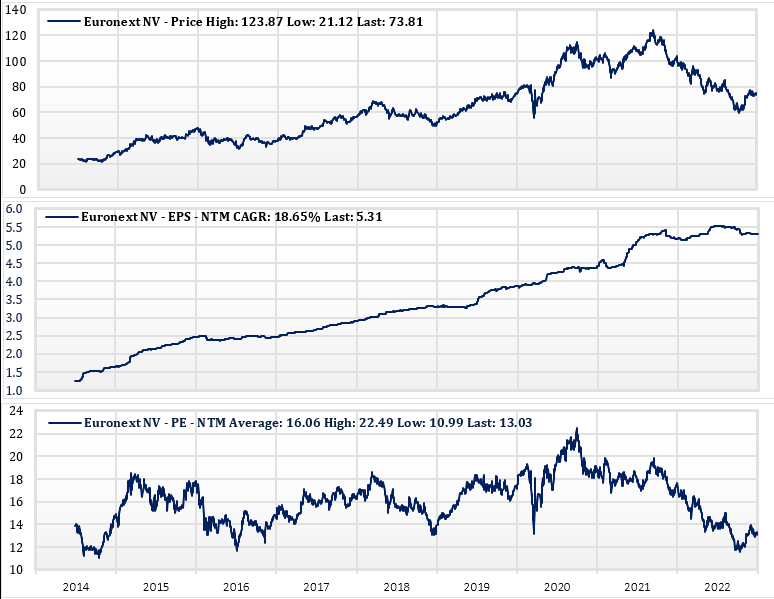
| A list of all recommendations is available upon request. |
Exchanges are classic network effects businesses and they are resilient. The exchange that connects the most buyers and sellers of any asset allows for the most accurate pricing, which drives more buyers and sellers to its platform. In Europe, Euronext is the scale exchange. By combining seven local markets into one trading platform, the company has created the deepest liquidity pool in Europe, with a market share above 70% across its footprint. This scale advantage for Euronext, combined with a capital-light business model, drives its operating margin above 50%. The business is highly defensive, as about 60% of Euronext’s revenues are recurring, including fees from licensing their index data for ETFs and fees for providing unique European government bond data. The remaining 40% of revenues are driven by trading, which is countercyclical. During periods of crisis, people tend to trade more. We saw this during COVID when revenues rose 30% in 2020.
Beyond being defensive, Euronext is also a business that has grown faster than its underlying GDP. Since we don’t forecast GDP for any region, we also seek businesses that can secularly grow. In fact, if you look at our European companies in aggregate, they have organically expanded their topline two percentage points above their local GDP over the past five years.
Over the past five years, Euronext has grown organic revenues around 6% per year, more than three percentage points better than the European economy. As Euronext continues to add services and data offerings and as it continues to consolidate the fragmented European exchange market, we expect organic growth to continue, even if Europe were to enter a prolonged recessionary period. This growth in sales comes with a limited need to grow its relatively small, fixed cost base. As such, we expect the company to continue growing EPS at a double-digit rate for years to come.
PUTTING IT TOGETHER: COMPOUNDERS IN THE BARGAIN BIN
We’ve put together a portfolio of companies in Europe that we think can succeed no matter what the macro brings, and yet they only trade for 10x earnings. Part of our confidence in their success comes from the fact that they’ve already delivered 7% earnings growth since 2007, during a period when Europe has had more than its fair share of crises.
Our broad portfolio has similarly attractive characteristics, with a forward P/E of 9.5x and 6.8% EPS growth since 2007, as shown below. And while these stocks are cheap on forward P/E, that only tells part of the story. With their exceptional growth rates, we see our portfolio trading at an average of 5x five-year forward earnings, compared with the long-term average multiple for an international company of about 9x. We therefore think these stocks have about 75% upside to intrinsic value.
Uncommon Combination of Value and Growth
Source: Factset. 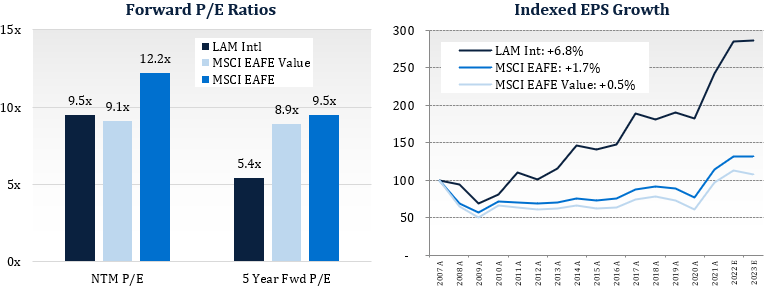
Looking Forward
We anticipate strong returns on an absolute and relative basis from here. The MSCI EAFE trades for about a 75% premium to our portfolio which is similar to the upside to intrinsic value we already mentioned.
It’s no secret that investors are cautious towards international markets right now, particularly Europe. For us, that’s a positive as we’re able to sort through the cheap end of our universe to find good businesses at bargain prices. Over time the fundamentals should shine through. And, if we get the earnings right, we’ll get the stocks right.
We’ve done well so far and we’re eager to continue harvesting the gains from the seeds we’ve planted.
We thank you for your confidence, and, as always, we welcome your inquiries.
John Mullins & Dan Kaskawits, Co-Portfolio Managers
|
THIS IS NOT AN OFFERING OR THE SOLICITATION OF AN OFFER TO INVEST IN THE STRATEGY PRESENTED. ANY SUCH OFFERING CAN ONLY BE MADE FOLLOWING A ONE-ON-ONE PRESENTATION, AND ONLY TO QUALIFIED INVESTORS IN THOSE JURISDICTIONS WHERE PERMITTED BY LAW. THERE IS NO GUARANTEE THAT THE INVESTMENT OBJECTIVE OF THE STRATEGY WILL BE ACHIEVED. RISKS OF AN INVESTMENT IN THIS STRATEGY INCLUDE, BUT ARE NOT LIMITED TO, THE RISKS OF INVESTING IN EQUITY SECURITIES GENERALLY, AND IN A VALUE INVESTING APPROACH, MORE SPECIFICALLY. MOREOVER, PAST PERFORMANCE SHOULD NOT BE CONSTRUED AS AN INDICATOR OF FUTURE PERFORMANCE. THE S&P 500 INDEX IS A MARKET CAPITALIZATION WEIGHTED INDEX COMPRISED OF 500 WIDELY-HELD COMMON STOCKS. THE RUSSELL 1000 VALUE INDEX MEASURES THE PERFORMANCE OF THE LARGE-CAP VALUE SEGMENT OF THE U.S. EQUITY UNIVERSE. IT INCLUDES THOSE RUSSELL 1000 COMPANIES WITH LOWER PRICE-TO-BOOK RATIOS AND LOWER EXPECTED GROWTH VALUES. THE RUSSELL 1000 VALUE INDEX IS CONSTRUCTED TO PROVIDE A COMPREHENSIVE AND UNBIASED BAROMETER FOR THE LARGE-CAP VALUE SEGMENT. THE INDEX IS COMPLETELY RECONSTITUTED ANNUALLY TO ENSURE NEW AND GROWING EQUITIES ARE INCLUDED AND THAT THE REPRESENTED COMPANIES CONTINUE TO REFLECT VALUE CHARACTERISTICS. ADDITIONAL INFORMATION REGARDING LAM –U.S. VALUE EQUITY-CS: PERFORMANCE FIGURES PRIOR TO AUGUST 2013 REFLECT THE MODEL, HYPOTHETICAL RESULTS FOR A HYPOTHETICAL PORTFOLIO PURSUING THE MARKET CAPITALIZATION WEIGHTED INVESTMENT GUIDELINES (THE “GUIDELINES”) DESCRIBED BELOW, AND DO NOT REPRESENT RETURNS OF ACTUAL INVESTMENTS MADE. THERE ARE A VARIETY OF LIMITATIONS INHERENT IN MODEL RESULTS. TRANSACTION EXPENSES HAVE BEEN INCLUDED AT FIVE CENTS PER SHARE, TO REFLECT COMMISSIONS AND EXPECTED MARKET IMPACT. DIVIDENDS HAVE BEEN INCLUDED IN THE RETURNS. LAM’S CLIENTS HAD RESULTS THAT WERE MATERIALLY DIFFERENT FROM THOSE PORTRAYED IN THE MODEL. MARKET CAPITALIZATION WEIGHTED INVESTMENT GUIDELINES LAM’S ORIGINAL, U.S. VALUE EQUITY – EQ IS AN APPROXIMATELY 34 STOCK PORTFOLIO THAT IS EQUAL WEIGHTED AT COST TO TARGET 99% INVESTED WITH 1% CASH, HENCE APPROXIMATELY 3% PER POSITION. WE HAVE PICKED A BENCHMARK CAPITALIZATION LEVEL (THE “CAPITALIZATION BENCHMARK”) EQUAL TO $11.2BN AS OF DECEMBER 31, 2013 AND EQUAL TO $11.2BN MULTIPLIED BY THE QUOTIENT DERIVED BY DIVIDING THE LEVEL OF THE S&P 500 INDEX® AT ALL OTHER TIMES BY 1,848.36 (THE CLOSING PRICE OF THAT INDEX ON DECEMBER 31, 2013). TO REFLECT A PORTFOLIO THAT HAS GREATER LIQUIDITY, WE CREATED A MODEL PORTFOLIO WITH MODIFIED PORTFOLIO POSITION WEIGHTS.
FOR EXAMPLE, A STOCK WITH A $5.6BN MARKET CAPITALIZATION AS OF DECEMBER 31, 2013 WOULD HAVE BEEN GIVEN AN INITIAL PORTFOLIO WEIGHT OF 0.5X A FULL POSITION. A STOCK WITH A $3.4BN MARKET CAPITALIZATION AS OF DECEMBER 31, 2013 WOULD HAVE BEEN GIVEN AN INITIAL PORTFOLIO WEIGHT OF 0.3X A FULL POSITION. WITH LESS CAPITAL ALLOCATED TO THE LESS LIQUID STOCKS, WE HAVE GROSSED UP THE SIZE OF A FULL POSITION FROM THE CURRENT 2.9% IN THE EQUAL WEIGHTED ORIGINAL PORTFOLIO TO APPROXIMATELY 3.8% IN THE HYPOTHETICAL MARKET CAPITALIZATION WEIGHTED PORTFOLIO, TO ACHIEVE A MODEL PORTFOLIO WITH 99% INVESTED IN STOCKS AND 1% CASH. PERFORMANCE ESTIMATION METHODOLOGY TO ESTIMATE THE HISTORICAL PERFORMANCE OF THE U.S. VALUE EQUITY–CS, MARKET CAPITALIZATION WEIGHTED PORTFOLIO, WE APPLIED THE METHODOLOGY DESCRIBED ABOVE TO THE STOCKS IN OUR ORIGINAL U.S. VALUE EQUITY-EQ PORTFOLIO OF DECEMBER 31, 2008. WE MODELED THAT ALL PURCHASES OF NEW HOLDINGS AND EXITS FROM EXISTING HOLDINGS THAT TOOK PLACE DURING A MONTH IN OUR ACTUAL PORTFOLIOS TOOK PLACE AS OF THE END OF THAT MONTH IN THE BACKTEST MODEL. IN MONTHS WHERE CASH WAS NEEDED BECAUSE THE SIZE OF THE PURCHASED STOCK EXCEEDED THE PROCEEDS FROM THE STOCK SOLD, WE MODELED THAT WE TRIMMED THE LARGEST POSITION (AT MARKET) IN THE PORTFOLIO TO GENERATE ENOUGH CASH TO COVER THE DIFFERENCE. IN MONTHS WHERE THE CASH POSITION ROSE TO LEVELS ABOVE 1% WE DID NOT REINVEST THE EXTRA CASH. THESE MODEL RESULTS ARE UNAUDITED AND SUBJECT TO REVISION AND SHOW ALL PERIODS BEGINNING WITH THE FIRST FULL MONTH IN WHICH THE ADVISOR MANAGED ITS FIRST FEE-PAYING ACCOUNT. HYPOTHETICAL NET RETURNS INCLUDE A 1.25% BASE FEE. |
Editor’s Note: The summary bullets for this article were chosen by Seeking Alpha editors.
Editor’s Note: This article discusses one or more securities that do not trade on a major U.S. exchange. Please be aware of the risks associated with these stocks.
Be the first to comment