

slovegrove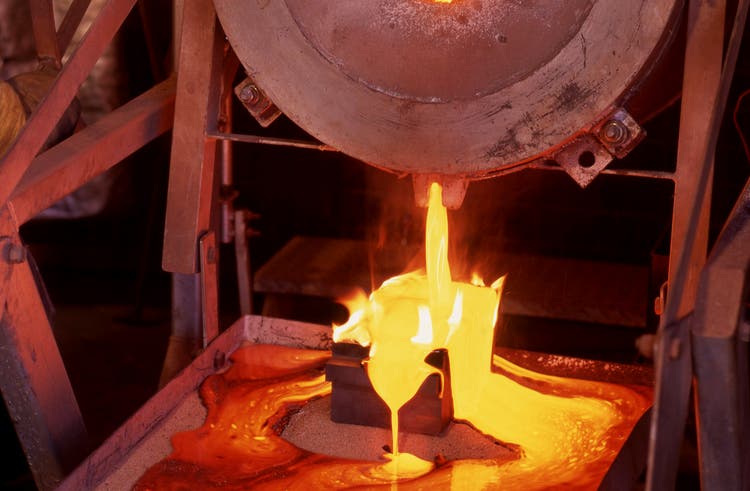
While many mid-tier and intermediate producers have struggled to deliver into their initial guidance this year, one clear exception has been Lundin Gold (OTCQX:LUGDF), which continues to fire on all cylinders. Not only is Lundin tracking miles ahead of its initial guidance mid-point (425,000 ounces), but it’s looking like it could beat the top end of its updated guidance range, producing over 355,000 ounces year-to-date. So, with its two-year average forward AISC set to remain below $850/oz and considerable drilling results to look forward to near-mine and regionally over the next year, I would view any pullbacks below US$6.35 as buying opportunities.
Fruta Del Norte Operations (Company Presentation)
Q3 Results
Lundin Gold released its preliminary Q3 results this month, reporting quarterly production of ~121,600 ounces of gold, a 13% increase from the year-ago period. This sharp increase in production was driven by higher throughput (~379,300 tonnes processed), higher grades (11.0 grams per tonne gold), and a 150 basis point improvement in recoveries. The increase in recovery rates was discussed in the Q1 2021 Conference Call, with hopes to get this figure above 90.0% for the remainder of the year. While the company didn’t manage to hit the 90.0% level in Q2, it came in well above this figure in Q3 (90.3%).
Lundin Gold – Quarterly Production & Costs (Company Filings, Author’s Chart)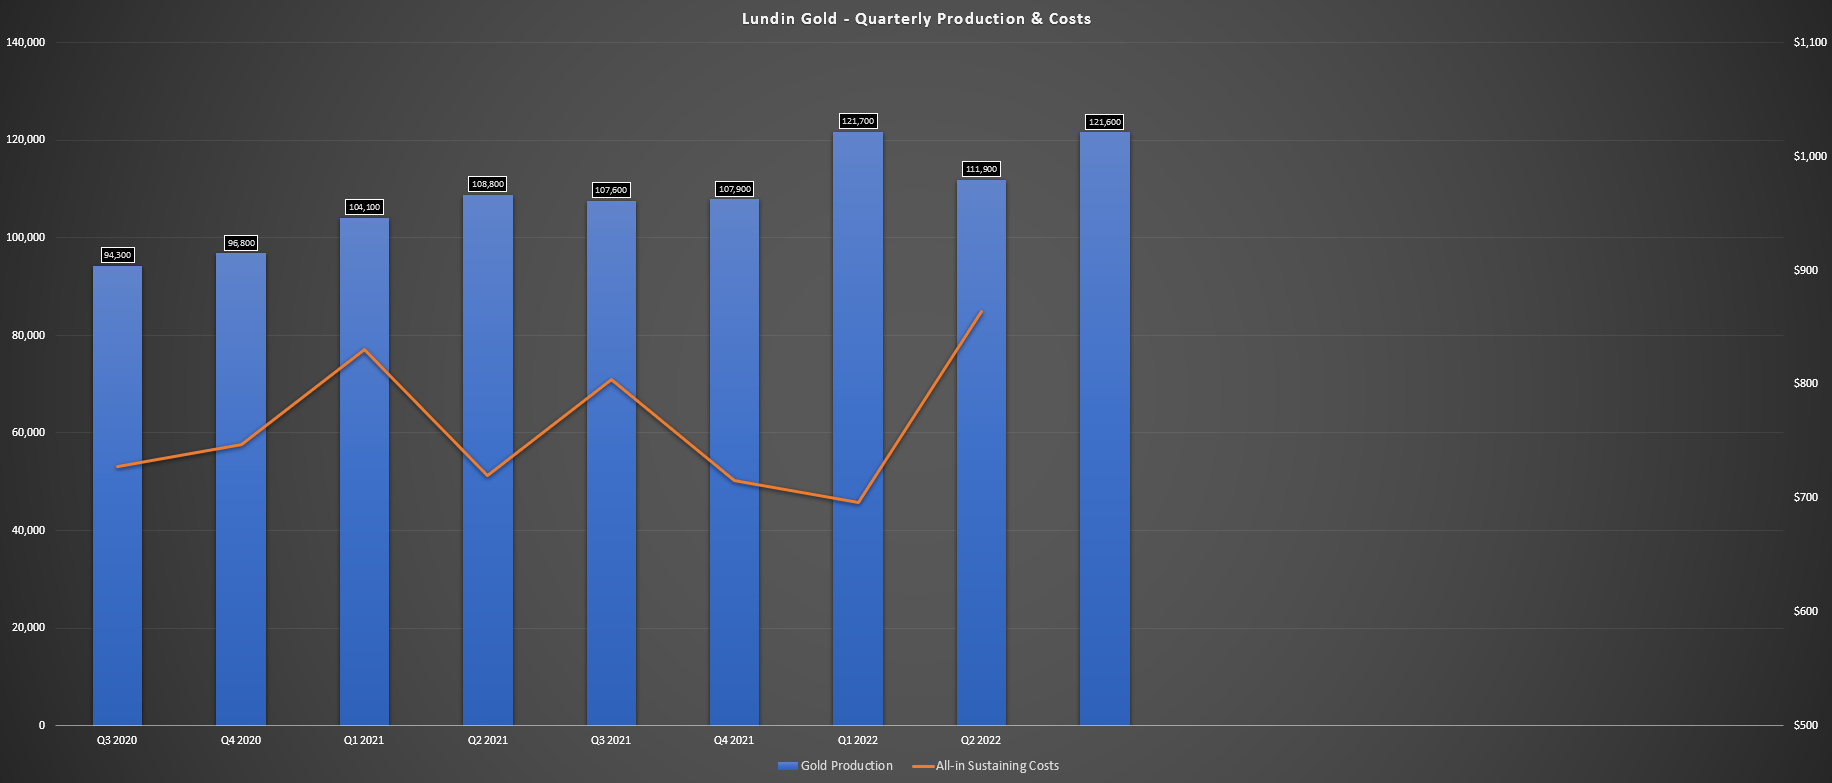
In terms of sales, Lundin sold 20% more gold year-over-year due to selling ounces meant to be sold in Q2 but were delayed due to the Ecuadorian national strike. This should boost revenue and partially offset the lower gold price on a year-over-year basis, with the average realized gold price looking like it will come in below $1,740/oz in Q3 2022 vs. $1,769/oz in the year-ago period. So, while most producers will see declining revenue on a year-over-year basis, Lundin Gold should have no problem bucking this trend due to the benefit of deferred ounce sales and another strong quarter of production in Q3 2022.
Lundin Gold – Quarterly Operating Metrics (Company Filings, Author’s Chart)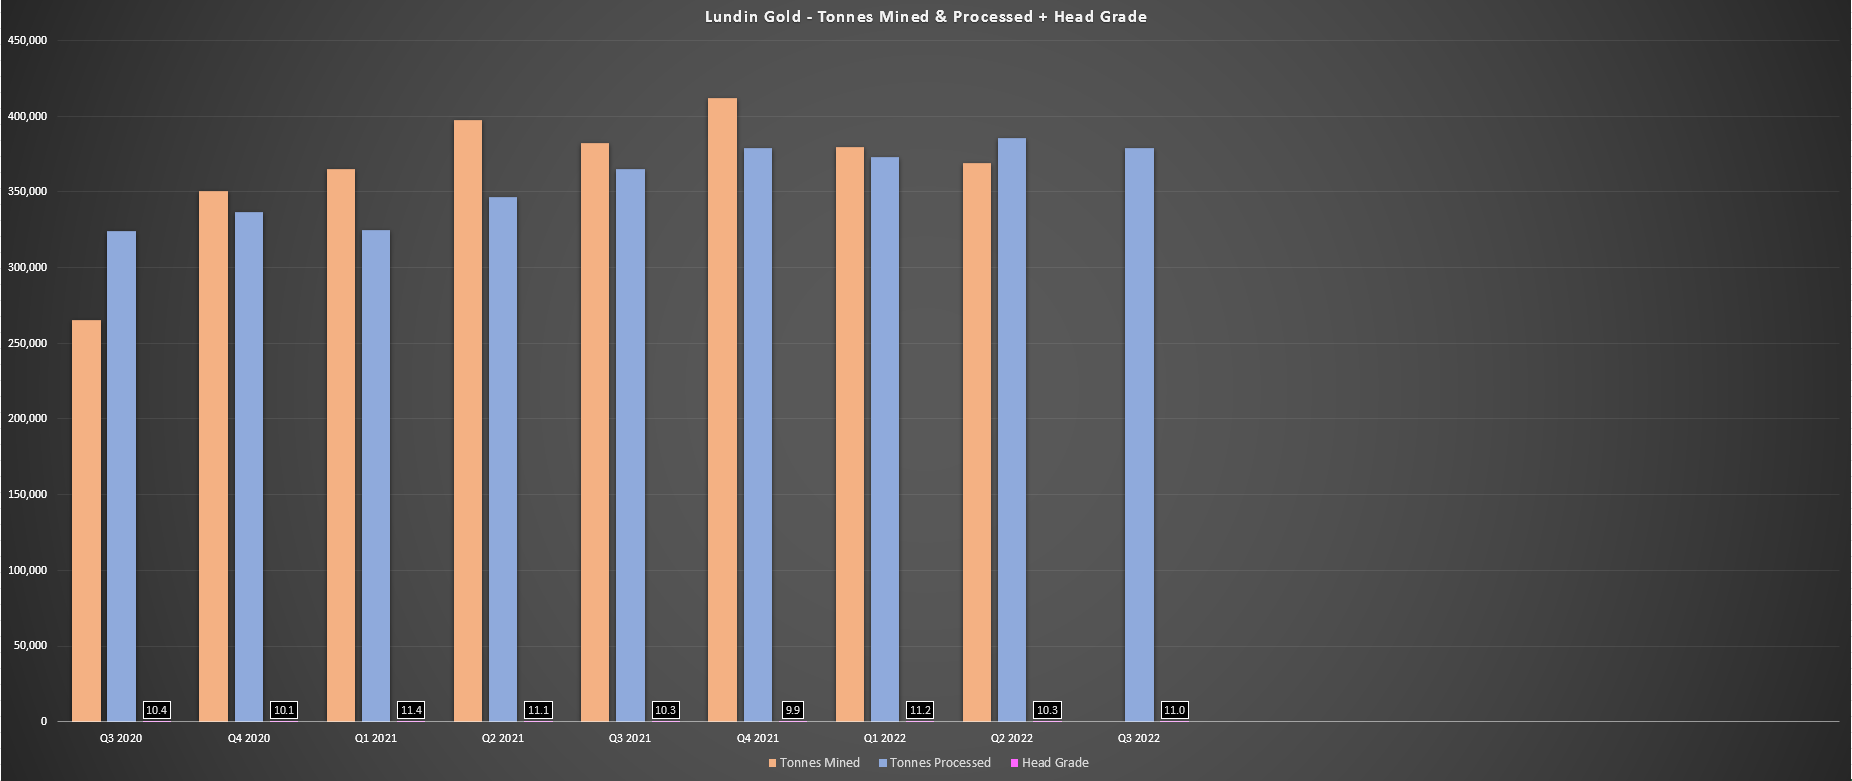
Moving over to quarterly operating metrics, we can see that throughput was up nearly 4% year-over-year, and grades jumped by 7%, increasing from 10.3 grams per tonne of gold to 11.0 grams per tonne of gold. This solid performance placed Lundin in a position to potentially beat the top end of its already upwardly revised FY2022 guidance, which sits at 430,000 to 460,000 ounces. The potential for a beat is based on year-to-date production sitting at ~355,000 ounces, meaning the company will only need 106,000 ounces to beat its 106,000 ounces in Q4 to clear the top end of guidance. This is a big deal in a year when many producers have had challenges and are delivering at the low end of guidance.
Finally, from a cost standpoint, Lundin’s outperformance from a production standpoint vs. previous estimates should help the company to be one of the few producers to enjoy sub $825/oz all-in-sustaining costs this year. While this figure is up from last year’s levels ($762/oz) due to higher sustaining capital and some inflationary pressures (albeit much lower than peers), Lundin should see limited margin compression relative to its peer group, even with the weaker gold price. Just as importantly, costs are expected to remain below $850/oz on a two-year forward basis, benefiting from lower sustaining capital with the key projects now nearing completion (south vent raise, third tailings dam raise).
Gold Price
Unfortunately, while Lundin Gold has been knocking it out of the park from an operational standpoint, this has been largely overshadowed by the falling gold price, crushing sentiment in the sector. As shown below, the gold price has continued its slide in Q4, and it looks like it will average below $1,720/oz in Q4 2022, a sharp decline from the year-ago period ($1,795/oz). This weakness in the gold price is pressuring margins for gold producers, and this certainly explains some of the softness in the GDX, even if the selling looks overdone. However, it’s important to note that while this affects sentiment, which has kept a lid on Lundin, it has been shielded from inflation (minimal wage inflation, stable energy costs at $0.07 kWh), and the benefit of operating a relatively low-volume high-grade operation from a fuel standpoint.
Gold Futures Price (TC2000.com)
The good news for gold is that while it has had a rough few months and has dipped below the psychological $1,700/oz level, the backdrop remains as favorable as ever. Although there’s been considerable focus on higher rates making gold less attractive, we can see below that real rates remain deeply in negative territory (measured by the 3-month treasury bill rate vs. CPI), even if we have seen some mean reversion. Gold typically performs its best during periods of negative real rates, but the correlation is not immediate; the returns can be very lumpy like we saw in the 1970s. So, while it’s easy to be caught up in the noise, investors should be careful not to miss the forest for the trees.
Negative Real Rates (YCharts.com, Author’s Chart)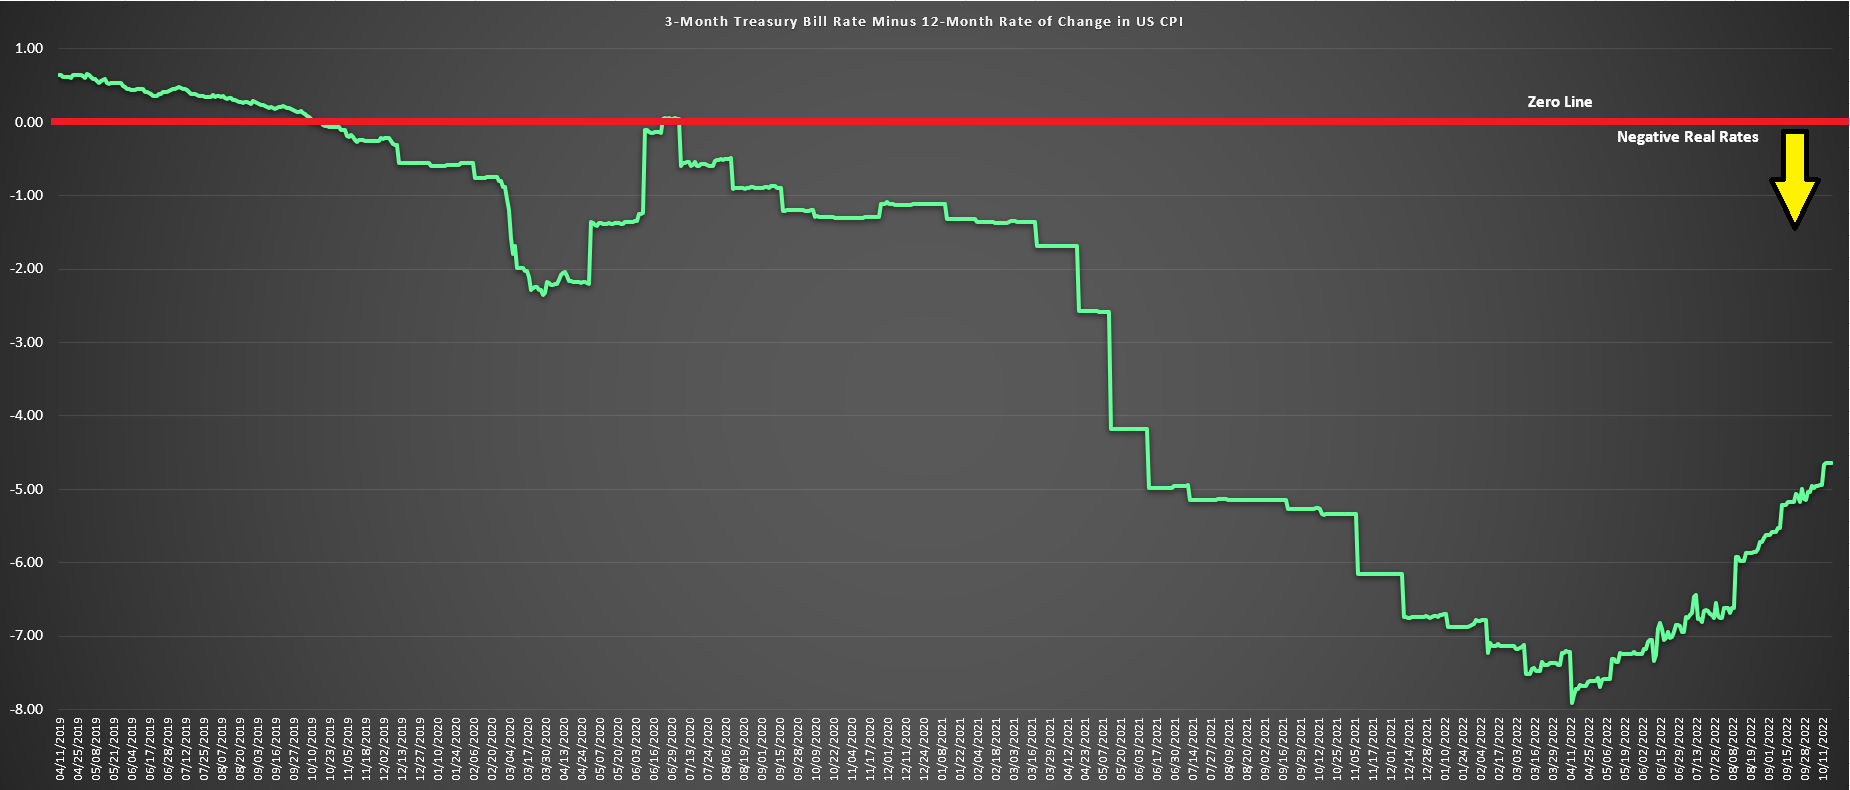
Finally, gold has performed its best on a forward 6-month basis when sentiment has shifted to levels of extreme pessimism, as shown by the chart below of Daily Sentiment Index Data. As we can see, gold dropped to persistent levels of extreme pessimism in August 2018, March 2021, and August 2021 and is back to these levels currently. All of these instances led to imminent bottoms and ~13% plus draw-ups over the following six months. Past performance and signals do not guarantee future returns or performance, but if we were to see something similar play out, gold could easily stage a rally to $1,830/oz by April of next year from its recent low of $1,620/oz.
Gold Bullish Sentiment (0-100% Bulls) – Daily Sentiment Index Data (Daily Sentiment Index Data, www.trade-futures.com, Author’s Chart)
To summarize, I don’t see any reason to panic here or significantly underweight gold miners, which some analysts suggest. I suppose these same analysts would prefer to buy when gold stocks look their best and are breaking out to new highs, but this is exactly the time to be thinking of selling. Let’s dig into Lundin Gold’s valuation to see whether it’s an attractive buy-the-dip candidate:
Valuation & Technical Picture
Lundin Gold currently trades at a market cap of ~$1.70 billion, which is a relatively steep figure for a single-asset producer in a non-Tier-1 jurisdiction. However, this is clearly not just any single-asset producer, and Fruta Del Norte is anything but an average ore body. In fact, Lundin is one of the few companies continuously beating estimates and owns one of the highest-grade ore bodies globally. Hence, I believe a premium valuation is warranted. The only issue I see is that due to Lundin’s outperformance vs. its peer group with a nearly flat year-to-date return, its relative value ranking has shrunk considerably, given that many of its peers have seen their share prices fall over 20% year-to-date.
P/NAV Multiples Sector-Wide Vs. Lundin Gold (Alamos Gold Presentation, Author’s Drawing for LUG)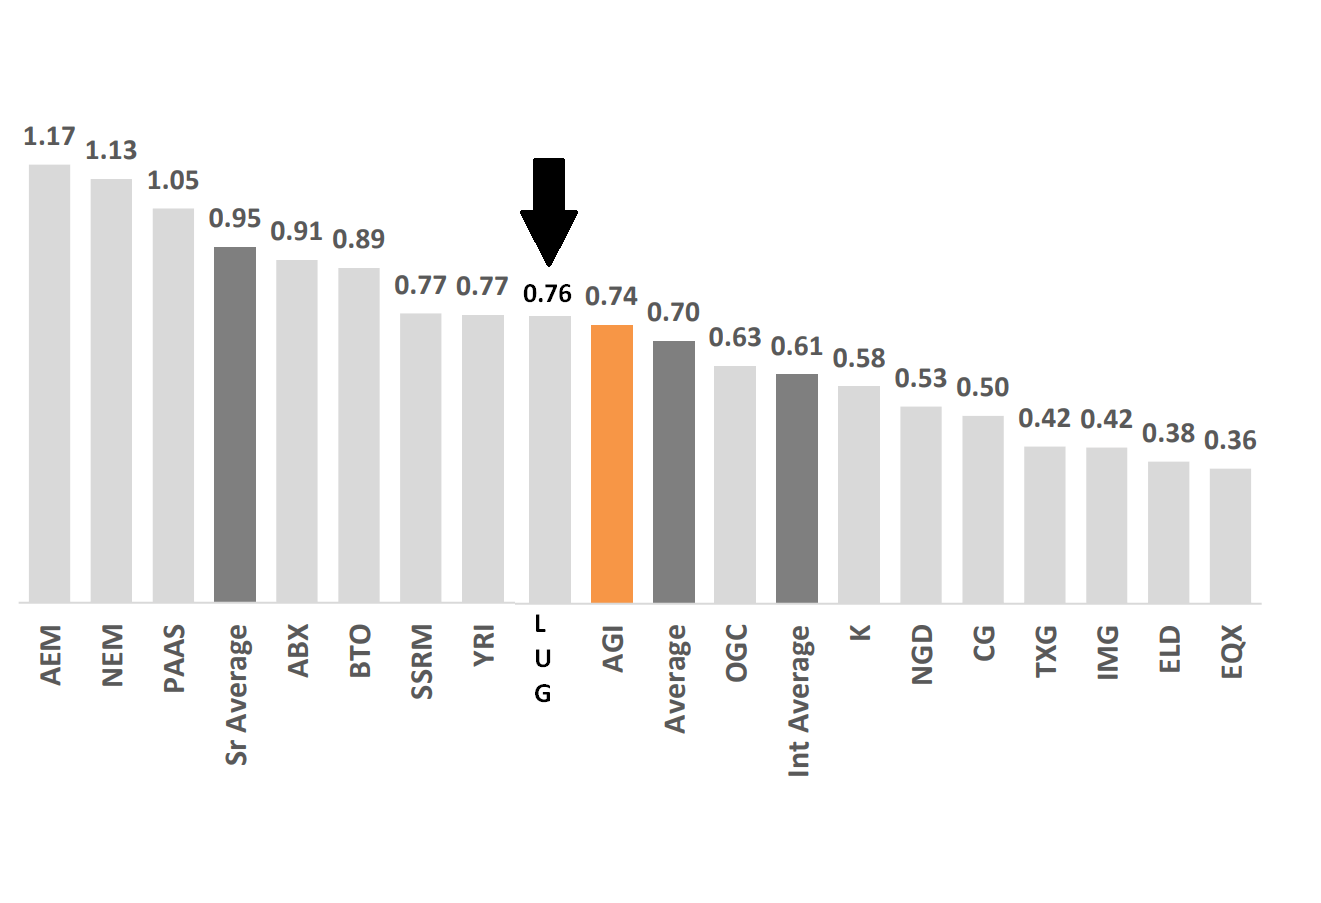
For example, while Barrick Gold (GOLD) may not be the lowest-cost producer, it is the world’s 2nd largest producer and benefits from industry-leading diversification, exposure to copper, and multiple Tier-1 mines. At its current valuation, Barrick can be bought for only a ~20% higher P/NAV multiple, with it trading at less than 0.95x P/NAV vs. Lundin Gold at 0.76 P/NAV. This doesn’t mean that Lundin Gold can’t trade higher, but given that single-asset producers carry high risk, I think better deals can be found elsewhere in the sector from a reward/risk standpoint. That being said, I see a fair value for Lundin Gold of US$10.50 (1.10x P/NAV multiple on estimated ~$2.24 billion net asset value), suggesting the stock still has a considerable upside to fair value (45%).
Moving to the technical picture, Lundin appears to have strong support at US$6.15 and no strong resistance until US$7.55 – US$7.75. Using the mid-point of resistance (US$7.65) and support at US$6.15, the stock is currently sitting in the upper portion of its short-term trading range. Generally, I prefer a minimum 5.0 to 1.0 reward/risk ratio to justify entering new positions in small-cap names, and from US$7.25, its reward/risk ratio comes in at just 0.37 to 1.0. So, while I see Lundin Gold as undervalued, it would need to drop below US$6.45 to enter a low-risk buy zone. A pullback of this magnitude may not materialize, but this is where the odds would favor the bulls from both a technical and valuation standpoint.
LUGDF – Daily Chart (TC2000.com)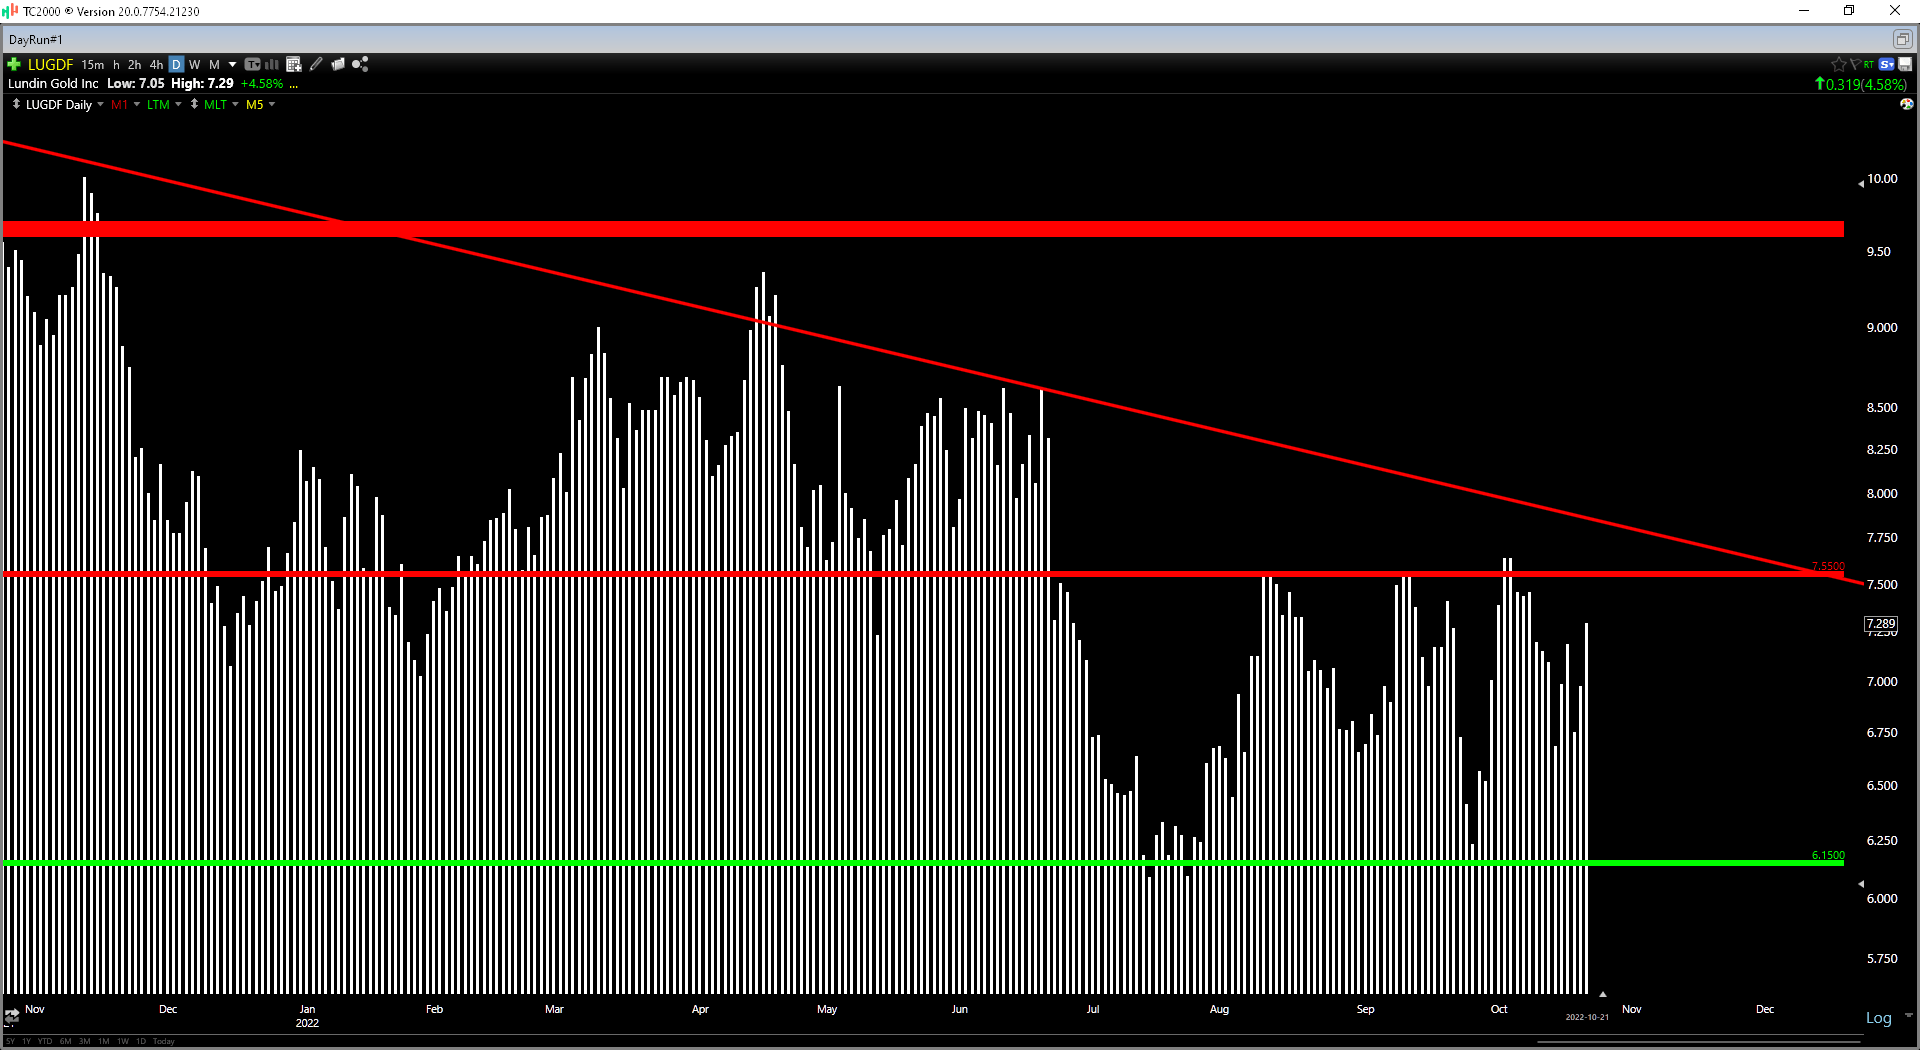
Summary
Lundin Gold had another phenomenal quarter and is one of only a few names to raise guidance in the sector. With multiple potential catalysts ahead, including new drill results from near-mine and regional targets and more detail into a potential expansion to 4,500+ tonnes per day, I see Lundin as a solid buy-the-dip candidate. However, the ideal buy zone looks to be at US$6.45 or lower for starting new positions.
Be the first to comment