

DarrelCamden-Smith
It’s been a tough year thus far for the Gold Miners Index (GDX), with several producers missing their initial guidance and a clear theme of margin compression due to rising labor/energy costs combined with a softer gold price. However, one mid-cap producer has stood head and shoulders above the rest, not only beating initial guidance but it being on track to beat already raised guidance. This company is Lundin Gold (OTCQX:LUGDF), and it has been nothing short of a free cash flow machine year-to-date, generating ~$180 million year-to-date with one quarter left to go.
To put this in perspective, this is more cash than Kinross (KGC) has generated year-to-date, which speaks to not only the benefit of operating in a country with limited inflationary pressures but also the robustness of Lundin’s Fruta Del Norte orebody. Incredibly, this ore body looks like it will continue to grow, with Lundin reporting some of the best intercepts sector-wide in Q4, with a highlight hole of 163.2 meters of 10.76 grams per tonne of gold, an intercept matched by few other than the last company that drilled this property, Aurelian Resources over a decade ago. That said, there is no investing without valuation, and Lundin is now starting to look fully valued short term.
Q3 Production & Sales
Lundin Gold (“Lundin”) released its Q3 results last month, reporting quarterly production of ~121,600 ounces, a 13% increase from the year-ago period. The increase in output was driven by higher throughput, higher grades, and improved recovery rates (+150 basis points year-over-year). The latter benefited from higher feed grades and improved blending strategies to reduce the impact of oxidized ore. The result is that Lundin has produced ~355,200 ounces of gold year-to-date, representing ~79.8% of its already upgraded FY2022 guidance (445,000 ounces at the mid-point vs. 425,000 ounces previously).
Lundin Gold – Quarterly Production & Costs (Company Filings, Author’s Chart)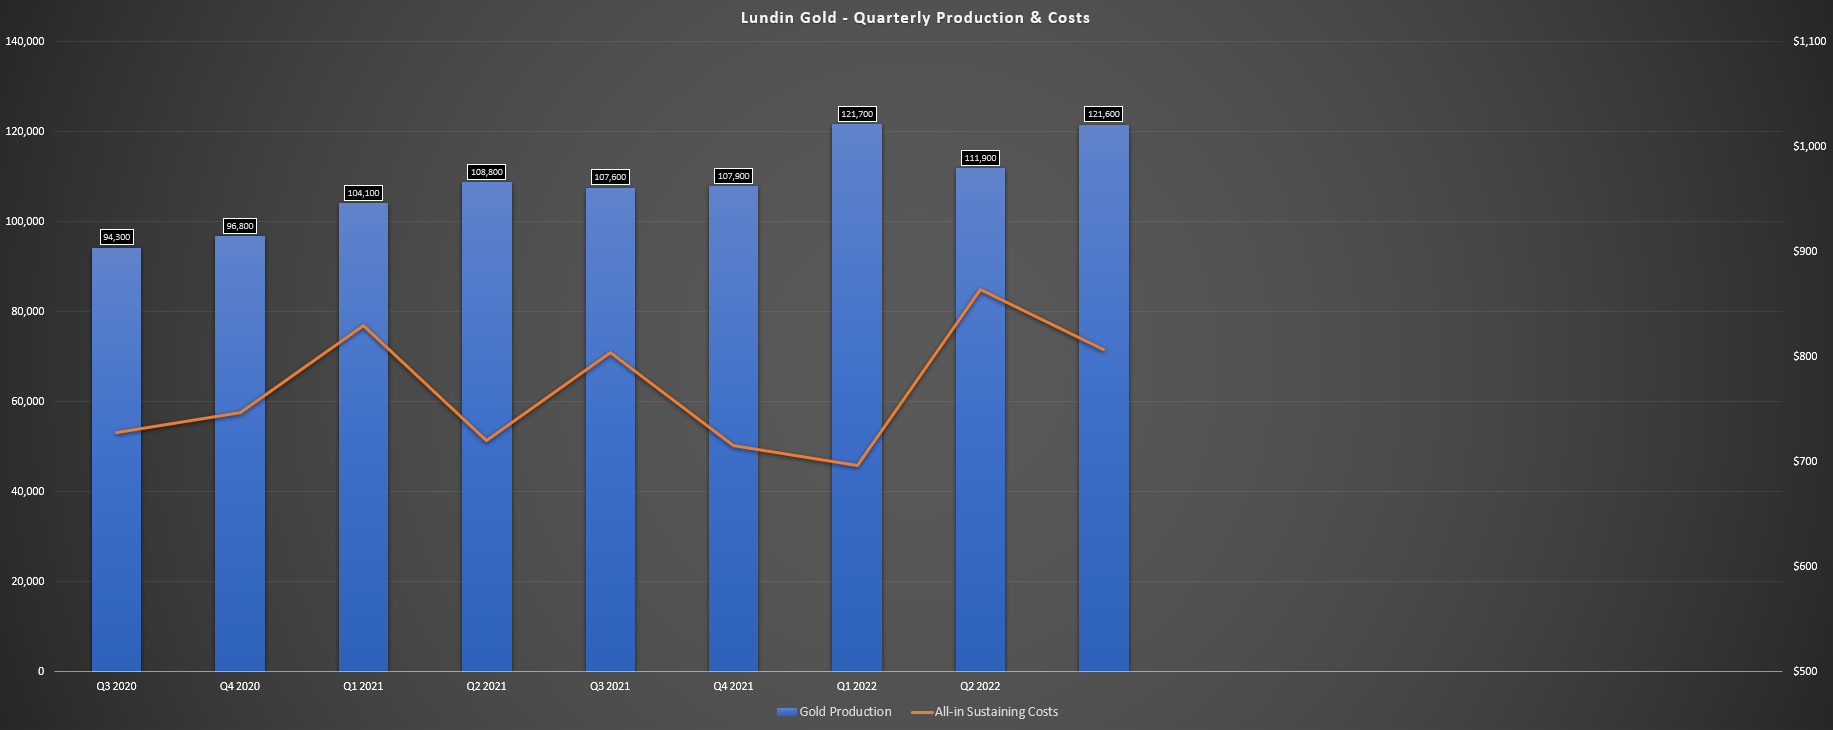
From a sales standpoint, Lundin Gold saw a sharp increase in revenue, reporting Q3 revenue of $210.4 million, a more than 10% increase from the year-ago period. This was a significant deviation from the sector, with most companies seeing lower revenue year-over-year. Fortunately for Lundin, the company benefited from higher production despite earlier than planned SAG and ball mill re-lining completed in late September, but also the benefit of selling deferred ounces initially planned for Q2. For those unfamiliar, this was due to the national strike in Ecuador that ended on June 30th and led to the delayed shipment of ~16,000 ounces. The result was that Lundin sold ~134,600 ounces in Q3, up 20% year-over-year.
Unfortunately, this was partially offset by the weaker gold price, with Lundin’s average selling price coming in at $1,618/oz, a 9% decline from Q3 2021. The reason for the weaker gold price than the industry average was due to provisional pricing on concentrate sales (settled after quarter-end). Still, despite the headwind of a weaker gold price that led to many producers posting a cash outflow in the period, Lundin enjoyed another outstanding quarter, reporting operating cash flow of ~$105 million and free cash flow of ~$65 million, with the company ending the quarter with over $300 million in cash despite a generous dividend policy relative to its peers.
Costs & Margins
Moving over to costs and margins, Lundin excelled in this department as well, reporting industry-leading cash costs of $656/oz (Q3 2021: $650/oz) and all-in sustaining costs [AISC] of $807/oz, which was more than 35% below the estimated FY2022 industry average (~$1,290/oz). The company’s lower AISC can be attributed to the benefit of higher sales in the period due to deferred ounces in Q2 and the fact that Ecuador is seeing much less inflation than other countries. As noted by the company, wage inflation is minimal, and energy costs are stable, with it benefiting from hydropower at Fruta Del Norte.
Lundin Gold – Gold Price, AISC, AISC Margins (Company Filings, Author’s Chart)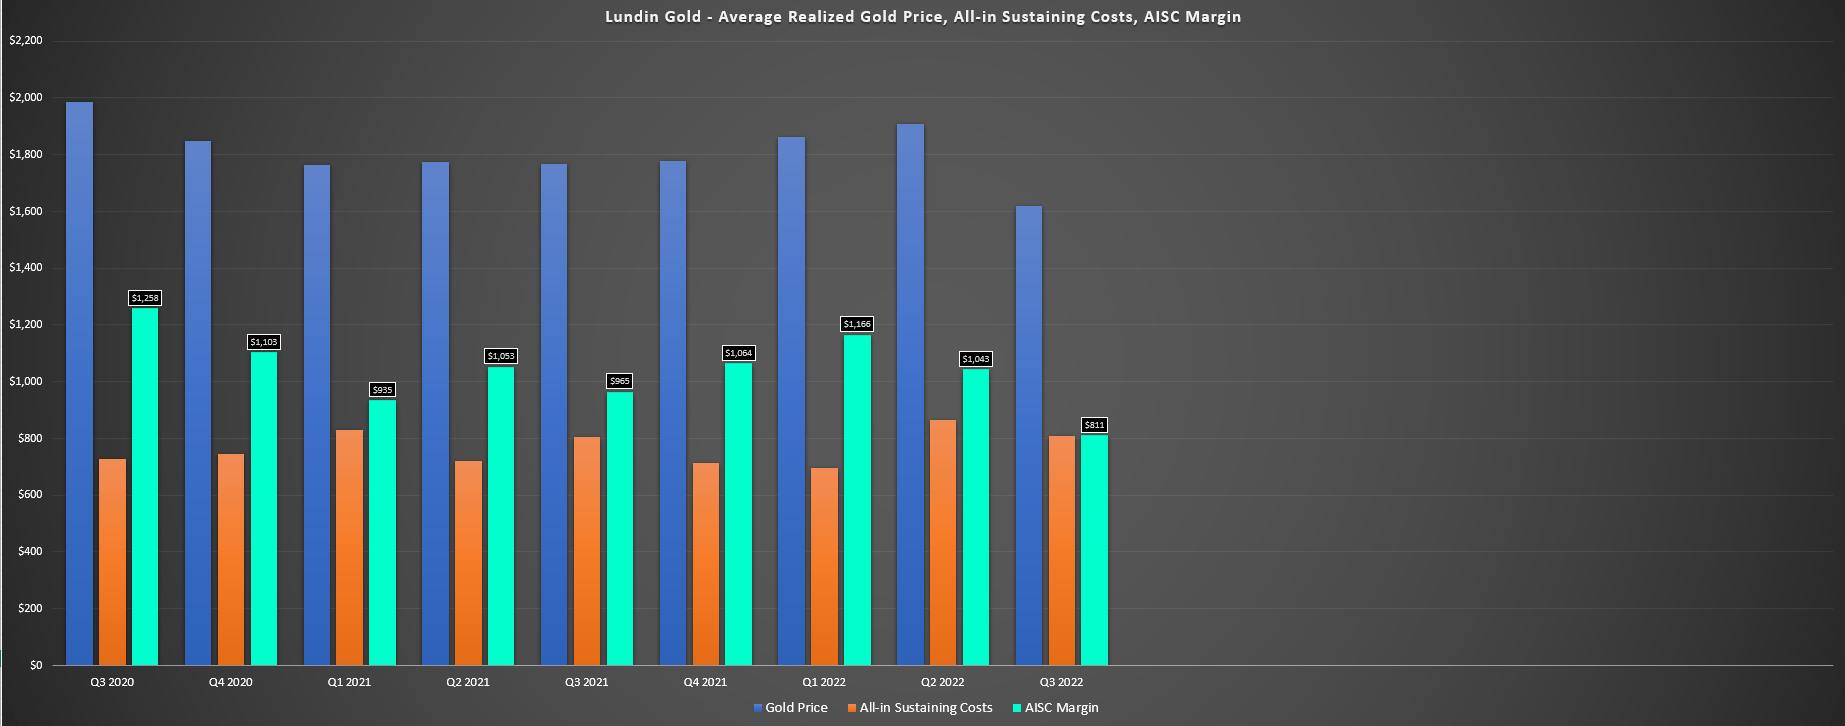
Looking at the chart above, we can see that Lundin did see some margin compression on a year-over-year basis, with costs slightly higher ($807/oz vs. $804/oz) and the impact of a much weaker average realized gold price ($1,618/oz vs. $1,769/oz). However, its AISC margins still came in at industry-leading levels of $811/oz despite one of the lowest realized prices sector-wide in Q3 (added impact of provisional pricing on concentrate) among its peer group. On a full-year basis, Lundin Gold is on track to beat its guidance mid-point of $845/oz, making it one of the lowest-cost producers sector-wide next to K92 Mining (OTCQX:KNTNF).
It is worth noting that costs will creep up next year with another year of somewhat elevated sustaining capital, with Lundin guiding for ~450,000 ounces at all-in-sustaining costs of $905/oz at the mid-point. So, while most producers will be enjoying lower costs on a year-over-year basis as we see more relaxed oil prices and potentially some improvement in contractor usage due to reduced labor tightness, Lundin will not see the same benefit. That said, FY2024 and FY2025 are expected to be very strong, with the company guiding for a 2-year average production profile of ~490,000 ounces at sub $850/oz costs.
Recent Developments
In terms of recent development, Lundin has finally completed the much-awaited South Ventilation Raise, which will double ventilation and provide better working conditions, allow for efficiencies, and allow the company to mine from all levels at Fruta Del Norte. This is a positive development, but the real news in the quarter was the release of blockbuster holes from its conversion drilling program at the mine. While the term world-class drill results can be thrown around loosely in some cases, these intercepts are genuinely world-class, and several intercepts came in well above 600 gram meters. A few of the highlight holes are as follows:
- 101.3 meters of 12.57 grams per tonne of gold
- 163.2 meters of 10.76 grams per tonne of gold
- 98.3 meters of 12.67 grams per tonne of gold
- 51.45 meters of 17.93 grams per tonne of gold
Lundin Gold – Drill Results (Company News Release)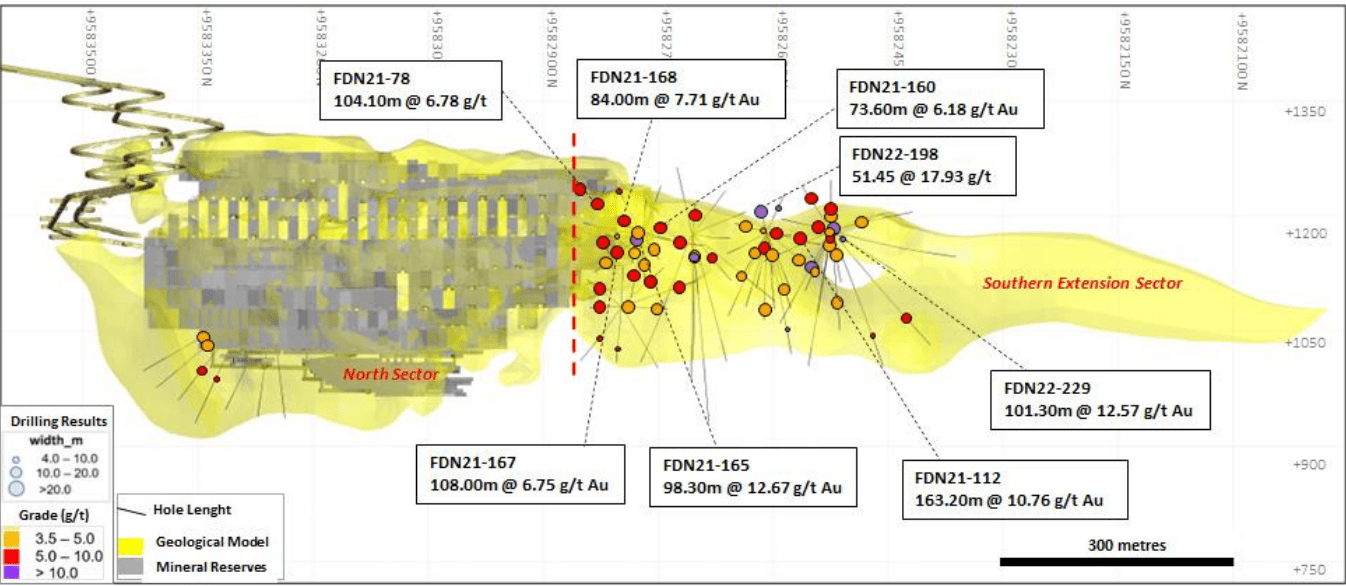
If we compare the intercepts released to the company’s inferred resource of ~11.6 million tonnes at ~5.7 grams per tonne of gold, it is clear that these holes are of superior grades, and most are drilled well outside the current mineral reserve envelope. In fact, Lundin noted in its release that the results have extended the mineralized zone 300 meters from the current mineral reserve boundary (shaded in grey) and that the deposit remains open at depth in both the North and South sectors. A few of the deeper intercepts released were as follows:
- 16.45 meters of 6.01 grams per tonne of gold (North Sector)
- 8.5 meters of 8.72 grams per tonne of gold (North Sector)
- 9.0 meters of 6.51 grams per tonne of gold (South Sector)
- 11.0 meters at 17.22 grams per tonne of gold (South Sector)
While it’s early to put a number on just how significant these step-outs are, these results bode very well for resource conversion to reserves and future resource growth and suggest that Aurelian and Kinross may have only scratched the surface in their previous drilling at Fruta Del Norte.
Lundin Gold – Regional Targets (Company Website)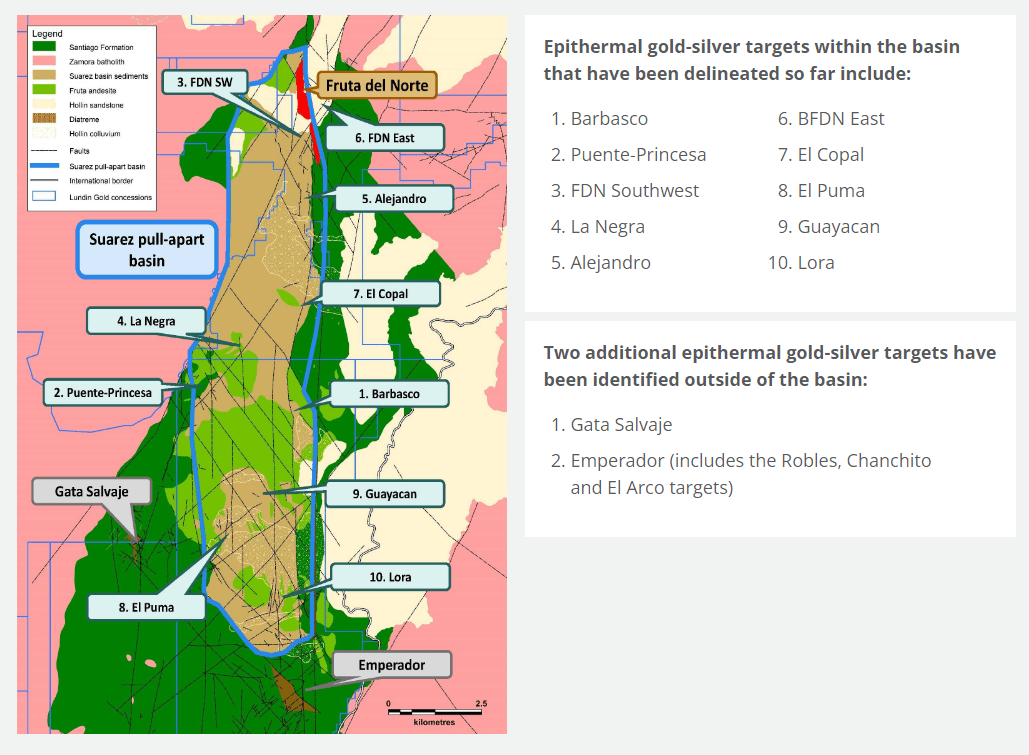
So, with regional drilling ongoing that could uncover another monster deposit on Lundin’s vast land package (38 square-kilometer Suarez Basin is the current focus) and near-mine drilling delivering some of the best intercepts reported sector-wide in line with mines like Brucejack, Island, Kibali, Havierson, Fosterville, and Carlin/Cortez, this is truly a unique asset, and it is one that a major gold producer might eventually go after given that ore bodies of this caliber are so rare. Let’s take a look at the valuation and technical picture to see if the stock has more upside following these results:
Valuation & Technical Picture
Based on ~240 million fully-diluted shares and a share price of US$10.70, Lundin trades at a market cap of ~$2.57 billion, making it the most richly valued single-asset producer in the market. This might seem like an insane valuation for a single-asset company in a non-top-5 mining jurisdiction. However, Lundin has an asset with a Tier-1 scale and is mining arguably one of the most impressive discoveries of the 21st century. Plus, with grades like those present at Fruta Del Norte (~10 grams per tonne of gold), ounces can quickly add up in the case of new discoveries either regionally or outside of existing reserves, potentially providing a significant lift to NPV (5%).
That said, the stock is currently trading at ~1.12x P/NAV based on its current market cap vs. an estimated net asset value of ~$2.29 million, which already incorporates $400 million in exploration upside. This places it at a similar multiple to Agnico Eagle (AEM), a diversified producer with ten mines in Tier-1 jurisdictions that also enjoys industry-leading margins. So, while Lundin is firing on all cylinders and benefiting from limited inflationary pressures in Ecuador, I don’t see any margin of safety here. Even if we were to apply a premium multiple of 1.15x P/NAV, which is high for a single-asset producer, Lundin looks fully valued at $10.70 vs. a fair value of US$10.50.
LUGDF Daily Chart (TC2000.com)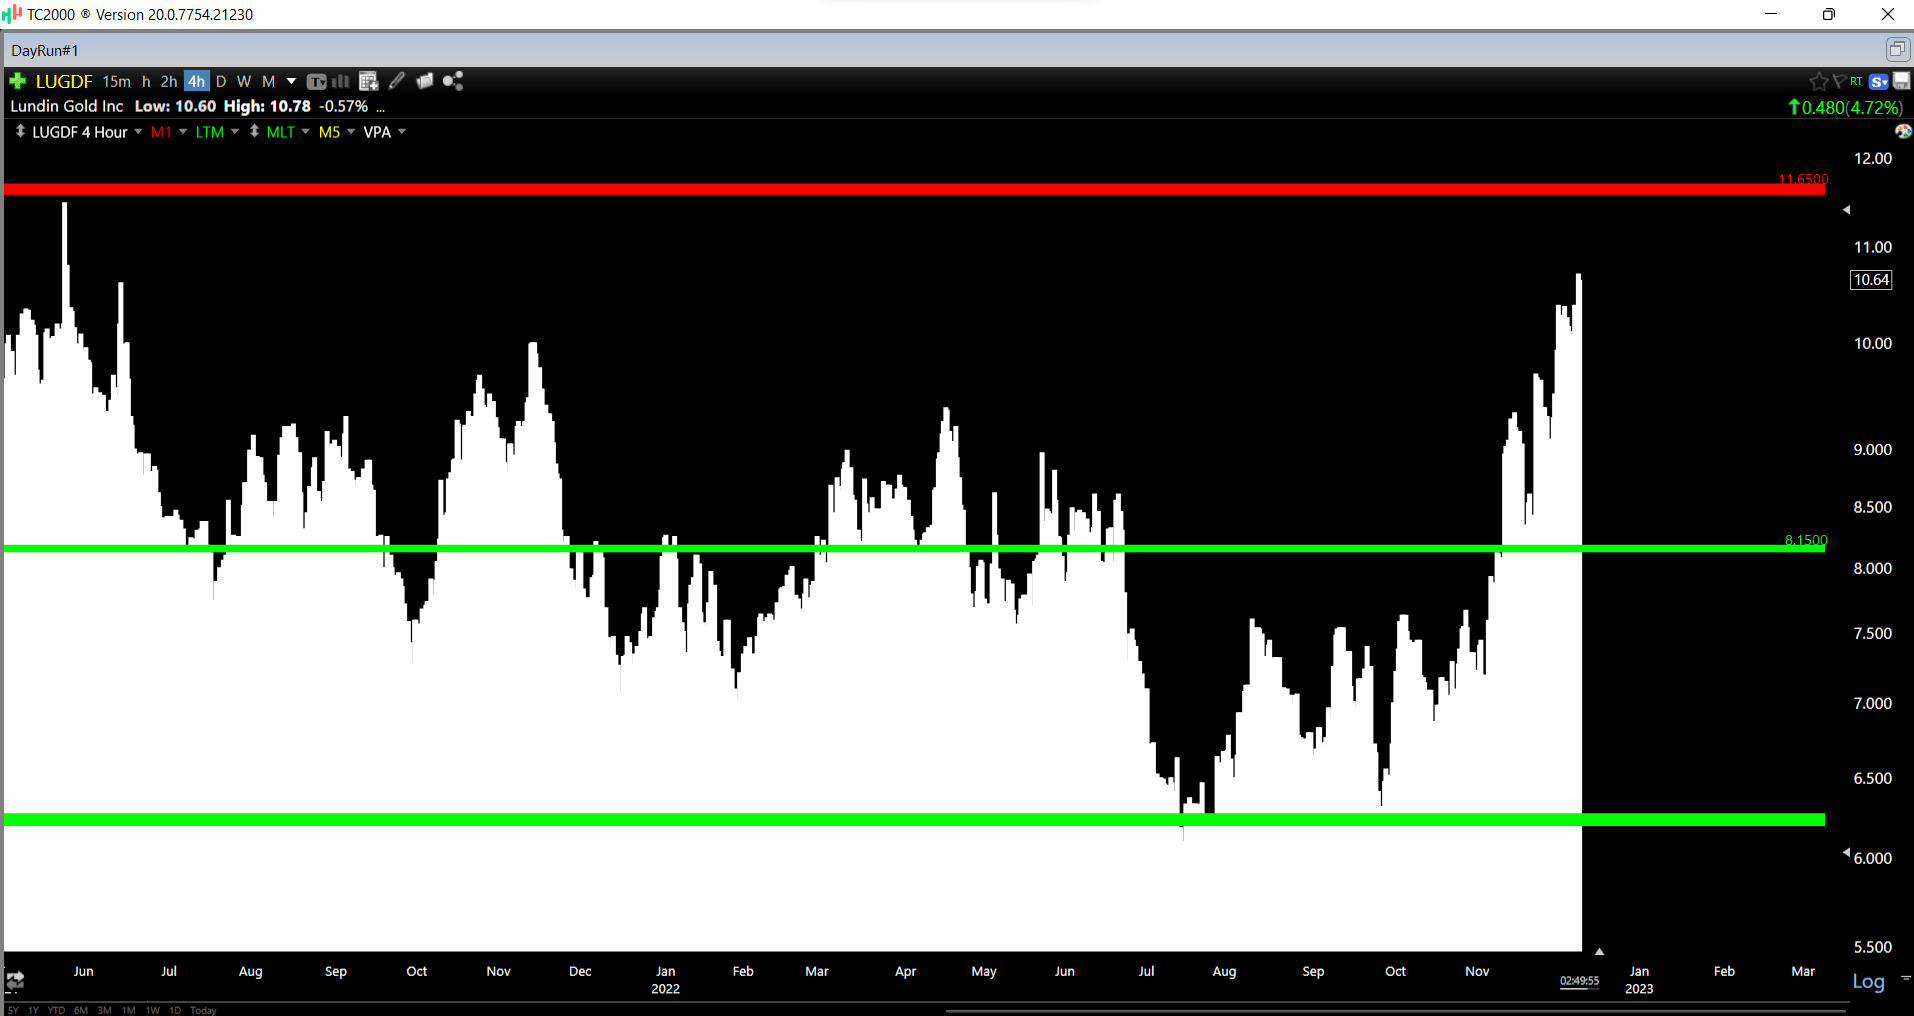
Looking at the technical picture, this confirms the stock is nowhere near a low-risk buy zone, with Lundin having an overbought zone at US$11.65 and no strong support until US$10.15. From a current share price of US$10.70, this translates to a reward/risk ratio of 0.37 to 1.0, with $0.95 in potential upside to its overbought zone and $2.55 in potential downside to its next strong support level. Obviously, this doesn’t mean that the stock can’t go higher, and if the gold price heads above $1,850/oz in the next couple of months, we could certainly see this rally persist.
While we could see further upside in the stock if this rally in precious metals prices continues, Lundin is now within 8% of an overbought zone. I prefer a minimum 5.0 to 1.0 reward/risk ratio to justify starting new positions in mid-cap producers. Hence, I don’t see any way to justify chasing the stock above US$10.70. In fact, I would view any rallies above US$11.35 before February as an opportunity to book some profits, given that at these levels, Lundin would be priced for near perfection for a single-asset producer.
Some investors might argue that trading a name like Lundin Gold could be risky, and trading around the core of one’s position could lead to missing out on future gains, given that its status as a high-grade, Tier-1 scale producer makes it a takeover target. Although a fair point, I can’t see any majors making a move for the stock here, with it trading at a premium to net asset value already.
Summary
Lundin Gold continues to fire on all cylinders, evidenced by world-class drill results, and being on track to easily beat its FY2022 guidance. Meanwhile, the company has three strong years ahead at Fruta Del Norte, and its production profile is expected to average ~490,000 ounces at sub $850/oz costs, making this one of the most impressive mines globally. That said, the goal is to buy producers when they’re on the sale rack or at least becoming oversold, and this isn’t the case for Lundin Gold after its 75% rally over the past five months. To summarize, I remain Neutral on the stock due to valuation, and I would view any rallies above US$11.35 before February as an opportunity to take some profits.
Be the first to comment