

Robert Way
Company History
Lululemon (NASDAQ:LULU) needs no introduction, but for context I shall still provide one. The athleisure giant was founded in 1998 in Vancouver, Canada by its revolutionary founder, Chip Wilson. With more than 24 years of operational history, the company went public in 2007, raising $330M. Its fiscal year ends January.
Lulu literally pioneered ‘athleisure’, a new term that has come to refer to a hybrid style of clothing to be worn everyday. The wear is both athletic in nature and functionality but yet donned in a leisure setting.
To understand Lulu, one should not merely picture them as yet another apparel company selling a tangible yoga product, but rather a firm selling a unique lifestyle experience that many want to be a part of. Their community of followers or ‘guests’ as the company calls it, is so huge and their loyalty unmatched, and this is the real value and strength of their brand.
Business Model
Lululemon primarily makes money from selling apparel and footwear in their stores and online, alongside collecting other revenues from their subscription MIRROR business. Management classifies revenues according to 3 main verticals.
- Company-Operated Stores, 2) DTC, 3) Other Revenues
Company Operated Stores [COS]
This includes all revenue derived from the sales of products within any of Lululemon’s 600+ stores. End FY22, Lulu had 574 stores worldwide, but since then, management has expanded to grow store presence to 623 stores ending Q3’23. These retail-owned stores are owned and operated by Lulu, and they include all traditional, seasonal, and experiential stores.
Experiential stores refer to the megastores that Lulu has chosen to pursue more aggressively in the near future, often featuring a mass space more than 20,000 square feet, inclusive of locker rooms, fuel bars, workout studios for guests to participate in a yoga or HIIT session conducted in-house by brand ambassadors.
Direct-To-Consumer [DTC]
In some consumer companies, selling directly to the consumer in-stores are also considered DTC, but in Lulu’s case, this strictly refers to digital sales that customers purchase online.
Other Revenues [OR]
This refers to revenue collected through all other verticals. Warehouse sales and licensed stores sales where Lulu enters into licensed agreements with partners in certain target markets also fall under this segment. This component also includes sales through pop-up locations which refer to small-scale temporary booths that Lulu sets up to test the receptiveness of a particular geographic location to their products.
MIRROR sales (both hardware + subscriptions) also fall under here. MIRROR was acquired by the company in 2020 for $500M, and monetization comes through the sales of the entry-level hardware product and the recurring monthly subscription price for guests that use the product for at-home workouts.
The Retail Deep Dive (Substack)
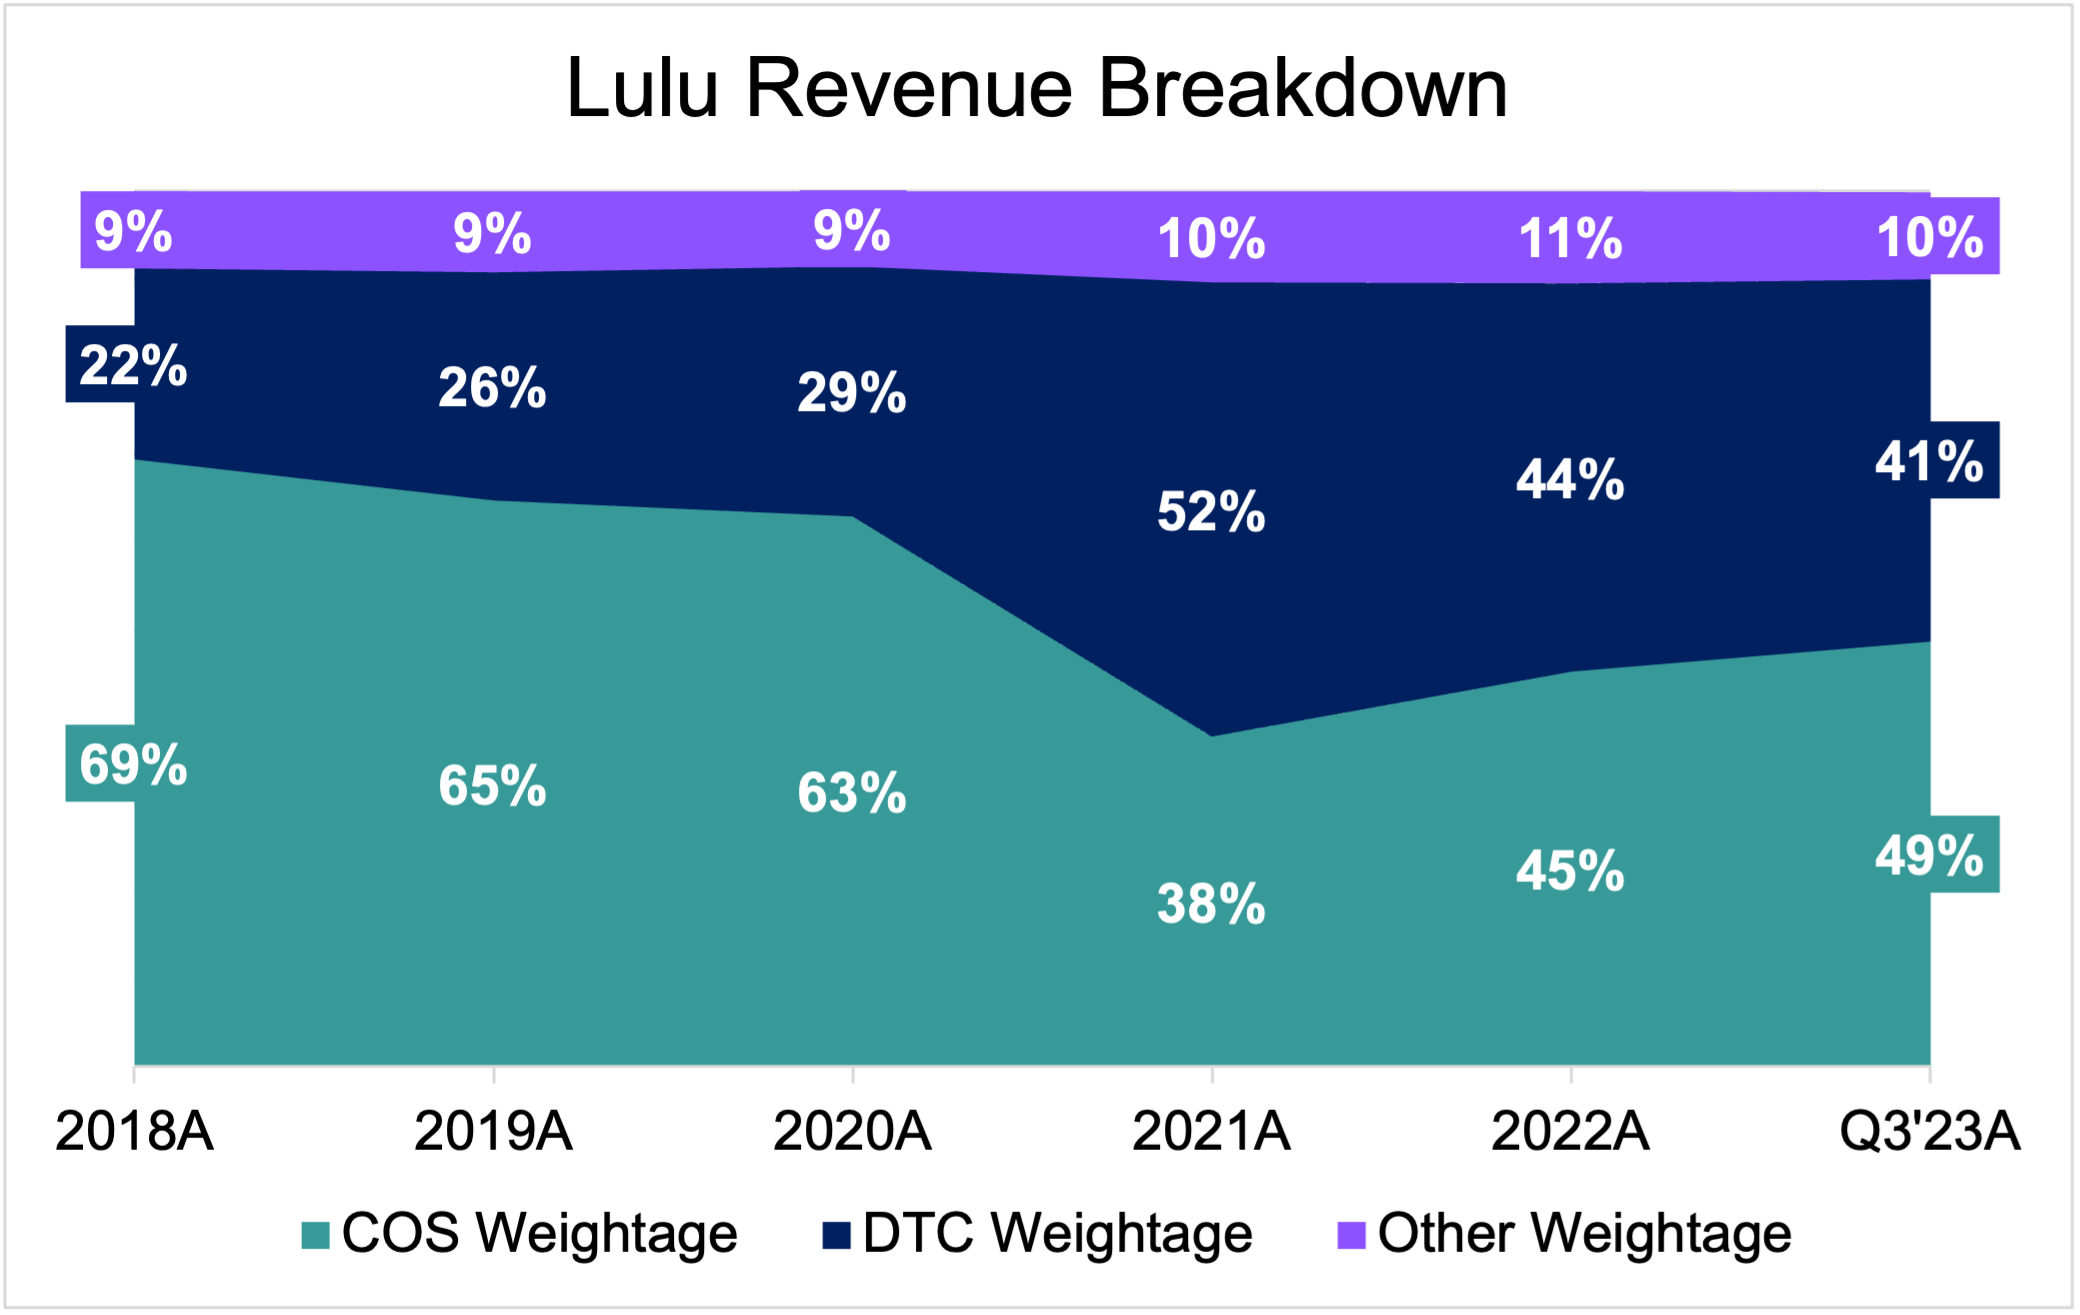
COS has always remained Lulu’s strongest sales channel, followed by DTC and ‘other revenues’. COS Weightage as a % of sales took a severe hit in 2021 due to the pandemic and the need to shutdown stores globally, but there has since been a strong resurgence as the world returns to normality. Latest Q3’23 data shows that COS sales continued to climb to 49% of overall sales for the quarter. DTC sales continue to remain an important channel for the brand, accounting for 44% of FY22 sales with a slight normalization in Q3’23.
While Lulu continues to rely heavily on physical retail stores to be a sales channel, they have realized the need to diversify away from it, and are still investing heavily into building out their digital channel.
The Retail Deep Dive (Substack)
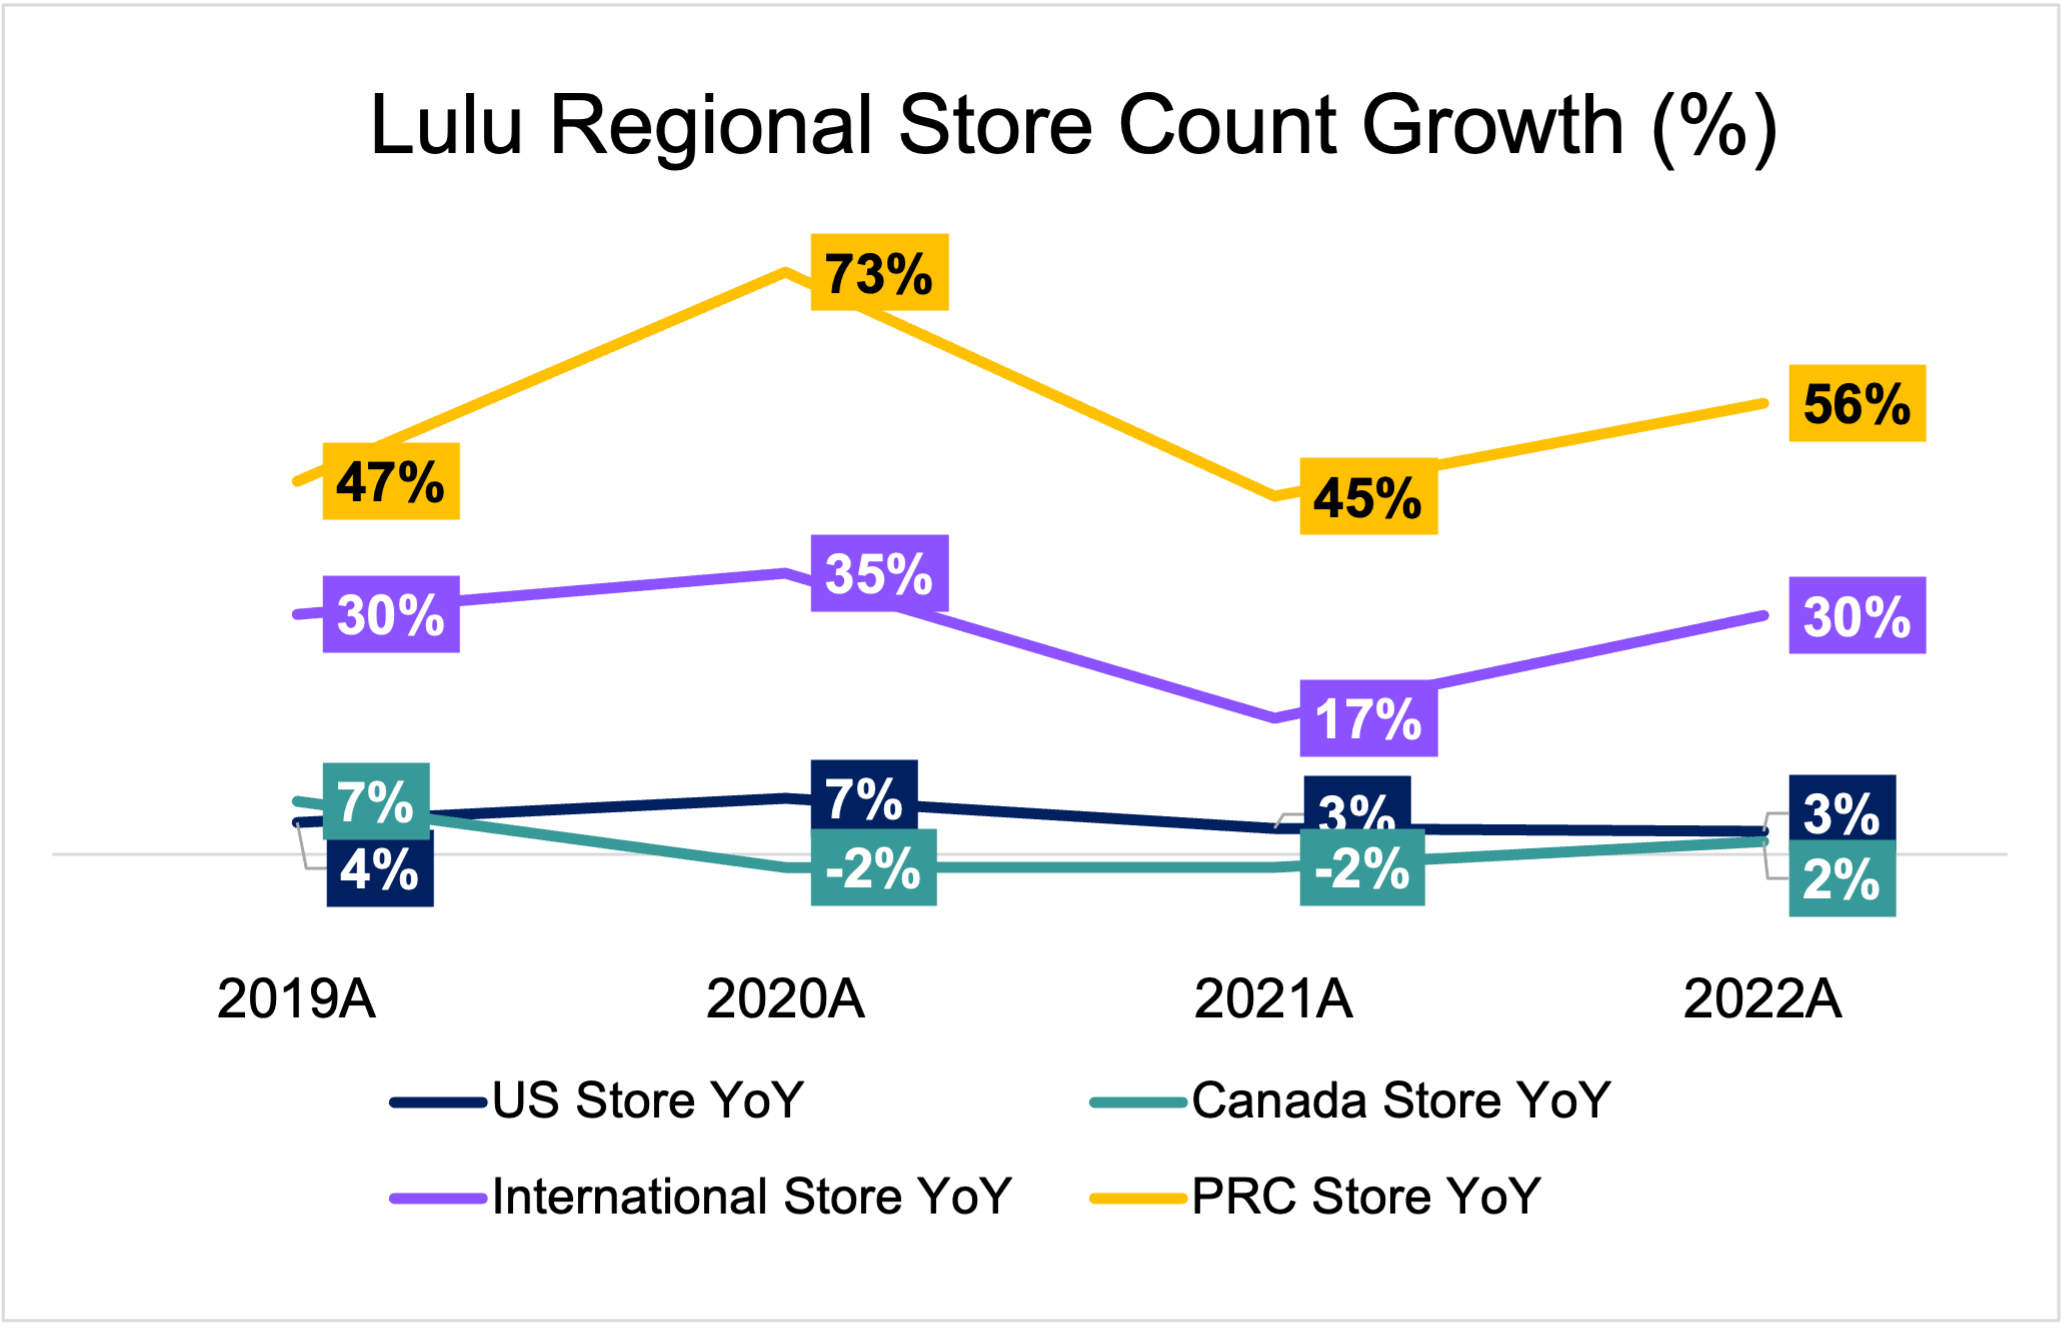
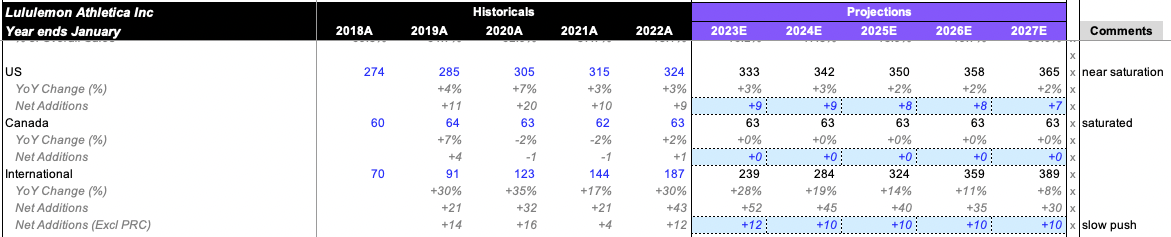
Store count (ex franchise stores) has grown from 404 in FY18 to 574 in FY22, to the current 623 as per latest Q3’23 data. What’s important to note, however, is management’s focus on growing store count in the international markets, where growth (denoted in purple) has averaged +28% the past 5Y. Within the international segment, the concentration is no doubt in the PRC market, where store count growth (denoted in yellow) sits at an average +55% the past 5Y. As it is, the 15 PRC stores that Lulu had in international markets in FY18 represented 21% of the total international stores, but PRC presence has since grown to represent 46% of international stores.
Product Pipeline
Lulu sells quality technologically advanced products (apparel + footwear).
Apparel
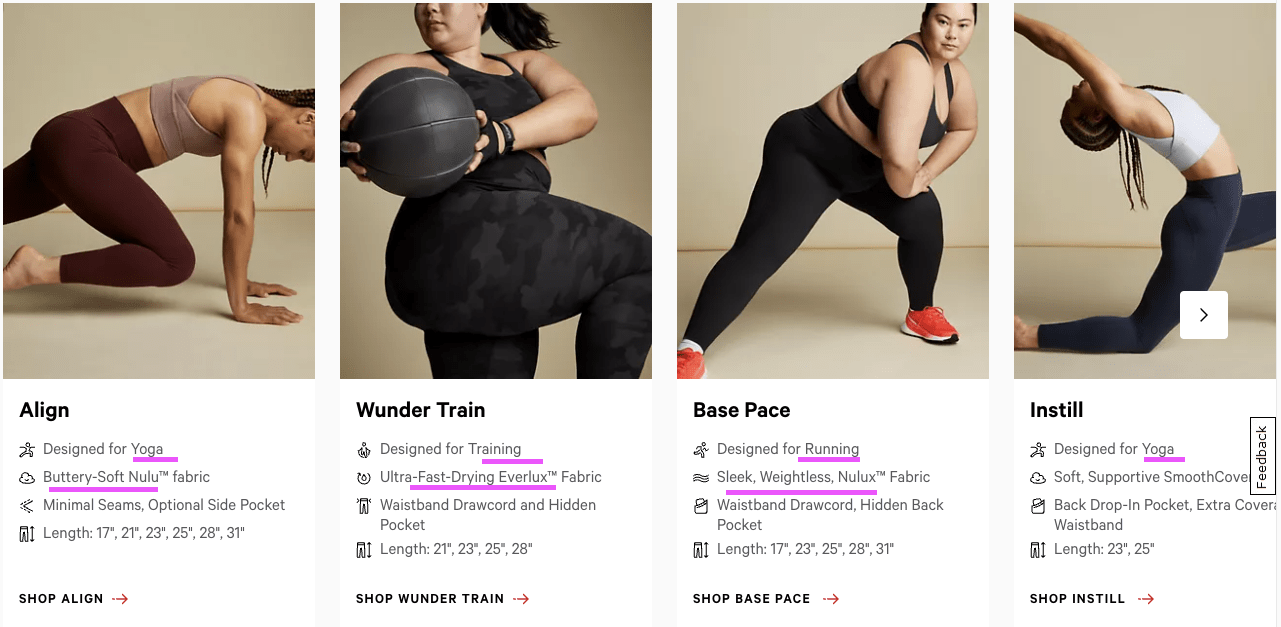
Under the apparel component, the company has 4 core categories, namely:
-
- Yoga, 2) Run, 3) Train, and 4) OTM (On the move, which refers to non-performance wear, more so loungey casual leggings)
Yoga leggings is the core value proposition, given that that was what the company first started out with and the majority of their customers continue to be women. When Chip first introduced the Lulu leggings, his main motivation was to do so having observed a gap in the yoga industry, where women used to wear ballet and dance clothes that were too thin and transparent. Under the menswear line, Lulu’s flagship product remains to be the ABC pants (anti-ball-crushing pants), featuring a roomier crotch area to be worn for work/golf.
Lululemon Website
Footwear
Lululemon introduced their shoe collection just this year itself, with CEO Calvin McDonald stating that:
Footwear is the natural next step for us to expand and apply our long history of innovation in fit, feel and performance, and it represents an exciting moment for our brand,”.
Company Moats
The way I see it, Lululemon is an apparel behemoth with 3 very strong moats. They include:
- Product Quality Excellence
- Superior Brand Loyalty
- Vertical Integration + No Wholesale Approach
1) Product Quality Excellence
Although there are many companies within the ‘athleisure space’ offering yoga pants, none of them are on the same level as Lulu. Lulu has superior technical expertise which originates from 1) strong R&D efforts and 2) a concentrated reliable supplier base.
The company’s high quality is a function of its emphasis on innovation, as well as the use of tech that they then incorporate into products to achieve the highest performing tactical wear. Lulu’s patented ‘Luon’ material consists of 81% Nylon and 19% Lycra, and provides an extra layer of comfort. At Whitespace, the company’s in-house innovation lab, Lululemon also constantly researches and tests new products and materials, focusing on blending design, function and feel.
Lululemon Website
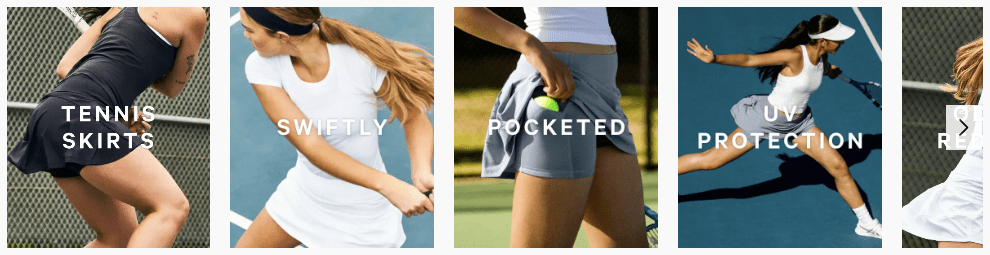
Lulu also pays exceptional attention to detail, tailoring each category specifically for its assigned use case. Their ‘align’ pants for yoga has no zippers and features a minimal design. However, their running leggings have a more of a sporty streamlined design with reflective details and zippers. The reflective details are at the bottom inside seam and are a built-in safety protection for those that run at night.
Furthermore, Lululemon has a largely exceptional record when it comes to product consistency, primarily due to their reliance on a very concentrated supplier base that has proven themselves worthy. Lululemon has less than 40 vendors across the world, the majority of which are in Vietnam and Cambodia.
These reasons culminate in a highly functional product that has won over the hearts of consumers, and not because of anything else (ethos/price point…). While some may argue that others can easily replicate Lulu’s material composition with a slight tweak to create an entirely new product with a somewhat similar quality (and many have tried), customers always default to Lulu and their brand strength has stood the test of time.
2) Superior Brand Loyalty
There are plenty of athleisure brands, but none of them have been able to influence the consumer and pull them over to the same extent that Lulu has. The resulting cult-like loyalty is something unparalleled in the realm of the apparel industry, and is what also justifies Lulu’s ability to price their products at the upper end of the spectrum, with no corresponding fall in demand in all types of macroeconomic conditions.
The main channel that Lulu builds their cult-like following is through grassroots marketing. They recruit local yoga instructors to be brand ambassadors, and in exchange provide them with their branded clothing. These ambassadors are called in to conduct yoga sessions for the company, some that are done in-stores itself as part of the experiential approach that the company has adopted.
The use of grassroots marketing also allows Lulu to save substantially on marketing costs, and stick to their low-reliance on celebrity endorsements and brand deals since inception. For example, Cowen’s Kernan stated that:
We note that LULU’s customer acquisition costs are extremely low relative to customer lifetime value – as the brand spends less than any peers on marketing ~ Forbes
3) Vertical Integration + No Wholesale Approach
The last moat that Lulu has is its largely ‘no’ wholesale approach. In consumer based companies that attain a large portion of their sales through brick and mortar retail sales, most companies will tend to prioritize reach and scale. They partner with 3rd parties and sell wholesale to other businesses in bulk so that items can then be displayed in big box sporting retailers and reach is maximized. While this maximizes volume to a certain extent, the downside is the lack of control over quality and pricing.
Purchase of Lulu products are almost entirely impossible through big box sporting retailers, as Lulu has always kept careful control over its distribution. They have very limited wholesale partners if any, which incurs less risk of markdowns on their partner’s side. This exclusivity in terms of channels to buy a Lulu product thus guarantees price control and the associated premium with the brand that then comes with it.
While some may not think of this as a moat (as any company can choose to not do wholesale), it is a moat and for this very simple reason. The only other way to grow and maximize scale would be to expand own store presence. That, however, takes a lot of time and capital that most other brands just don’t have. Lulu has the funds to consistently expand and the difference with them is that they choose to forego reach for quality, and they can afford to do so. Many other designer brands also don’t do wholesale, yes, but within the activewear and athleisure space, that is rare.
Investment Theses
1) Lulu’s DTC Hedge Is Exceptionally Strong
The Retail Deep Dive (Substack)
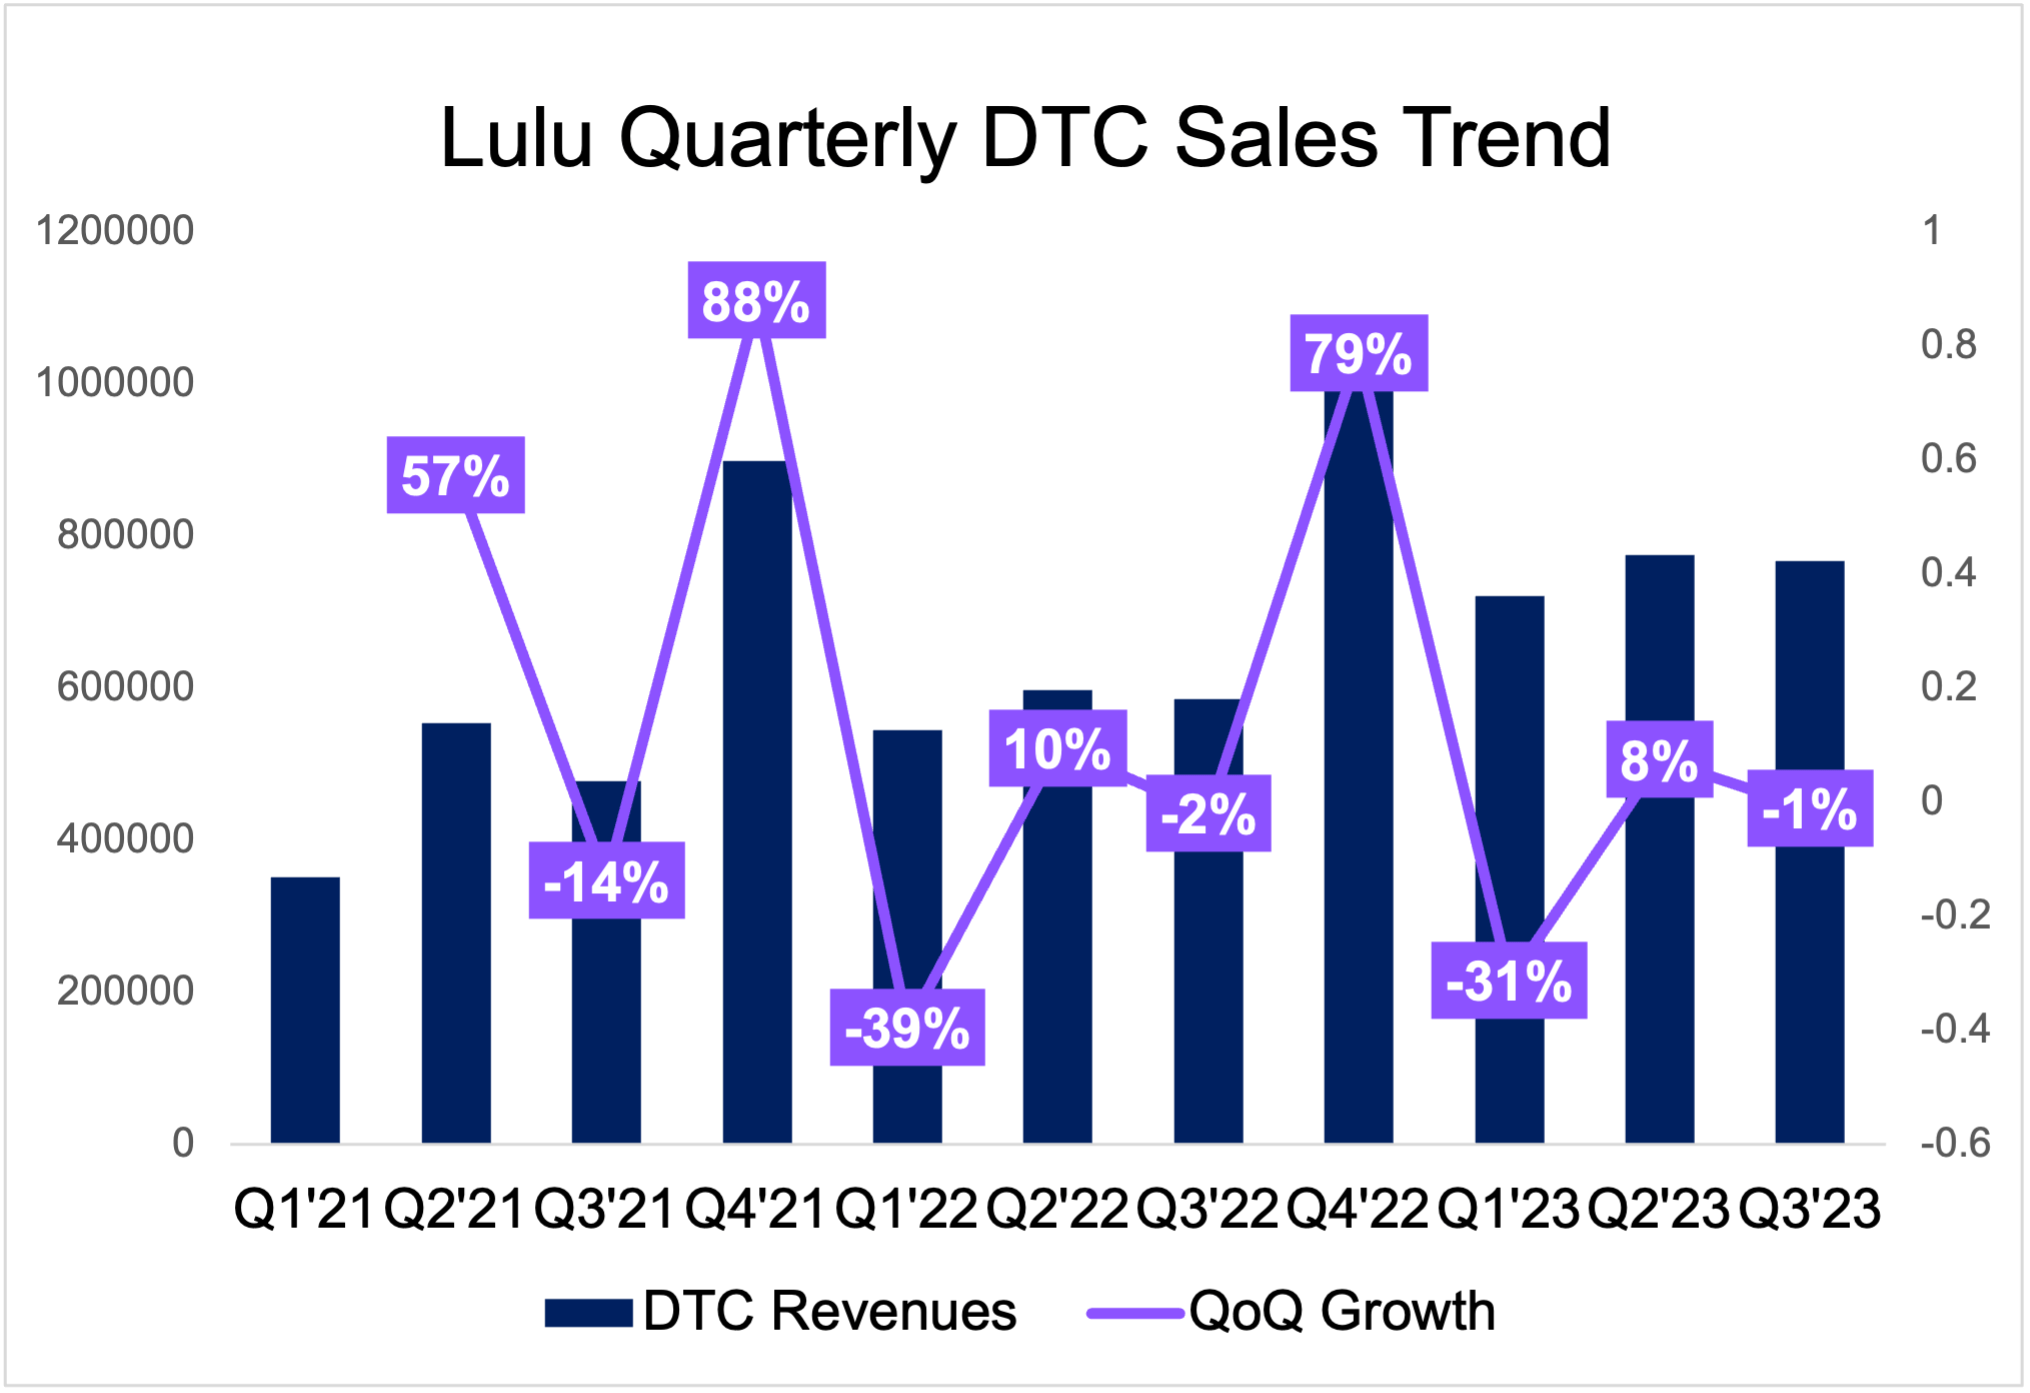
DTC sales took up 20-30% of pre-Covid era, but jumped to 52% in FY21. Although this is somewhat expected as consumers were forced to shop online rather than in-stores (hence the artificially inflated 100+% yoy growth in FY21), what has been shocking and a surprise to analysts is the strength of the lack of normalization in the DTC channel post-reopening. Even with COS opening up for business once more, DTC sales have scaled back far less than many have expected, which is a testament to the strength of Lulu’s digital approach and ability to close customers online.
YTD for the first 3 quarters of their fiscal year, DTC sales for Q1, 2, and 3 stood at $721M, $775M, and $767M, which total $2.26B in revenues. On a normalized basis, assuming DTC sales for Q4 is the exact same as Q3, Lulu is on track to post DTC revenues for the full year slightly over $3B, representative of another ~9% yoy growth. This in itself is an entirely conservative estimate given that Lulu’s DTC sales are always the highest in Q4 (evidently because of holiday shopping).
The Retail Deep Dive (Substack)
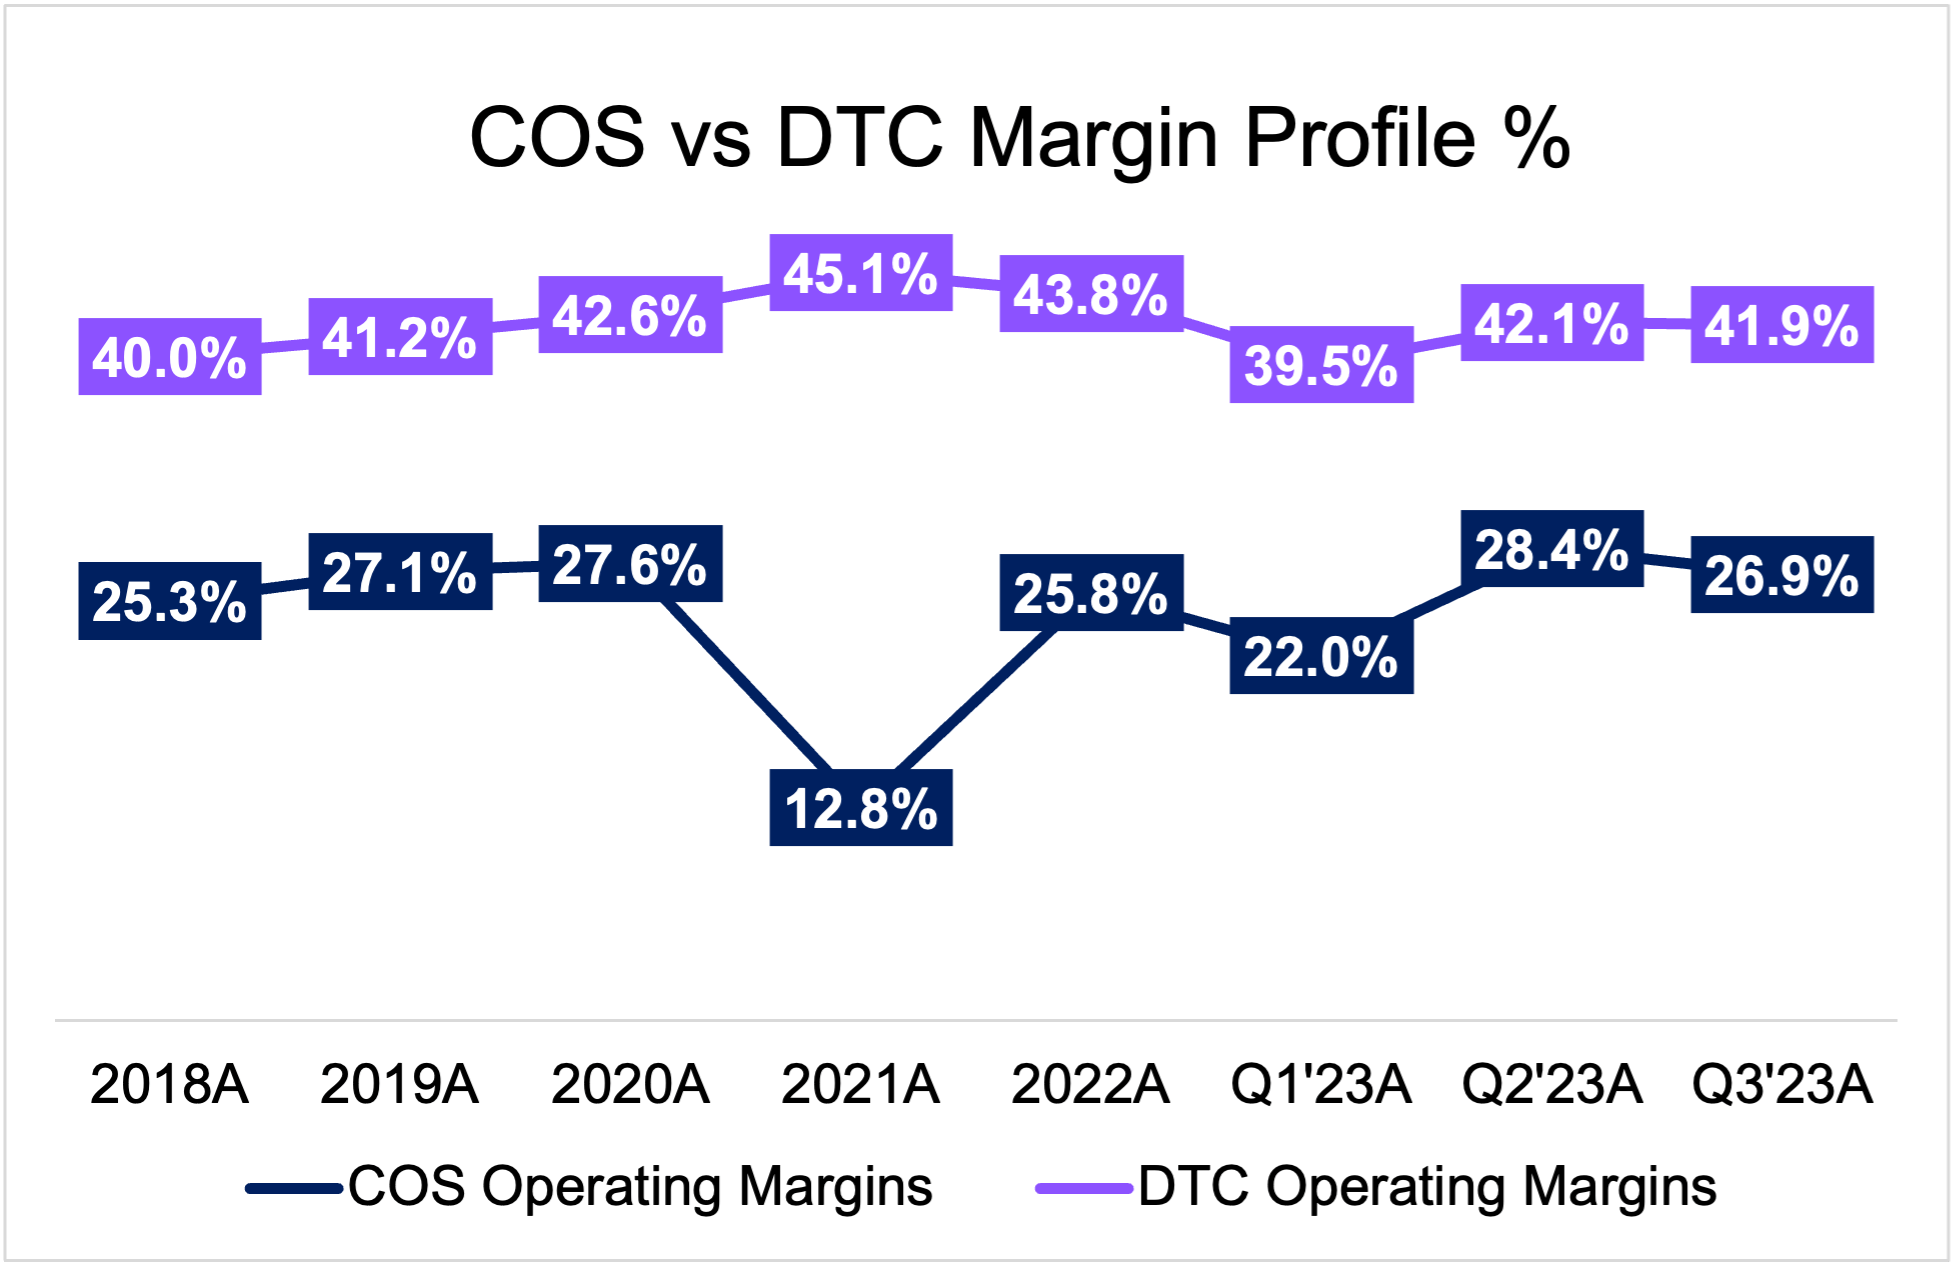
With a resilient DTC platform and interest in furthering their DTC stack, this should lead to eventually lead to gradual margin accretion due to the higher margin nature of DTC relative to the COS platform. When we look to the operating margin (EBIT) profile for COS sales vs that of DTC sales, we can see that the DTC channel commands margins 1.8X higher than COS on average. As DTC sales continue to grow and maintain a large portion of overall sales, this should lead to margin expansion.
2) Adjacent Market Expansion Entirely Feasible
Under the previous Power of Three strategy unveiled in 2019 with a 3-5Y timeframe, management laid out the goal to:
- 2X Men’s Revenues
- 2X DTC Revenues
- 4X International Revenues
Under the new 5Y growth plan laid out in their analyst day in 2022, management has more or less duplicated the previous strategy, with an end goal by 2026. The new plan also features goals for the same 3 pillars, product innovation, omni-guest experience, and market expansion. They are targeting revenues of $12.5B by FY26.
As part of their market expansion, Lulu plans to push further into the APAC and EMEA markets, and away from NA where they have some sort of a saturation and cap to growth. While brand awareness is strong in NA, it is clearly falling short in the international segment, specifically in China where brand awareness among women is only 11%, 59 percentage points behind that in Canada. Although China’s population size trumps that of Canada, the data points to a clear addressable market.
Lulu is also no stranger to the Chinese yoga market. They first entered China in 2014 as China’s sportswear boom was starting to take off through popup stores. Lulu has also made intentional efforts to adapt to the Chinese markets, tailoring their products to appeal to locals. For example, Lulu created the ‘asian fit’. The Asia Fit range is a petite fit and has “narrower waistbands, are slightly longer down the hip, have a better fit on the knee and calf and a shorter inseam.”
Risks (Systematic + Idiosyncratic)
Like any other company, Lululemon is subject to risks, both macro (systematic) events that affect the entire market and risks specific to them (idiosyncratic). I will cover the main risks I think Lulu is susceptible to.
1) Quality shortfalls (idiosyncratic)
One of Lulu’s moats is their exceptional product quality which partly justifies their premium prices. However, there have been certain instances where quality has fallen short of expectations, leading to mass recalls. The 2013 recall pulled back 17% of their flagship Luon skinny black leggings after customers complained that the fabric was too thin and hence see-through. While Lulu worked to replenish their inventories quickly, the way they handled the situation was also plagued with controversy, when they asked women to bend over to prove their yoga pants was really sheer. However, while such product quality issues do surface every now and then, the loyalty customers have for the brand insulates them from such one-off bad press events.
2) Macro Impacts on Discretionary Spend (systematic)
Lulu’s items are relatively expensive, and can be classified as a luxury discretionary spend. In times of macroeconomic recessionary fears, consumers tend to cut back on such items and channel income towards necessities like healthcare, staples, and utilities. However, that being said, compared to the rest of the apparel industry, Lulu’s inherent customer base (higher-income earners) tend to be less affected from such events. Furthermore, there has been little evidence of a cutback in spending in 2022. While many other companies were dialing back forecasts and cutting guidance, management swam against the tide and increased revenue guidance, signalling the confidence they had in demand for their products, specifically their black leggings they term a ‘core seasonless product’ within inventories.
Revenue Projections
Just to preface so that you guys can follow along, Lululemon ends their fiscal year in January. Meaning in financial terms, the full calendar year performance for 2022 is termed FY23 since the 4th quarter ends in January 2023.
- 2021 full-year performance = FY22 in the model
- 2022 full year performance = FY23 in the model
- The most recent 3rd quarter is termed Q3’23.
Company-Operated Store [COS]
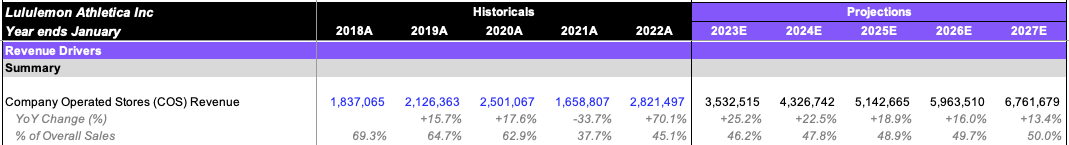
The COS segment has historically accounted for the largest bulk of sales, weighing about 56% of overall sales for the past 5 years on average. This revenues are driven by the average total gross square footage of stores and comparable store sales and new store productivity. Since square footage of stores is then in turn driven by store count, a view on store count is necessary.
Panther Research – Equity Deep Dives (Gumroad Investment Model)
Lululemon ended their most recent quarter with 623 stores, up 49 stores (+8%) since the end of their last fiscal year 2022 (full year 2021). Management has already noted that the majority of future store growth is likely to be in the APAC markets as PRC takes up a larger chunk of sales. With PRC store count of 86 ending FY22 (71 in mainland China, 9 in HK, 5 in Taiwan, and 2 in Macau), I project this to grow to 236 by FY27, in the next 5 years. That would represent a 170%+ growth in nominal value, an average of 23% for the next 5 years. I intentionally front-loaded the growth in the earlier years.
While this is indeed aggressive, they aren’t too far from management’s own 220 stores in PRC goal within the same timeframe. I project more aggressively given that management always tends to underpromise but overdeliver, and also because I think the trend towards healthy living in China is likely more potent than most people are expecting. Growth was also intentionally front-loaded as China has finally pivoted from their zero-Covid policy.
For the North America segment, I anticipate minimal growth in the US and none in Canada (flatlined largely using historicals).

Panther Research – Equity Deep Dives (Gumroad Investment Model)
- Overall I expect store count to jump to 817 by FY27.
- For the gross square footage growth, I estimated the rates based on the average change in relation to the historical store count change.
Given that management has quite a good track record with regards to same store sales, I estimate positive SSS growth leading up to FY27, with FY23 seeing +11% in SSS growth. I expect positive growth predominantly to originate from a higher average order value (AOV) and increased traffic as consumers return to in-person shopping. To factor in the reality that the revenge shopping phase has already played out to a certain extent, I do taper growth rates downwards for future years. Regardless, consumers are still flush with cash and elevated demand should continue for some time.
Panther Research – Equity Deep Dives (Gumroad Investment Model)
For my overall COS estimates, I expect revenues close to $3.5B for FY23, representative of a 25% growth yoy. If we look to the 1st 3 quarter results for FY23 and annualize sales for Q4 to come up with an estimate for the full year, that would total about 3.38B, and so my estimates factor in a Q4 that outperforms Q1-3.
Direct-To-Consumer [DTC]
The strength in the DTC channel is one of the strongest factors for Lulu. While management did not explicitly break this segment down to its KPIs, I have projected sales from transaction count and an ARPU estimate. I estimate historical ARPU/AOV to be $120 which somewhat falls in line with the price of a core Lulu legging product, and expect ARPU/AOV size to grow minimally moving forward. While not every customer will have a basket size worth that amount, we know that the highest spenders at Lulu spend thousands a year.

Panther Research – Equity Deep Dives (Gumroad Investment Model)
Based on my DTC estimates, I expect FY23 sales to total $3.3B, +20% yoy.
Other Revenues [OR]

Panther Research – Equity Deep Dives (Gumroad Investment Model)
Lastly, for the other revenue segment which management also does not explicitly break down, I estimate MIRROR sales to grow in the high teens for the next 2 years before normalizing down to the low teens for the following 3Y. As a percentage of overall other revenues, MIRROR sales accounted for 20%, and I expect this to dwindle slightly to 17%. For the other components within the ‘OR’ segment, I flatlined their average historical growth at 9%. Overall, I expect ‘OR’ sales for FY23 to total 770M and $1.3B by FY27.
Revenue Component Summary
Overall, I expect revenues in the next 5Y to grow at an average of +17%, lower than the +22% average in the past 5Y. The majority of topline growth is likely to still be generated from the COS segment, specifically the push into APAC through more store openings and increased reach. With regards to FY27 numbers 5 years down the road, I am anticipating management to beat their own target of a $12.5B topline by then.
Cost Projections
Cost of Goods Sold (COGS)
The cost of goods sold expense line item is inclusive of manufacturing expenses, D&A, and transportation. Transportation costs have been elevated due to supply chain issues and have been highlighted by management in their earnings call. Since D&A is part of COGS, I project COGS (excluding D&A) first, using historicals as a benchmark and elevating expense upwards to account for sustained inflation and higher transportation costs for FY23, before adding D&A back to total the actual COGS line item.
While COGS as a percentage of overall sales totaled 42.3% last year to deliver a 57.7% gross profit margin, I expect this expense to be slightly elevated for the full year ending January 2023 at 44% and gross margins to compress 170bps to 56%. As such one-off costs taper off moving into the future, I then expect minimal margin accretion.
Operational Expense (OPEX)
For the OPEX segment, I projected it as per EBIT margins for the 3 revenue channels. I expect margins to normalise upwards as inflation tapers, and for the other segment operational margins, I broke that down into MIRROR EBIT margins and overall other operational margins (excluding MIRROR).
However, given the elevated marketing costs associated with the MIRROR segment as well as a front-loaded rollout strategy, I expect MIRROR to become profitable on an operational basis by FY26. MIRROR EBIT margins were -76% in FY21 before dropping to -23% in FY22. I expect this loss to continue to minimize down to the low teens before inflecting from 2025-2026.
As marketing costs somewhat normalise and come down from the recent highs due increasing competition, I also expect S,G&A expenses to relieve slightly.
Margin Analysis
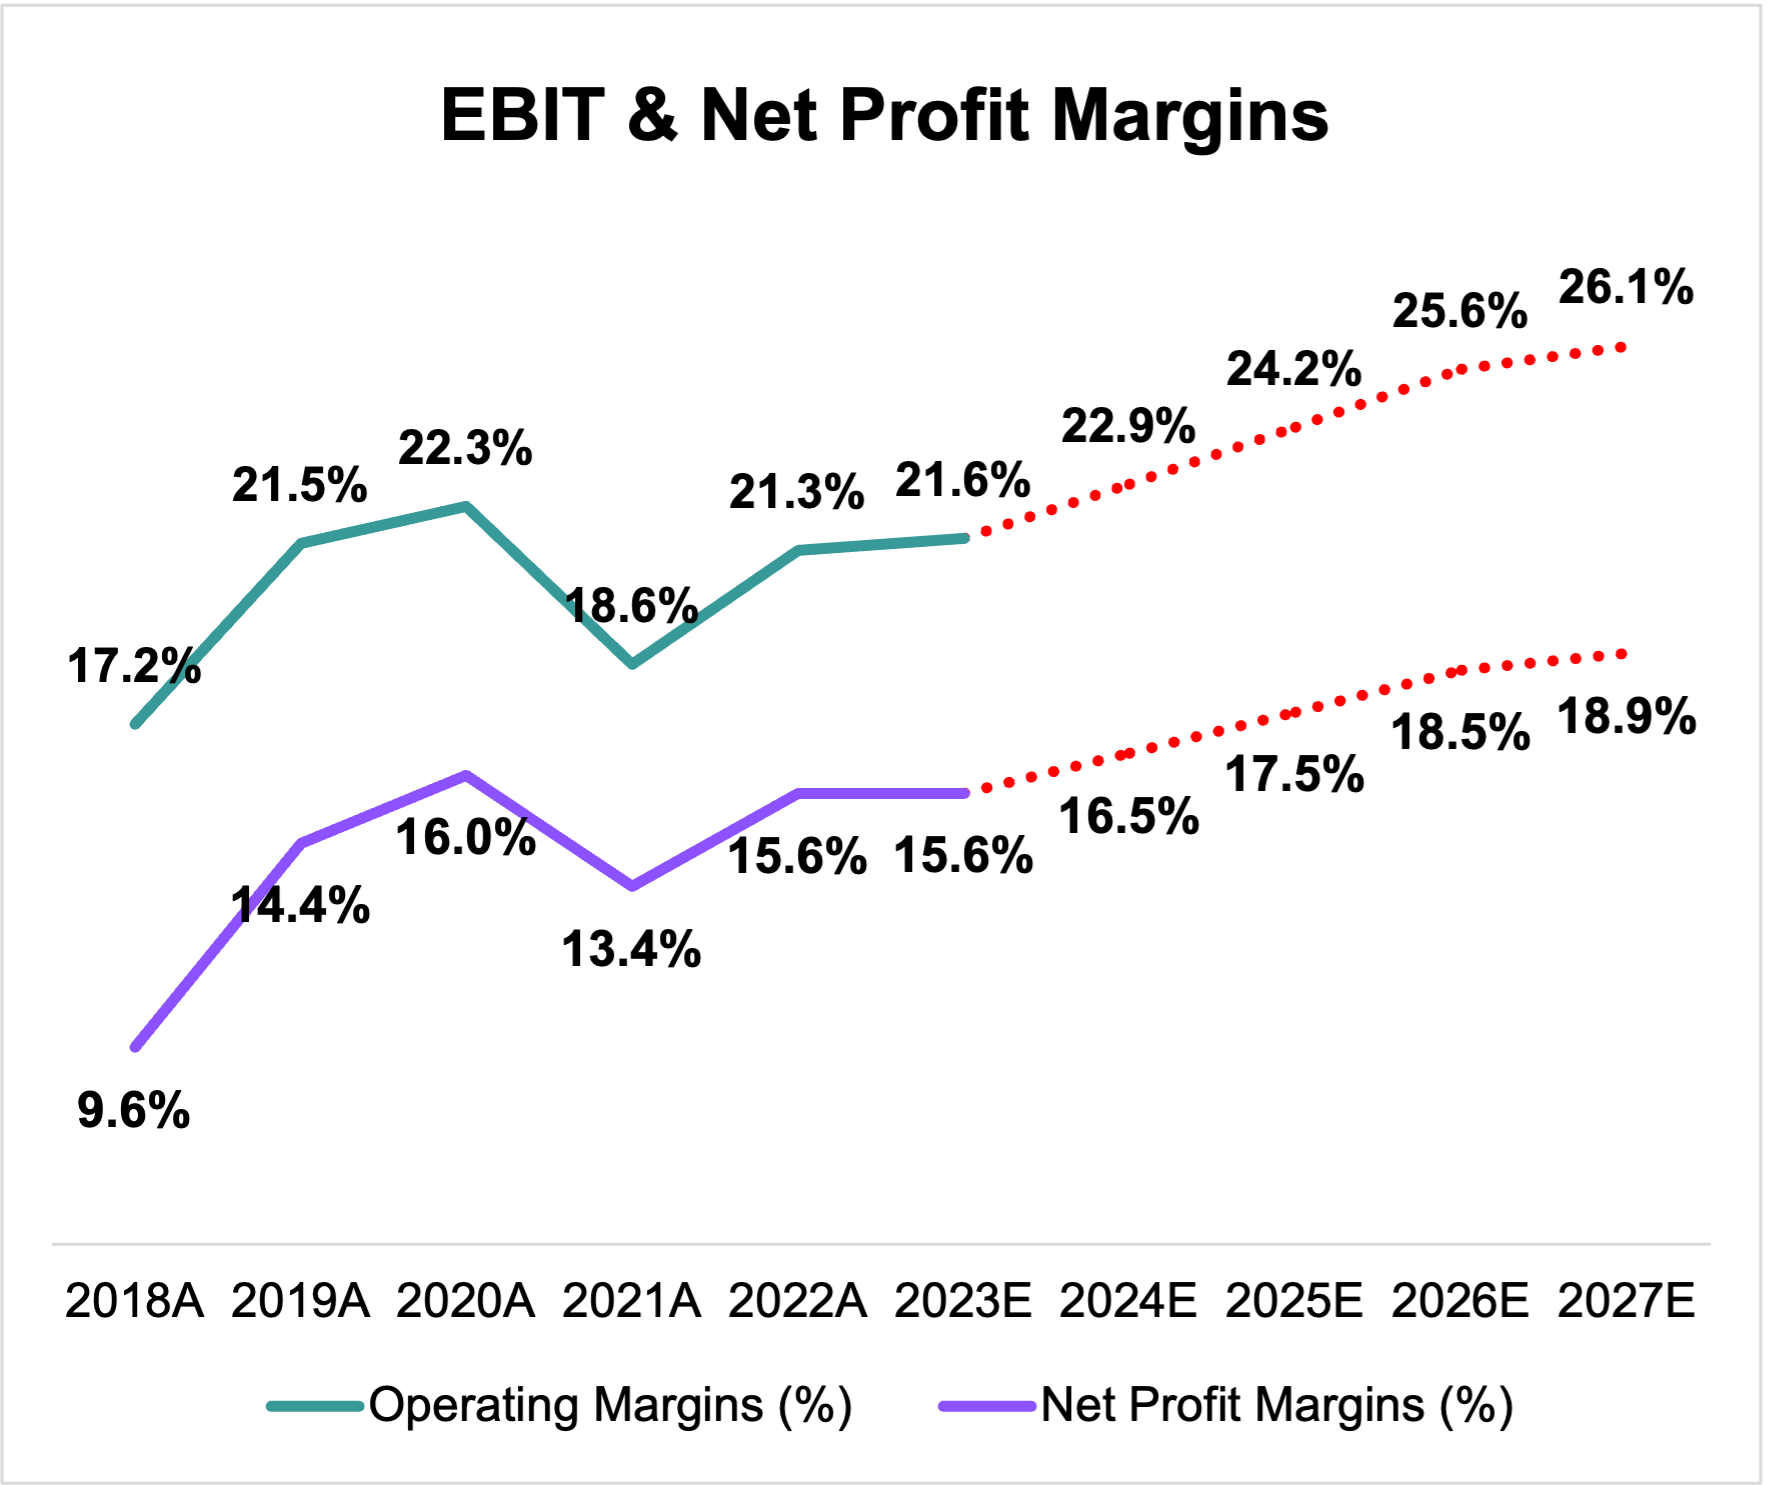
Panther Research – Equity Deep Dives (Gumroad Investment Model)
Factoring in the above revenue and cost projections, here are my corresponding margin estimates. In essence, I expect margin accretion originating from inflation tapering, the DTC channel which commands higher operational margins to maintain its strong hedge, MIRROR turning profitable in FY26, and S,G&A costs to come down from elevated marketing costs and wage inflation.
Valuation Methodology
I employed a blended valuation methodology, deriving half my valuation from a discounted cashflow and the other half from relative valuations.
- 9.5% WACC
- DCF Valuations hint at a 22% downside
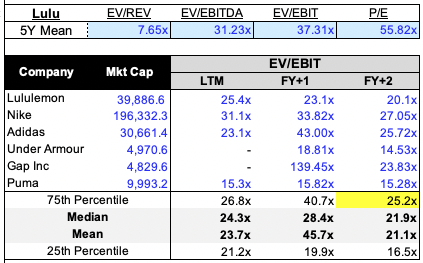
- Relative Valuations hint at a 43% upside, using an EV/EBIT 75th percentile exit multiple (25.2x) relative to peers
Panther Research – Equity Deep Dives (Gumroad Investment Model)
I believe using the 75th percentile 25.2x EV/EBIT multiple is a fair one given that Lulu has historically never been cheap, always traded higher than peers owing to their premium business and branding, and also because this multiple is conservative relative to its own historicals.
Lulu’s 5Y historical EV/EBIT mean multiple is 37.3x, and so my multiple is more than conservative, and using the median EV/EBIT multiple (21.9x) would be way too conservative and unrealistic. I also don’t expect the ‘Lulu premium’ to ever fade and so multiples used with them should always be slightly inflated.
Panther Research – Equity Deep Dives (Gumroad Investment Model)
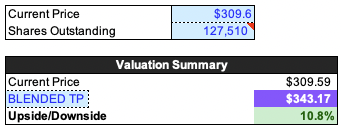
Blended, I get an upside of 11% and a TP of $343. However, since the upside is too minimal with no margin of safety, and management would need to be able to deliver on both their China push and maintaining their DTC hedge, I find the investment opportunity lackluster at the current $309 price levels. Should prices scale back to about $260 which gives me a comfortable margin of safety, I will be initiating a position.
Let’s Wrap Up!
Don’t get me wrong, Lulu is an exceptional business with a tested and proven model and unparalleled customer loyalty that can’t be quantified, but good businesses don’t translate into good investment opportunities, and with the depressed valuations of so many other businesses, capital can probably be allocated more efficiently elsewhere.
Till next time!
Be the first to comment