

Pgiam/iStock via Getty Images
Investing Thesis
Market-makers [MM] every day are called on to balance buyers and sellers’ share volumes in transactions. For typical small, regularly appearing individual investor trades, no problem. Markets are automated to quickly adapt from electronic “offer books” with little to no help.
But when systems are surprised by irregularly-appearing, huge volume transaction orders from “institutions” adjusting billion-$ portfolios, they choke, needing MM help to get in balance. Where sufficient protection from subsequent price change in a subject stock can be found at a reasonable cost, then MMs will borrow shares lent (usually by other institutions for a fee) to be delivered to the buy-side of the big trade order.
The structure and prices of the derivative-securities’ contracts providing the underlier-stock price-change protection reveal the MM-community and institution expectations of the stock’s higher and lower price limits. Those limits define price risk and rewards seen in the next few months for the subject stock, making comparisons of investment prospects between similar alternatives in the next few months viable.
This article compares the prospects for Lululemon Athletica Inc. (NASDAQ:LULU) with other apparel stock alternative investments, and equity market indexes.
Description of Subject Company
“Lululemon Athletica inc., together with its subsidiaries, designs, distributes, and retails athletic apparel and accessories for women and men. It operates through two segments, Company-Operated Stores and Direct to Consumer. The company offers pants, shorts, tops, and jackets for healthy lifestyle and athletic activities, such as yoga, running, and training, as well as other sweaty pursuits. It also provides fitness-related accessories. The company sells its products through a chain of company-operated stores; outlets and warehouse sales; a network of wholesale accounts, such as yoga studios, health clubs, and fitness centers; temporary locations, including seasonal stores; and license and supply arrangements, as well as directly to consumer through mobile apps, and lululemon.com e-commerce website. As of January 31, 2021, it operated 521 company-operated stores under the lululemon brand in the United States, Canada, the People’s Republic of China, Australia, the United Kingdom, Japan, New Zealand, Germany, South Korea, Singapore, France, Malaysia, Sweden, Ireland, the Netherlands, Norway, and Switzerland. lululemon athletica inc. was founded in 1998 and is based in Vancouver, Canada.”
Source: Yahoo Finance.
Yahoo Finance
Reward~Risk Comparison with Alternatives
Figure 1
blockdesk.com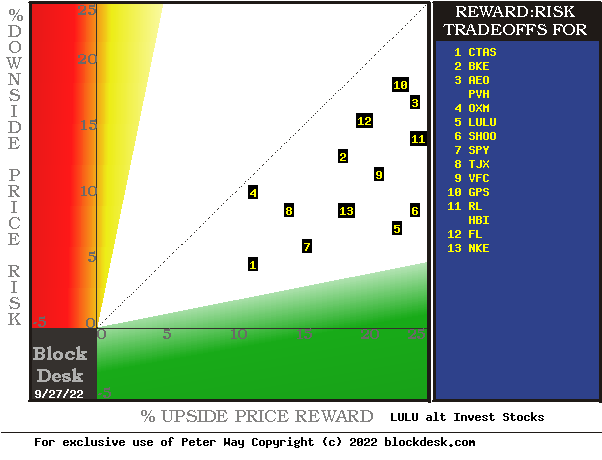
(Used with permission.)
The tradeoffs here are between near-term upside price gains (green horizontal scale) seen worth protecting against by Market-makers with short positions in each of the stocks, and the prior actual price drawdowns experienced during holdings of those stocks (red vertical scale). Both scales are of percent change from zero to 25%.
The intersection of those coordinates by the numbered positions is identified by the stock symbols in the blue field to the right.
The dotted diagonal line marks the points of equal upside price change forecasts derived from Market-Maker [MM] hedging actions and the actual worst-case price drawdowns from positions that could have been taken following prior MM forecasts like today’s.
Our principal interest is in LULU at location [5]. A “market index” norm of reward~risk tradeoffs is offered by SPDR S&P500 index ETF at [7].
Those forecasts are implied by the self-protective behaviors of MMs who must usually put firm capital at temporary risk to balance buyer and seller interests in helping big-money portfolio managers make volume adjustments to multi-billion-dollar portfolios. The protective actions taken with real-money bets define daily the extent of likely expected price changes for thousands of stocks and ETFs.
This map is a good starting point, but it can only cover some of the investment characteristics that often should influence an investor’s choice of where to put his/her capital to work. The table in Figure 2 covers the above considerations and several others.
Comparing Alternative Investment Details
Figure 2
blockdesk.com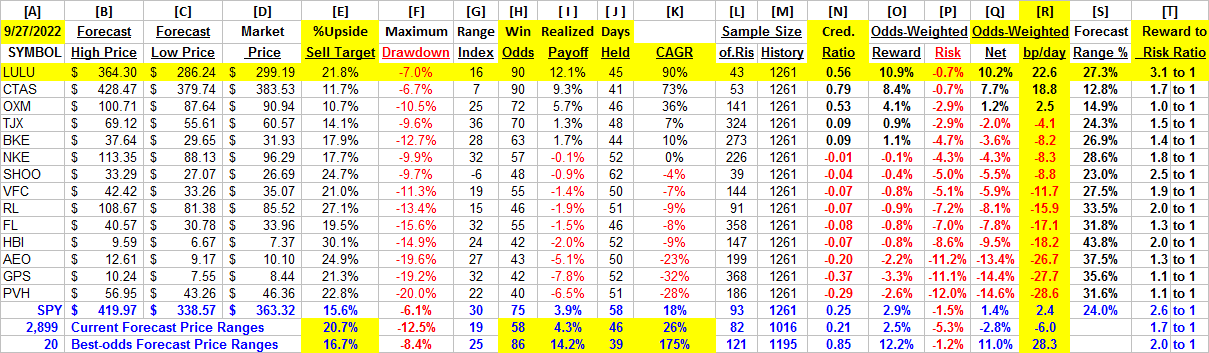
(Used with permission.)
Column headers for Figure 2 define elements for each row stock whose symbol appears at the left in column [A]. The elements are derived or calculated separately for each stock, based on the specifics of its situation and current-day MM price-range forecasts. Data in red numerics are negative, usually undesirable to “long” holding positions. Table cells with pink background “fills” signify conditions typically unacceptable to “buy” recommendations. Yellow fills are of data for the stock of principal interest and of all issues at the ranking column, [R].
Readers familiar with our analysis methods may wish to skip to the next section viewing price range forecast trends for LULU.
Figure 2’s purpose is to attempt universally comparable answers, stock by stock, of a) How BIG the price gain payoff may be, b) how LIKELY the payoff will be a profitable experience, c) how soon it may happen, and d) what price drawdown RISK may be encountered during its holding period.
The price-range forecast limits of columns [B] and [C] get defined by MM hedging actions to protect firm capital required to be put at risk of price changes from volume trade orders placed by big-$ “institutional” clients.
[E] measures potential upside risks for MM short positions created to fill such orders, and reward potentials for the buy-side positions so created. Prior forecasts like the present provide a history of relevant price draw-down risks for buyers. The most severe ones actually encountered are in [F], during holding periods in effort to reach [E] gains. Those are where buyers are most likely to accept losses.
[H] tells what proportion of the [L] sample of prior like forecasts have earned gains by either having price reach its [B] target or be above its [D] entry cost at the end of a 3-month max-patience holding period limit. [ I ] gives the net gains-losses of those [L] experiences and [N] suggests how credible [E] may be compared to [ I ].
Further Reward~Risk tradeoffs involve using the [H] odds for gains with the 100 – H loss odds as weights for N-conditioned [E] and for [F], for a combined-return score [Q]. The typical position holding period [J] on [Q] provides a figure of merit [fom] ranking measure [R] useful in portfolio position preferencing. Figure 2 is row-ranked on [R] among candidate securities, with EW in top rank.
Along with the candidate-specific stocks these selection considerations are provided for the averages of nearly 3000 stocks for which MM price-range forecasts are available today, and 20 of the best-ranked (by fom) of those forecasts, as well as the forecast for S&P500 Index ETF (NYSEARCA:SPY) as an equity market proxy.
Recent Trends in MM Price-Range Forecasts for LULU
Figure 3
blockdesk.com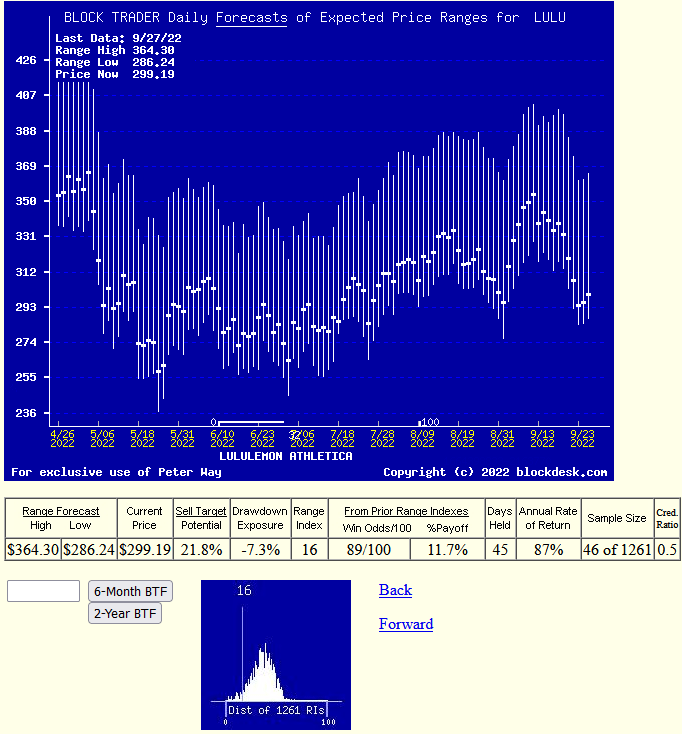
(Used with permission.)
This picture is not a “technical chart” of past prices for LULU. Instead, it is the past 6 months of daily price range forecasts of market actions yet to come in the next few months. The only past information there is the closing stock price on the day of each forecast.
That data splits the price range’s opposite forecasts into upside and downside prospects. Their trends over time provide additional insights into coming potentials, and helps keep perspective on what may be coming.
The small picture at the bottom of Figure 3 is a frequency distribution of the Range Index’s appearance daily during the past 5 years of daily forecasts. The Range Index [RI] tells how much the downside of the forecast range occupies of that percentage of the entire range each day, and its frequency suggests what may seem “normal” for that stock, in the expectations of its evaluators’ eyes.
Here the present level is near its least frequent, lowest-cost presence, encouraging the acceptance that we are looking at a realistic evaluation for LULU. With many past RIs above the present RI than below there is more room for an even more positive outlook.
Conclusion
Among these alternative investments explicitly compared Lululemon Athletica appears to be a logical buy preference now for investors seeking near-term capital gain.
Be the first to comment