

Thinkhubstudio
Dear Friends & Partners,
Our investment returns are summarized in the table below:
|
Strategy |
Month |
YTD |
12 Months |
24 Months |
Inception |
|
LRT Economic Moat |
12.36% |
-26.02% |
-21.18% |
+0.37% |
+20.75% |
| Results as of 11/30/2022. Periods longer than one year are annualized. All results are net of all fees and expenses. Past returns are no guarantee of future results. Please contact us if you would like to receive a full performance tearsheet. Please see the end of this letter for additional disclosures. |
November’s results were strong, and I expect continued good results in the months ahead. Our long positions significantly outperformed our hedges. Over the past few weeks, the market has continued to reward high quality companies, the types we are invested in, while low-quality, speculative types of investments continue to lag the overall markets (as we think they deserve to). As of September 1st, 2022, our net exposure was approximately 77.22%, and our beta-adjusted exposure was 49.81%. We currently have 57 long positions with the top 10 accounting for approximately 38.97% of our total long exposure.
Broad market indexes overall have had strong returns over the past six weeks. As a result, while I was wild bullish in my September letter to you, I have dialed back my optimism, as many areas of the market appear to reflect unrealistic expectations about their economic prospects. In particular, the semiconductor sector has rallied aggressively and now appears more than fully valued. What I find particularly troubling is the pervasive notion that capital expenditures on semiconductors and datacenters will continue to grow, seemingly without any limit, forever. It is hard to argue with the statement that “in the future we will need more computing power and more semiconductors”, but herein lies the problem – while this statement may be true in the longer term, it is no guarantee of an endless demand for computer hardware. In fact, I believe, that after what can only be called an “orgy” of capital expenditures from Corporate America on datacenters over the past three years, some pullback in spending seems likely. Below you can see the quarterly capital expenditures for the three largest US public cloud providers (Amazon, Microsoft, Google) and Facebook (Meta). I believe these Capex numbers to be a good proxy for the trends in semiconductor and datacenter expenditures. These are “real” numbers – deflated by CPI.
Real Capital Expenditures – Quarterly
Real Capital Expenditures – Quarterly (Source: Sentieo, U.S. Bureau of Labor Statistics)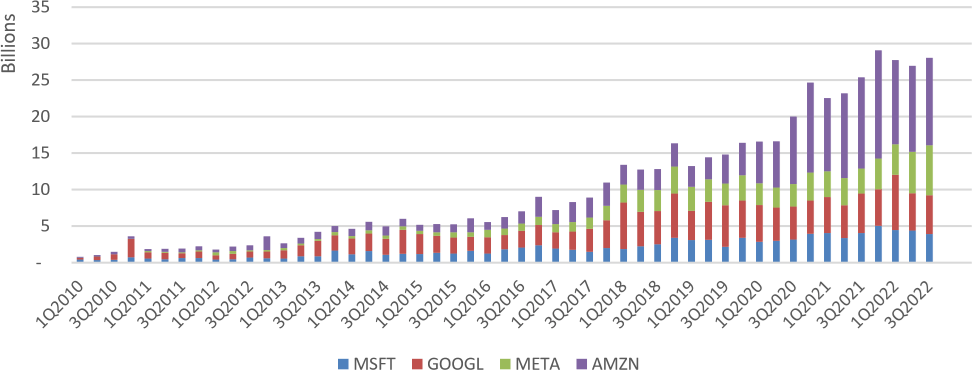
The picture these numbers paint is fairly clear: there has been an enormous increase in spending on capex by the largest U.S. Tech companies over the past decade. Yet investors appear to expect this trend to not only continue but accelerate. Take NVIDIA, the computer graphics and datacenter semiconductor company, which is projected to continue increasing revenues at a rapid pace, as seen in the graph below. A similar set of expectations appears to be embedded in the stock prices for many other semiconductor companies.
NVIDIA, Inc. Revenue (millions)
NVIDIA, Inc. Revenue (millions) (Source: Sentieo)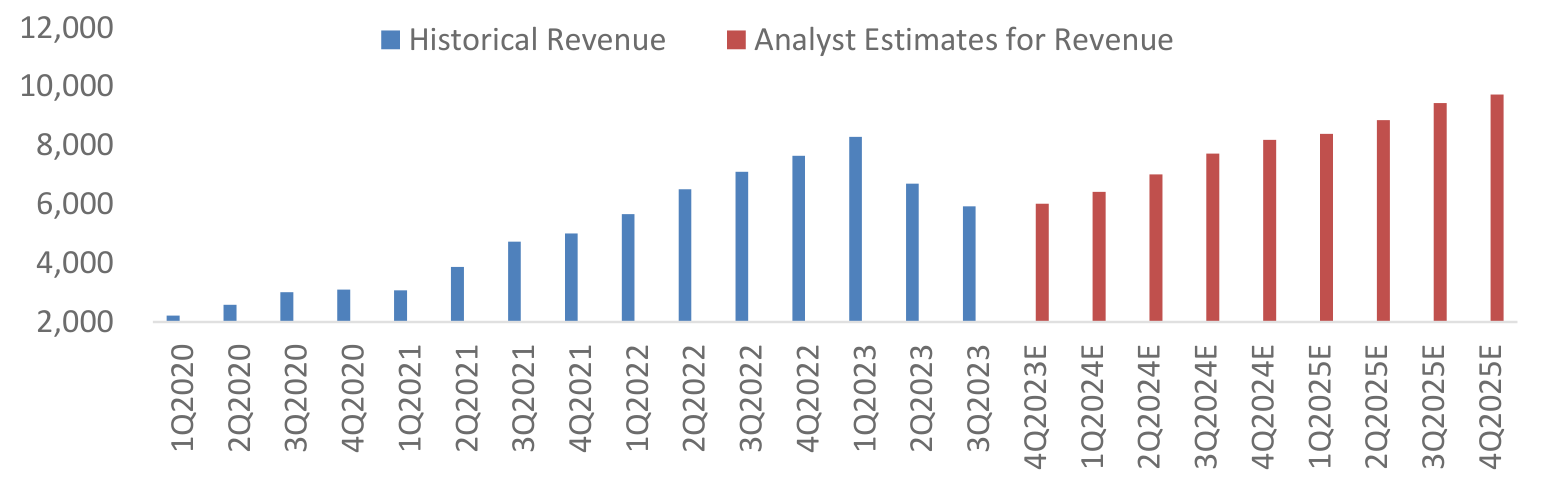
Semiconductor fabless companies (NVDA, AVGO, AMD, MRVL), equipment providers (ASML, AMAT, KLAC), and software providers (SNPS, CDNS), have had a great run over the past decade and investors typically extrapolate recent trends into the future. However, I believe that the U.S. economy is likely to experience a recession or at least a big slowdown in growth in the next twelve months. I expect such a slowdown to result in reduced business investment, as economic uncertainty leads corporations to reevaluate future demand and capex needs. Under such a scenario, accelerated spending on semiconductors appears unlikely. In fact, a mild U.S. recession is currently consensus thinking, which does not reconcile with continued rapid increases in revenue for a company like NVIDIA. Coupled with the fact that NVIDIA is currently valued at over 70x trailing earnings and an EV/Sales of over 22x, it is hard to see how investors in NVIDIA stock can expect a good outcome going forward.
We are currently long only one stock in the semiconductor sector, Taiwan Semiconductor Manufacturing Company Limited (TSM), a semiconductor fabrication company (Fab), which we purchased earlier this year when the stock was down nearly 50% from its all-time-highs and which I believe represents the best part of the semiconductor value chain at the most attractive valuation. I think of TSMC as a “picks and shovels” play on semiconductors – a winner irrespective of which fabless chip company is “hot” at any one time. I believe TSMC is one of strongest companies in the world due to its position as an invaluable partner in the semiconductor manufacturing process. TSMC is the only fab company in the world that manufactures 5nm chips. The company trades at a discount valuation to the broader market, which I attribute to geopolitical fears relating to China (TSMC manufactures its most advanced chips in Taiwan). However, these same fears apply to the company’s customers. Since NVIDIA, AMD, and a host of other companies are completely reliant on TSMC for 100% of their products, any disruption to TSMC’s operations would impact them as well. Yet, TSMC trades at a trailing valuation of 14x earnings, while NVIDIA and AMD trade at 70x and 45x, respectively. While there are many nuances and differences between the business models of TSMC and NVIDA, this valuation difference appears unjustified.
Mistakes Were Made
Learning from one’s mistakes is an integral part of improving one’s investment process. Our results over the past twelve months are below my expectations, and I have spent a significant amount of time studying my mistakes and learning from them to improve. There are several changes I have made that I expect will help deliver much better returns for our investment strategy in the months ahead. These changes may seem small and are a “evolution” rather than a “revolution”, reflecting the fact, that I believe, that our core strategy of focusing on high-quality companies, i.e., those possessing significant competitive advantages, is sound.
First, there is the issue of stock selection. During 2020, I invested a small part (approximately 5%) of our portfolio in companies of questionable long-term value. All these investments have been sold between December 2021 and February 2022. Specifically, I made small investments in Roku, Inc. (ROKU), Sea Limited (SE), Coupa Software Incorporated (COUP) and Cardlytics, Inc. (CDLX). The most glaring mistake in making these investments was ignoring their very high valuations. In each of the cases above, there was something special about the company that made me look towards other valuation methods, rather can simply looking at cashflow and earnings. Why did I do this?
Markets are forward looking, and often the greatest stock returns can happen when a company that is not profitable on easy to see metrics that are reflected in GAAP financial statements suddenly becomes GAAP profitable. For example, ServiceNow, Inc. (NOW) has delivered returns of over 29% annualized over the past decade, while being unprofitable from a GAAP perspective over the same period. Yet, investors who looked towards the company’s recurring revenues and understood its business model were handsomely rewarded. Hence it makes sense for investor to look for companies where GAAP financial accounting may not fully reflect economic reality.
In the case of Roku, Inc. (ROKU), for example, the company was transitioning away from hardware sales towards generating high margin recurring revenue as an ad-platform and seemed to have a bright future on this basis. In the case of Cardlytics, Inc. (CDLX), the business seemed to be moving in the right direction with an ever-growing number of advertising partners (banks) taking up the adoption of the company’s differentiated advertising / promotional system. In the case of Sea Limited (SE), the company’ investments in e-Commerce in new markets were depressing overall profitability. Finally, in the case of Coupa Software Incorporated (COUP), their SAAS business model was one where sales and marketing investments ran through the income statement giving a misleading picture of the company’s profitability.
In each of the above cases, one or more things went wrong. With the benefit of hindsight, all the above stocks were clearly overvalued, with the market already ascribing full value to things that were expected to happen in the future. This should have been clear to me, but in the atmosphere of “never sell” that prevailed in late 2020 almost any valuation became possible to justify. Secondly, there we subtle signs that the thesis in each of these investments was not playing out as expected. In Roku’s case it was the company’s move into original content that should have been a warning. In the case of Sea, it was the company’s seemingly endless expansion of its e-Commerce operation into new markets where the company was unlikely to have any advantage. In case of Coupa, it was the market seemingly ascribing all the potential value of Coupa Pay to the company immediately. Finally, in the case of Cardlytics, the company’s failure to roll out their self-serv advertising platform should have served as a warning that not all was well.
There are clear lessons from these mistaken investments, the biggest one being simply to focus a lot more on the valuation of the company and place less emphasis on the “possibilities” of the future. I sold all these investments between December 2021 and February 2022. Since selling Cardlytics, the stock has declined a further 90%, while Roku, Sea, and Coupa have all declined between 65% and 70%. This means we have avoided further losses. This is the second takeaway: sell and move on when things don’t work – in each case of course I wish I had sold even quicker. Lastly, because these four positions combined where under 5% of the capital invested, it made selling and moving on much easier as there were other positions in the portfolio that I had higher confidence in where capital could be reinvested. This is the last lesson I take away from this experience: stay diversified.
The second area of improvement for our investment strategy is the issue of being overexposed in one style / factor. At the beginning of 2022, our portfolio was too heavily focused on high quality and high growth companies. This may seem like a strange statement: after all, isn’t investing in high quality and high growth companies what our strategy is all about? In today’s markets there are many investment styles, and many outperform for a while, get over-crowded and then underperform for a while. In hindsight the quality + growth style of investing[2] was extremely high crowded at the beginning of 2022. It is my objective to deliver smooth investment returns over time with lower volatility that we have experienced historically. Doing so will require being more balanced on the growth to value spectrum, which in practice means including more companies in the portfolio that are relatively slow growing but trading at lower valuations. One example of this learning, and subsequent change to our strategy, is the inclusion of some defense companies in our portfolio, such as Northrop Grumman Corporation (NOC) – a relatively slow growing company that is currently our largest holding. We are also long shares of Lockheed Martin Corporation (LMT) and Booz Allen Hamilton Holding Corporation (BAH), the DoD focused consulting company – all of which are high quality but relatively slow growing companies. These changes may seem minor, but they should help our strategy deliver much more stable and less volatile returns in the future without sacrificing returns.
Third, and finally, I have made important updates to our hedging process. This is a highly technical issue that is best explained through an example. Take Domino’s Pizza, Inc. (DPZ) and imagine you are sitting on December 31st, 2021. You calculate the covariance of Domino’s to the S&P 500 index (the stocks beta) using daily return data going back five years and conclude the stock’s beta is 0.42 – much lower than the typical stock. If you had sold short $42 of the S&P index (SPY) for every $100 of Domino’s stock you were long, you would expect to be “market neutral” – have no exposure to movements of the S&P 500. Through the first six months of the year, the S&P 500 declined -19.98% (including dividends). Yet Domino’s declined -30.54% over the same time, much more than the predicted -8.39% according to the stock’s beta. You expected a beta of 0.42, and you experienced a beta of 1.53 – more than 3x what you thought would happen. I’m not picking on Domino’s here:[3] many similar high quality + high growth companies, experienced similar declines – far more than what their covariances to stock market indexes might have suggested. You can repeat this excessive with other companies and other indexes, and you will find the same thing: high quality + high growth companies declined a lot more than their betas would predict. So, what’s going on here?
Besides calculating a covariance between two asset classes you can calculate the explanatory power of the relationship – in other words: how confident you are about the relationship. If your historical data has big swings in the predictive power of the beta factor, your overall confidence in the explanatory power of the relationship declines. This is exactly what has happened over the past three years: the stability of many market relationships has deteriorated, and this can be seem particularly strongly in the relationship between the returns of growth stocks, value stocks, and the overall market. During the initial phase of the Covid-19 pandemic growth stock outperformed the market by a large margin: the Fed’s interest rate cuts affected their valuations more and many growth stocks were found in the Information Technology sector with many said companies benefiting from various economic lock-down policies and work-from-home trends. The opposite was true for many value stocks. In the second phase of the pandemic, when news of the efficacy of the Covid-19 vaccine became public, value stocks outperformed growth stocks by a wide margin. The degree of out/underperformance of these two groups of stocks in different time periods over the past three years has been amongst the largest in the historical record. The impact of this on a quantitative analysis of the relationship between different asset classes is a decline in the expected covariance between different stocks, indexes, etc. The problem one then faces is that of being underhedged when future declines occur.[4]
My solution to this dilemma has been to force our optimization system to always have a set amount of short (hedge) volatility in the portfolio, even if ex-ante that might appear to have been a suboptimal solution. This seemingly simple solution of the problem took me a long time to find, but I am confident it will result in meaningfully lower portfolio volatility in the future, without sacrificing performance. I realize this explanation may make your eyes glaze over and only be of interest to you if you are deep into quantitative portfolio construction, but I thought it important to give you a detailed explanation of the changes introduced to the strategy over the past year.
Individually the updates to security selection, better balancing the portfolio between growth and value, and a smarter hedging strategy may not seem like big changes, but collectively they add up to a big improvement. In summary, I continue to work hard to improve the performance and reduce the volatility of the LRT Economic Moat strategy within a systematic investment framework and I believe we will bounce back from our current drawdown in the months ahead. More importantly I expect much better risk mitigation going forward, while no sacrificing meaningful returns in process. Thank you for your support and patience.
Our Portfolio
The top ten investments in our portfolio as of 12/1/2022, in order of position size, are presented on the following pages. All valuation metrics and returns are as of 12/1/2022 unless otherwise stated. All graphs and data from Bloomberg and Sentieo.
The table below gives additional insight into our portfolio exposure. We continue to be dramatically underexposed in technology, communication, financials, and utilities, while being overexposed in industrials, consumer cyclicals, real estate and basic materials. These sector weightings are an outcome of where we currently see opportunities, and not a top-down decision based on macro predictions. We will happily own many technology companies if their valuations become more attractive.
|
Portfolio Statistics as of 12/1/2022[5] |
|||||
|
Sector Allocations (Long Exposure, %) |
|||||
|
S&P 500 Sector |
Portfolio |
S&P 500 |
Delta |
||
|
Consumer Cyclical |
26.47 |
10.59 |
15.88 |
||
|
Industrials |
24.21 |
8.69 |
15.52 |
||
|
Healthcare |
10.24 |
15.42 |
(5.18) |
||
|
Technology |
9.82 |
23.60 |
(13.78) |
||
|
Financial Services |
7.36 |
13.61 |
(6.25) |
||
|
Real Estate |
5.35 |
2.74 |
2.61 |
||
|
Basic Materials |
4.61 |
2.27 |
2.34 |
||
|
Communication Services |
4.31 |
7.36 |
(3.05) |
||
|
Energy |
3.92 |
5.37 |
(1.45) |
||
|
Consumer Defensive |
3.71 |
7.38 |
(3.67) |
||
|
Utilities |
– |
2.97 |
(2.97) |
||
|
Market Cap Allocations (%) |
|||||
|
Large |
38.22 |
||||
|
Mid |
49.36 |
||||
|
Small |
12.42 |
||||
|
Country Allocations (%) |
|||||
|
United States |
93.50 |
||||
|
Canada |
3.49 |
||||
|
Denmark |
3.01 |
||||
#1 Northrop Grumman Corporation (NOC)
Based in Virginia, Northrop Grumman is one of the world’s largest defense contractors with annual revenue more than $30 billion. The company operates in a cozy oligopoly, that after decades of consolidation the US defense market is now controlled by five large companies: The Boeing Company (BA), General
Dynamics Corporation (GD),Lockheed Martin Corporation (LMT), Northrop Grumman Corporation (NOC), and Raytheon Technologies Corporation (RTX). Industry barriers to entry are immense, government procurement cycles are extremely long, and the consolidated industry structure reflects this. This industry structure has allowed Northrop to earn stable mid-teens returns on invested capital (ROIC) and grow earnings per share at a rate of over 13% per year in the past decade, despite a topline that has grown only in-line with inflation. Even after the recent run-up in the stock price, it trades at approximately 15x, next year’s earnings estimates, far below the S&P 500 index, despite being an above average company. While nominally, there are five major defense contractors, the true industry concentration is even higher because not all companies compete in all possible business segments. General Dynamics’ division submarine division, Electric Boat, is the sole supplier of nuclear power submarines in the United States. Lockheed Martin is the sole supplier of the F-35 and F-22. Northrop was the sole bidder on the contract to develop the next generation of intercontinental ballistic missiles; and so on.
The company’s revenue growth over the past decade has been mediocre but even that has led to impressive shareholder returns that have far outpaced the S&P500. What’s more, we believe that revenue growth may accelerate in the next few years. A lot of ink spilled every year about the “massive” U.S. defense budget[6] that critics claim is “out of control”7. Given this, you might be surprised to hear that U.S. defense spending as a share of GDP is at the lowest level in recorded history,[7] at a mere 3.8%. In other words, U.S. military spending could double and not be out of line with historical norms. While we are not calling for a new Cold War, given the global instability we are witnessing, it is not unreasonable to expect defense spending to grow faster than GDP over the next decade.
Select Financial Metrics – Trailing Twelve Months
Select Financial Metrics – Trailing Twelve Months
#2 Domino’s Pizza, Inc. (DPZ)
Domino’s Pizza is the world’s largest franchisor of pizza restaurants with over 13,800 locations in 85 countries. As for any restaurant operator, the key metric to consider for Domino’s Pizza is same-store-sales (SSS) growth. Growing same-store-sales are ultimately how a restaurant business increases earnings from its existing assets. The company continues to impress in this criterion with SSS having grown in the U.S. for 40 consecutive quarters, and an astounding 109 straight quarters internationally.
Two-thirds of the company’s stores are currently abroad, and the international segment remains the company’s largest growth opportunity, as the penetration of convenient fast food remains lower abroad than in the United States. Pizza is a product with exceptionally high gross margins, one that “translates” well across different cultures, and one that literally “travels well”, not losing much of its appeal when delivered in a cardboard box. The rise of 3rd party delivery platforms such as Uber Eats, Doordash and Grubhub is challenging the pizza category as it has expanded the number of choices consumers have for convenient takeout. However, the economics of food delivery remain challenging for most restaurants and platforms alike[8], while pizza delivery continues to be highly profitable. Regardless of how the “delivery wars” currently playing out end, Domino’s financial results show little impact of this increased competition, and the company continues to deliver exceptional financial performance.
Domino’s Pizza stock is not optically cheap based on forward earnings; however, the company has routinely reported earnings growth of over 20% in almost all quarters since 2009. Given the company’s high growth rate, international growth opportunities, and capital light business model, which allows for returns on invested capital of over 40%, we are happy to continue to hold the shares.
Select Financial Metrics – Trailing Twelve Months
Select Financial Metrics – Trailing Twelve Months
#3 Marriott International, Inc. (MAR)
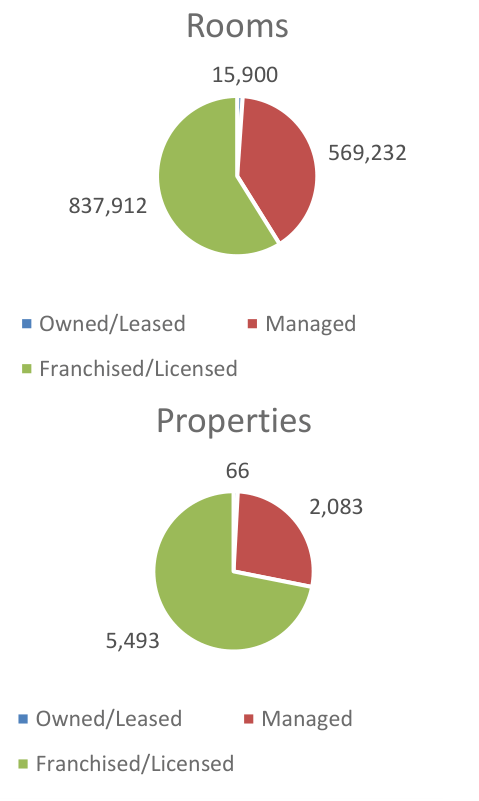
Marriott is the world’s largest hotel company followed closely by Hilton (HLT) and Intercontinental Hotels Group plc (IHG). The company owns a portfolio of brands from the low end (Courtyard, SpringHill Suites, Aloft), through the mid-tier (Marriott, Sheraton, Westin, Renaissance Hotels), to the luxury high end (JW Marriot, Ritz-Carlton, St. Regis). In total the company had 7,642 properties with over 1.4 million rooms as of the end of Q1 2021.[9]
The majority (85%) of Marriott’s revenue comes from hotels in the United States, with the rest almost evenly split between Asia Pacific and Europe. Like it’s smaller peer, Hilton, the company today is almost exclusively a manager and franchisor of hotels, not a hotel owner. The company owns 66 hotels, manages 2,083 and franchises 5,493. Like all franchise-based businesses Marriott requires very little capital to grow as it utilizes the investment capital of its hotel-owners/partners to expand.
Marriott currently faces a difficult operating environment due to the Covid-19 pandemic and uncertainty about the future of business travel. However, the company is an excellent operator with a somewhat leveraged capital structure (the company acquired Starwood Properties in late 2016) – if pent-up demand for travel materializes post-Covid, as we expect it will, the company will quickly go from losing money to raking in profits.
Select Financial Metrics – Trailing Twelve Months
Select Financial Metrics – Trailing Twelve Months (Source: Marriott, 10-K/A, 02-Apr-21)
#4 Murphy USA Inc. (MUSA)
We have held a position in Murphy USA for several months and have recently increased it, making it a top ten name in the portfolio. The company is a gas station operator and was spun-off from Murphy Oil in 2013. Murphy USA operates 1,700 stores primarily in Walmart parking lot locations and owns the underlying real-estate.
What makes Murphy USA distinct from other convenience store operators such as Casey’s General Stores, Inc. (CASY) and Alimentation Couche-Tard Inc. (ATD:CA)[10], is the company’s focus on high volumes of gasoline sales[11] and a minimal amount of convenience store sales. Fuel sales account for close to 60% of gross profit, a big difference from a typical convenience store, where fuel is close to 25% of profits. Most locations have a very small store of approximately 500sqft only.
In December 2020, Murphy USA purchased QuickChek, a chain of 157 stations in New Jersey and New York with an average store size of 5,500 sq. ft. which will strengthen the company’s food offering and expand the company’s focus into larger store formats.
The industry Murphy USA operates is attractive because of rising fixed costs of operations which are squeezing smaller and less well capitalized players, leading to industry consolidation. While the advent of electric cars may mean less gasoline sales in the future, we continue to believe that the transition to electric vehicles will take a lot longer than most analysts believe.
The company has been using all the available cashflow to repurchase shares, a value-creating activity, as we view the shares as undervalued.
Select Financial Metrics – Trailing Twelve Months
Select Financial Metrics – Trailing Twelve Months
#5 Asbury Automotive Group, Inc. (ABG)
Asbury Automotive Group is one of the largest automotive retailers in the United States. It operates 90 dealerships consisting of 112 franchises and 25 collision repair centers. The company’s stores offer new and used vehicles, parts, and services, as well as finance and insurance (F&I) products. Franchise agreements controlled by automotive manufactures and state laws create an environment of tightly controlled market entry and restricted competition.
The dealership industry is highly fragmented with 93.5% of dealers having only between 1-5 locations according to data from 2020[12]. In fact, dealers with over 50 locations account for only 0.1% of the industry – a testament to the huge opportunity for consolidation that lies ahead. Industry dynamics, including the rising complexity of automobiles and the need for omnichannel distribution are favoring better capitalized and larger dealer groups. We believe Asbury Automotive Group has several distinct advantages, particularly its highly profitable parts and service business, its overexposure to the luxury vehicle business, which carries the best margins, and its Clicklane omnichannel strategy. Asbury’s management has also been acting in the best interests of its shareholders by allocating capital towards acquiring dealerships to aggressively expand its business, and occasionally repurchasing stock when attractive acquisitions targets could not be found.
ABG is not a fast-growing SaaS business, but when paying a valuation of ¼ of the overall stock market, one does not need to make heroic assumptions about the future to enjoy strong returns as shareholders. We believe that over the next several years, Asbury will continue to acquire dealerships, occasionally buy back stock and invest to improve its digital shopping experience. We wrote about Asbury in detail in our August 2021 Investor Letter.[13]
Select Financial Metrics – Trailing Twelve Months
Select Financial Metrics – Trailing Twelve Months
#6 Texas Pacific Land Trust (TPL)
Long time readers will know that we rarely invest in commodity businesses. However, there are periods in the market where commodity-based businesses outperform the broad indexes by a wide margin. Therefore, to have balance in the portfolio, we have long searched for a competitively advantaged company in the commodity space. We believe that Texas Pacific Land Trust (TPL), meets that criterion. Formed out of assets of formerly bankrupt railroads, TPL controls the largest acreage of land in the Permian basin – the center of the US shale oil industry. The company has two main sources of income: 1) royalties from oil & gas extracted on its properties – essentially a free call option on future oil prices and production; and 2) a water business which develops water resources and sells services to the fracking industry. We see TPL as an effective way to diversify the portfolio into a commodity exposed business that has a history of smart capital allocation and low risk of financial distress during periods of low oil prices. The company has no debt, and $281 million in cash.[14]
The company uses most of its cash flows to pay dividends and repurchase shares.
Select Financial Metrics – Trailing Twelve Months
Select Financial Metrics – Trailing Twelve Months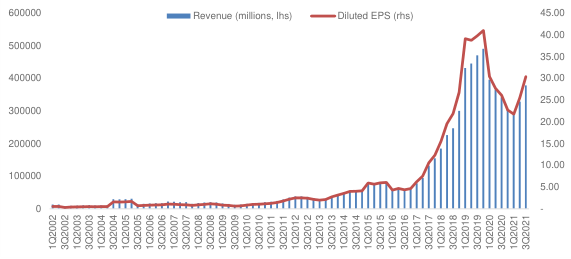
#7 Aspen Technology, Inc. (AZPN)
Aspen Technology is a software company specializing in industrial automation technologies. The company’s software helps customers optimize assets, operations and maintenance in complex environments, primarily in the oil & gas industry. The energy industry represents 41% of the company’s top line, followed by the chemical industry at 28% and engineering and construction at 25%. In particular, Aspen software is used to operate refineries; with nineteen of the twenty largest refineries in the world as their customers. The company has a broadly diversified customer base with over 2,000 clients and 60% of its revenue coming from outside the United States.
Aspen Technology has recently completed a complex acquisition of assets from Emerson Electric, acquiring Emerson’s software assets, and thus broadening its portfolio of products and services. Normally we are very skeptical of “transformative” acquisitions, but in this case, we like the transaction because we believe it was done at a very attractive valuation. We expect cost synergies from this acquisition to accrue to the company over the next few quarters.
Aspen Technologies’ software has an extremely high switching cost, as it helps optimize the operations of complex industrial firms that usually operate with very thin margins. Reducing capital intensity and working-capital needs that ultimately leads to higher margins is of great value for industrial firms. For example, an oil refinery may cost in excess of $10 billion USD and five years to construct. Once constructed, a refinery operates 24 hours a day nearly every single day of the year. Thus, efficient operations and the reliability of the software used is of paramount importance. The evidence of this high switching cost is the company’s very high customer retention (over 95%) and returns on invested capital routinely exceed 40%.
Select Financial Metrics – Trailing Twelve Months
Select Financial Metrics – Trailing Twelve Months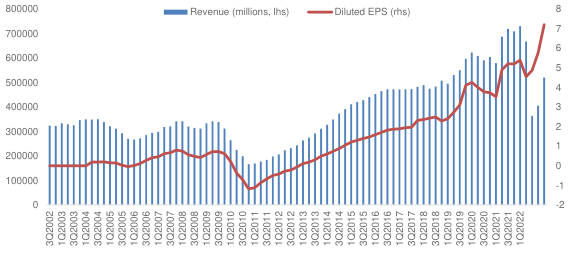
#8 Progressive Corp. (PGR)
Progressive is a leading U.S. auto insurer that has pioneered telemetrics as a source of differentiation in its underwriting and it operates through a direct (non-agency) sales model. We believe that the company’s sales model, which is still the minority model in the industry confers on the company a durable process-based cost advantage that has allowed the company to deliver industry leading combined ratios (a standard measure of profitability in the insurance industry).
The company has plenty of room to grow and take market share from players such as State Farm, Farmers and Nationwide. The cost advantages conferred by the direct sales model are unstoppable, and the scale advantages the company has in advertising and other customer acquisition costs furthers its strong competitive position. We believe the industry structure is going to evolve towards a duopoly with Progressive and GEICO as the two main players.
While we do not believe telemetrics itself confers any competitive advantage as it is a technology that has been copied by other players, Progressive is a very innovative company, and it has evolved from being an insurer for the highest risk drivers to one that now targets the general population. GEICO on the other hand began its life as an insurer for the best drivers and has now evolved in the direction of insuring everyone. On the surface the companies are similar, but their different pasts continue to shape their corporate cultures and are evident in subtle ways in their decision-making processes around expense management and claims processing.
The company has a very conservative investment portfolio with over $44 billion in fixed income securities.[15] 75% of their portfolio is held in securities with a duration of under five years, which means that an increase in interest rates will benefit the company as the portfolio will relatively rapidly reprice into higher yielding securities.
Select Financial Metrics – Trailing Twelve Months
Select Financial Metrics – Trailing Twelve Months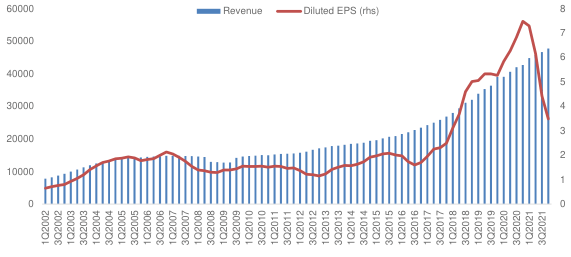
#9 AO Smith Corp. (AOS)
A.O. Smith is the largest US manufacturer of residential and commercial water heaters, boilers and water treatment products. The company generates close to $3 billion in annual sales. The majority of the company’s business (73%) is done in North America, with the balance coming from China and India. Approximately 80% of demand is replacing existing heaters and 20% is tied to new construction. The company continues to benefit from a shift towards higher efficiency, but more expensive, tankless heaters.
A.O. Smith generates returns on invested capital in the high teens. The company uses its earnings to consistently grow its dividends and share repurchases. Over the past three years the company’s performance has been hurt by its exposure to China as its business there suffered due to the US-China trade war and poor execution. We believe the China business is back on track and the all-important US business is doing better than ever as housing demand heats up in the US. The company beat earnings estimates over the past several quarters and is currently enjoying very good performance as the hot U.S housing market continues to be strong.[16] A.O. Smith also recently increased its share repurchase authorization.
Select Financial Metrics – Trailing Twelve Months
Select Financial Metrics – Trailing Twelve Months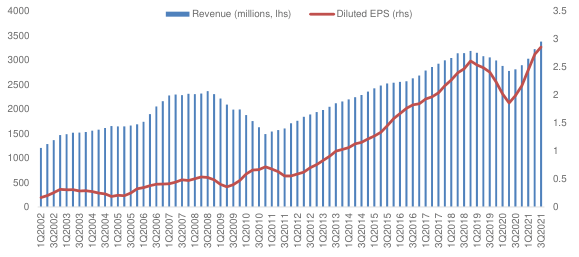
#10 – Novo Nordisk A/S (NVO)
Novo Nordisk is the global leader in insulin, which is, sadly, a growing business as more and more people around the world suffer from diabetes. Just in the United States over 37 million American have diabetes, 4 million have intensive diabetes (require both fast and slow acting insulin), and 96 million are pre-diabetic – over 10% of the population.[17] Around the world, millions more suffer from this disease and need daily injections of insulin to stay alive[18], a number that, unfortunately, is likely to continue to grow by millions more in the coming decade.
It may seem at first glance that insulin should be a commoditized business, after all, it was discovered and synthesized over a hundred years ago, but nothing could be further from the truth. There are many types of insulin and Novo Nordisk has spent billions on R&D over the years to develop new products.
What’s more, Novo Nordisk has recently expanded beyond insulin. The company’s new drug, Wegovy (semaglutide) which acts on hormones regulating appetite (GLP-1 specifically) has already achieved sales of more than $1 billion per year, and the company expects sales to be close to $4 billion per year by 2025.[19] Just like insulin, Wegovy is not a cure, but rather a lifelong treatment aimed at helping people reduce their body weight.[20] This means long and predictable revenues for Novo Nordisk.
Regrettably, lifestyle diseases like Type 2 diabetes and obesity are likely to only grow in the years ahead, providing even more patients and more revenue to Novo Nordisk. The company’s proprietary product line supports returns on invested capital of over 40%, and while sales growth is relatively slow (+6.2% annualized CAGR over the past decade), this has translated into very strong returns for shareholders. The company currently appears richly valued, but some of this relates to the supply problems for its new drug Wegovy that Novo Nordisk experienced in early 2022. As these supply problems appear to now be resolved, we expect the company’s profitability will increase sharply in the months ahead.
Select Financial Metrics – Trailing Twelve Months
Select Financial Metrics – Trailing Twelve Months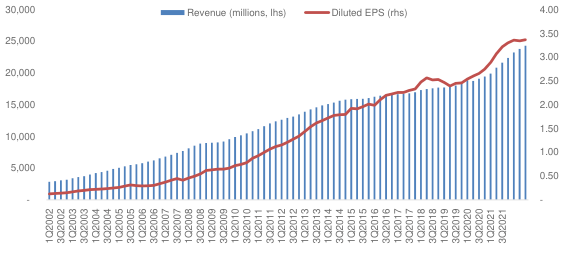
As always, I look forward to hearing from you and answering any questions you might have. Thank you for your continued interest and support.
Lukasz Tomicki, Portfolio Manager LRT Capital
Footnotes[1] Source: Sentieo [2] I am using the term “style” where others would say “factor”. [3] I picked Domino’s specifically because it was our largest holding going into 2022 and because the company did not experience any meaningful idiosyncratic events – no management change, strategy change or corporate takeover. [4] This is in fact the simplest explanation I can give you. Feel free to call me for a more technically minded explanation. [5] Source: Morningstar, Sentieo. [6] It’s Time to Rein in Inflated Military Budgets, https://www.scientificamerican.com/article/its–time–to–rein–in–inflated–military–budgets/ 7 U.S. Military Spending is Out of Control, https://www.bloomberg.com/opinion/articles/2021–12–27/pentagon–budget–militaryspending–is–getting–out–of–hand [8] DoorDash lost $312 million in Q4, 2020. Source: DoorDash, 8-K Earnings, Update, 25-Feb-21 [9] Source: Marriott, 10-K/A, 02-Apr-21 [10] The owners of the Circle K brand. [11] The average Murphy USA store sells close to 3 million gallons of fuel per year, 75% more than the industry average. [12] NADA Data [13] https://www.lrtcapital.com/wp–content/uploads/2021/09/2021–08–August–Investor–Update.pdf [14] Source: TPL, Investor Presentation March 2021, 02-Mar-21 [15] As of September 30th, 2021. Source: PGR 10-Q FY21 Q3. [16] A. O. Smith surges on 3Q earnings beats; raises full-year outlook; https://seekingalpha.com/news/3760153–a-o-smith–surges–on3q–earnings–beats–raises–full–year–outlook [17] https://www.cdc.gov/diabetes/library/spotlights/diabetes–facts–stats.html [18] According to the WHO there are 422 million diabetics worldwide. This is estimated to increase to over 570 million by 2030. [19] https://www.fiercepharma.com/pharma/novo–nordisks–wegovy–lifts–2025–obesity–sales–target–37b [20] https://www.ft.com/content/96a61dc0–249a–4e4e–96a2–2b6a382b7a3b |
Disclaimer and Contact InformationLRT Capital Management, LLC is an Exempt Reporting Adviser with the Texas State Securities Board, CRD #290260. Past returns are no guarantee of future results. Results are net of a hypothetical 1% annual management fee (charged quarterly) and 20% annual performance fee. Individual account returns may vary based on the timing of investments and individual fee structure. This memorandum and the information included herein is confidential and is intended solely for the information and exclusive use of the person to whom it has been provided. It is not to be reproduced or transmitted, in whole or in part, to any other person. Each recipient of this memorandum agrees to treat the memorandum and the information included herein as confidential and further agrees not to transmit, reproduce, or make available to anyone, in whole or in part, any of the information included herein. Each person who receives a copy of this memorandum is deemed to have agreed to return this memorandum to the General Partner upon request. Investment in the Fund involves significant risks, including but not limited to the risks that the indices within the Fund perform unfavorably, there are disruption of the orderly markets of the securities traded in the Fund, trading errors occur, and the computer software and hardware on which the General Partner relies experiences technical issues. All investing involves risk of loss, including the possible loss of all amounts invested. Past performance may not be indicative of any future results. No current or prospective client should assume that the future performance of any investment or investment strategy referenced directly or indirectly herein will perform in the same manner in the future. Different types of investments and investment strategies involve varying degrees of risk-all investing involves risk-and may experience positive or negative growth. Nothing herein should be construed as guaranteeing any investment performance. We do not provide tax, accounting, or legal advice to our clients, and all investors are advised to consult with their tax, accounting, or legal advisers regarding any potential investment. For a more detailed explanation of risks relating to an investment, please review the Fund’s Private Placement Memorandum, Limited Partnership Agreement, and Subscription Documents (Offering Documents). This report is for informational purposes only and does not constitute an offer to sell, solicitation to buy, or a recommendation for any security, or as an offer to provide advisory or other services in any jurisdiction in which such offer, solicitation, purchase, or sale would be unlawful under the securities laws of such jurisdiction. Any offer to sell is done exclusively through the Fund’s Private Placement Memorandum. All persons interested in subscribing to the Fund should first review the Fund’s Offering Documents, copies of which are available upon request. The information contained herein has been prepared by the General Partner and is current as of the date of transmission. Such information is subject to change. Any statements or facts contained herein derived from third-party sources are believed to be reliable but are not guaranteed as to their accuracy or completeness. Investment in the Fund is permitted only by “accredited investors” as defined in the Securities Act of 1933, as amended. These requirements are set forth in detail in the Offering Documents. |
Appendix
Editor’s Note: The summary bullets for this article were chosen by Seeking Alpha editors.
Be the first to comment