

ijeab/iStock via Getty Images
Dear Friends & Partners,
Our investment returns are summarized in the table below:
|
Strategy |
Month |
YTD |
12 Months |
24 Months |
Inception |
|
LRT Economic Moat |
-7.49% |
-33.12% |
-22.26% |
+6.85% |
+20.66% |
Results as of 5/31/2022. Periods longer than one year are annualized. All results are net of all fees and expenses. Past returns are no guarantee of future results. Please contact us if you would like to receive a full performance tearsheet. Please see the end of this letter for additional disclosures.
As of June 1st, the net exposure in the LRT Economic Moat Strategy was approximately 85.27%. May’s results for the LRT Economic Moat Strategy were below my expectations. The month began very well, but the good performance of many of our holdings during the first week of May was reversed in the weeks that followed. I believe that all these short-term losses will be recovered in the next few weeks. The main detractors this month included: Target Corp. (TGT), Deere & Company (DE) and Public Storage (PSA).
In my December letter to you when describing my expectations for the year, I wrote that if inflation were to surprise to the upside and commodity prices were to rise sharply, our strategy would underperform as we do not invest in commodity companies. This is exactly what has happened. Year-to-date every market sector is down sharply, except energy and select commodity stocks. These are two sectors that we deliberately do not invest in and continue to avoid. We also deliberately avoided many technology / bubble stocks and had anticipated the sharp declines that such shares have experienced in the past few months.1 Moreover, we expected, incorrectly, that shares of profitable, high-quality companies, that we typically invest in would be spared the worst declines. While the average portfolio holding of ours has declined less than the ARK Innovation ETF (ARKK), there have been many severe declines in our portfolio this year, despite very strong operating performance of the underlying companies.
What’s more, 2022 has been extremely unusual in that stocks and bonds declined together, a feat that has not occurred in fifty years. Historically an investor with 60% in stocks and 40% in bond experienced lower volatility because the 40% bond position in his portfolio acted as a form of “fire insurance” – bonds tended to rise during periods of stock market weakness. Not so in 2022. In fact, one might argue that bonds this year have not only not been a form of “fire insurance” but have acted as an “arsonist” setting the rest of the portfolio on fire. While this does not directly affect our portfolio, it has an indirect impact as higher long-term rates make stocks less attractive, and especially high-quality growth stocks – the type we focus on.
Finally, this year. The bottom line is that we went into this current downturn with too much net and gross exposure, and this, combined with the once-in-50-years simultaneous decline in stocks and bonds in tandem has resulted in lackluster year-to-date performance.
Now the good news. We continue to hold a portfolio of excellent companies that remain very profitable, and which will continue to grow their businesses over time. Many of our portfolio companies are also buying back shares which will be of great benefit to us in the long-term as current market prices are depressed. To paraphrase Warren Buffett, time is the friend of a high-quality business investor. All we must do is wait patiently. I am extremely confident about the strong long-term prospects for all of our portfolio companies and for our strategy overall. Our current portfolio is full of “coiled springs”, and I expect a very strong rebound in the months ahead. Every past market “crash”, and in a number of our portfolio holdings the last few months can certainly be called a “crash”, has led to a strong rebound in the months that followed. I believe that this time will be no different.
In the long run, staying our course through substantial volatility will make the market our servant, not our master. For many years, I have listened to investors who had hopped for large declines in stocks, wanting to buy them at a discount, yet now I hear the same investors express disdain that such declines have occurred.[1] This is the time to be accumulating shares in great companies, not running away from the market in fear. The wealth of tomorrow will be in the hands of the net buyers of today.
In the interest of time, today’s letter is a bit shorter than usual. I plan to return to the long format next month. As always, I look forward to hearing from you and answering any questions you might have. Thank you for your continued interest and support.
Lukasz Tomicki
Portfolio Manager, LRT Capital
Appendix I: Attributions and Holdings as of 5/2/2022
| LRT Economic Moat | |
| Top Holdings (%) | |
| Domino’s Pizza, Inc. (DPZ) | 5.0 |
| Marriott International, Inc. (MAR) | 4.6 |
| Asbury Automotive Group, Inc. (ABG) | 4.0 |
| Hexcel Corp. (HXL) | 4.0 |
| Northrop Grumman Corporation (NOC) | 3.9 |
| Booking Holdings Inc. (BKNG) | 3.8 |
| Texas Pacific Land Trust (TPL) | 3.8 |
| Repligen Corporation (RGEN) | 3.7 |
| Progressive Corp. (PGR) | 3.6 |
| Deere & Company (DE) | 3.4 |
| Top Holdings Total | 39.9 |
| Portfolio Statistics | |||
| Sector Allocations (Long Exposure) | |||
| Sector | Portfolio | S&P 500 | Delta |
| Industrials | 25.87 | 8.15 | 17.72 |
| Consumer Cyclical | 23.98 | 11.84 | 12.14 |
| Healthcare | 11.13 | 13.7 | -2.57 |
| Real Estate | 8.44 | 2.72 | 5.72 |
| Technology | 8.42 | 25.59 | -17.17 |
| Consumer Defensive | 8.25 | 6.5 | 1.75 |
| Financial Services | 7.45 | 13.19 | -5.74 |
| Energy | 4.63 | 3.87 | 0.76 |
| Communication Services | 1.83 | 9.36 | -7.53 |
| Utilities | – | 2.74 | -2.74 |
| Basic Materials | – | 2.34 | -2.34 |
| Hedges (%) | |
| Vanguard Mid-Cap ETF (VO) | -12.77 |
| Vanguard Small-Cap ETF (VB) | -11.7 |
| iShares Core S&P Mid-Cap (IJH) | -11.3 |
| SPDR S&P MidCap 400 ETF (MDY) | -11.3 |
| iShares Russell 2000 (IWM) | -10.9 |
| iShares Core S&P Small-Cap (IJR) | -10.7 |
| Return Attribution (%) | |
| Long Equity | -2.5 |
| Hedges | -0.3 |
| Unlevered Gross Return | -2.7 |
| Leveraged Gross Return | -7.4 |
| Net Return | -7.5 |
| Market Cap Allocations (%) | |
| Large | 35.66 |
| Mid | 50.4 |
| Small | 13.94 |
| Country Allocations (%) | |
| United States | 94.1 |
| Canada | 4.52 |
| Denmark | 1.42 |
Source: Morningstar, Sentieo.
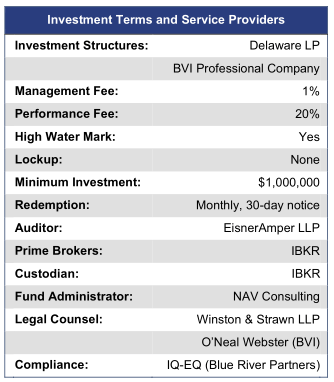
Net returns are net of a hypothetical 1% annual management fee (charged quarterly) and 20% annual performance fee. Individual account results may vary due to the timing of investments and fee structure. Please consult your statements for exact results. Please see the end of this letter for additional disclosures.
Appendix II: Investment Philosophy
Over the past 36 months, we saw a large increase in the number of LRT Capital partners (the term we use to describe our clients). With so many newcomers, it is important that we write about our investment philosophy again.
Here are the key points:
- Exceptional stock returns come from exceptional business returns on a per-share basis.
- We seek to invest in high-quality companies, i.e., those possessing sustainable competitive advantages (moats), the ability to grow and reinvest capital over time, and management that excels at capital allocation.
- We only purchase companies whose shares trade at a discount to our assessment of their intrinsic value.
- It is futile to predict short-term market movements. We seek to hold our investments for as long as possible.
- The financial markets are dominated by short-term traders who see stocks as casino chips. This occasionally allows us to purchase shares in great companies at large discounts to their true worth.
- If we are right about the trajectory of the businesses we invest in, over time, we will be right on the trajectory of their stock prices.
We view stock market volatility as a source of opportunity. Volatility allows us to profit by acquiring shares in superb businesses at attractive prices. The more that markets (the “other” participants) are irrational, the more likely we are to reach our ambitious performance objectives.
In the long run, stocks are the best investment asset class, but our experience has taught us that our investment process will not generate linear returns. In some years, our portfolio will outperform, and in others, it will generate a below average return. This is a certainty that we must accept. We are long-term investors and we do not try to dance in and out of the market.
In summary, our investment strategy can be summed up in three steps:
- Only seek out high-quality companies.
- Do not overpay.
- Do nothing – patience and discipline are the keystones to success.
Appendix III: Portfolio Construction Software Overview
LRT separates the discretionary and qualitative process of selecting the equity holdings from the portfolio construction process which is systematic and quantitative.
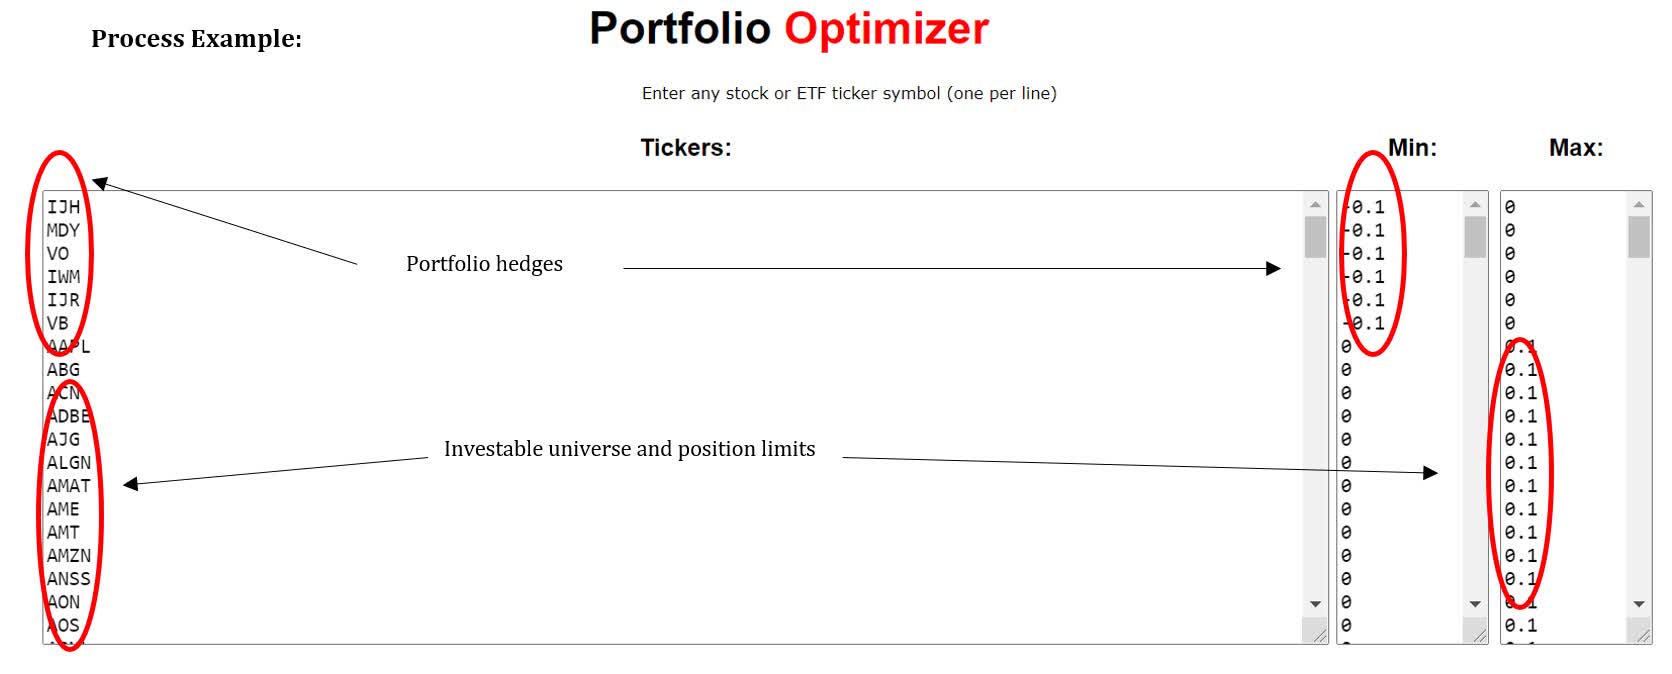
Our quantitative process considers each position’s contribution to portfolio volatility, contribution of idiosyncratic vs. systematic risk and portfolio factor (size, value, quality, momentum, vol, etc.) exposures.
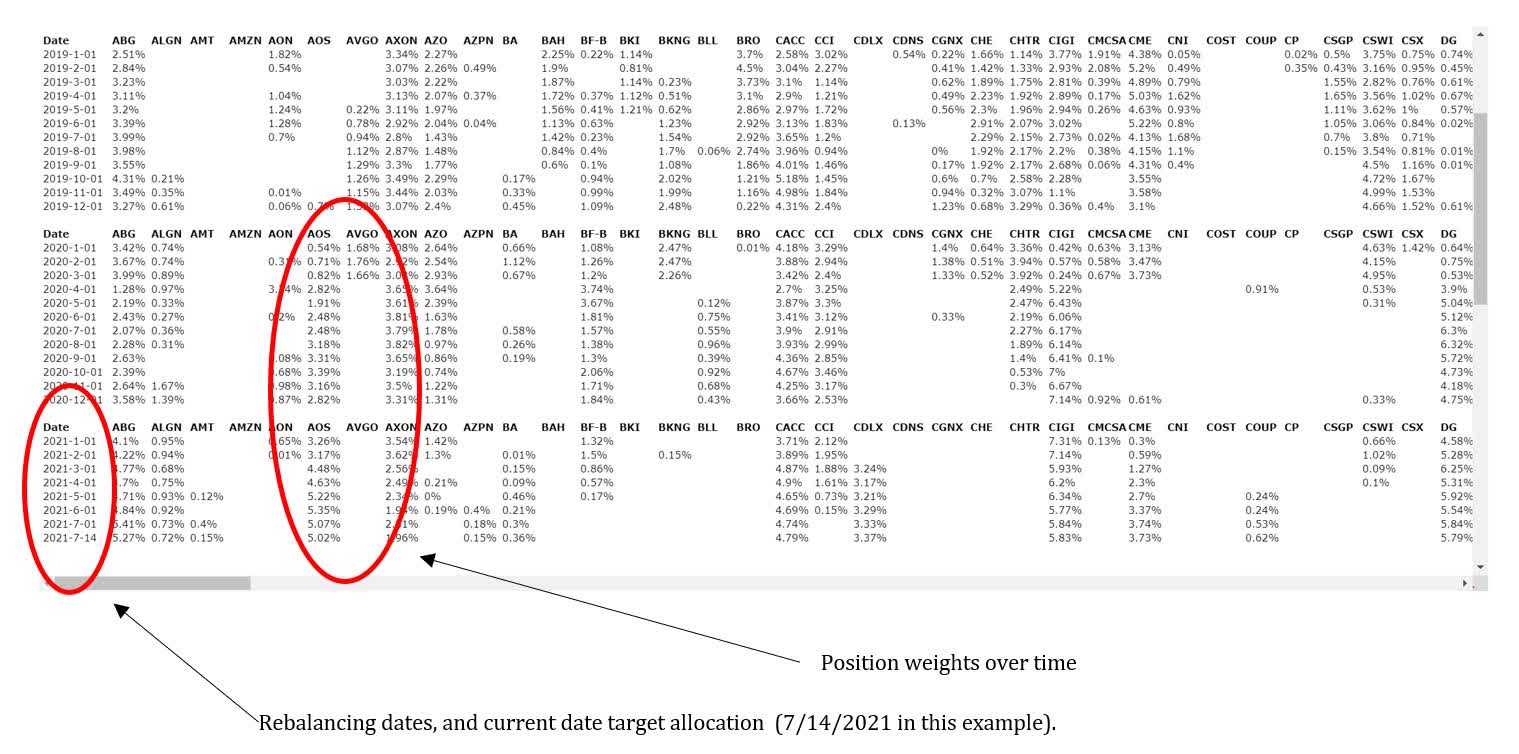
The system outputs target portfolio weighs for each position. We trade mechanically to rebalance the portfolio each month to the targeted exposures. This eliminates emotions, human biases, and overconfidence risk.
Example system output:
Footnotes
1 As exemplified by ARK Innovation ETF (ARKK), down over 72% since its peak last year, as of 6/1/2022.
2 Just to name a few companies down more than 40% year-to-date: Netflix, Inc. (NFLX), Align Technology Inc. (ALGN), PayPal Holdings, Inc. (PYPL), Masimo Corporation (MASI).
Editor’s Note: The summary bullets for this article were chosen by Seeking Alpha editors.
Be the first to comment