

Galeanu Mihai
A couple of weeks back, we promised to “share extracts from our weekly reviews.” This article, taken from an analysis originally published for Wheel of Fortune’s subscribers on Nov. 28, is part of that effort.
——————————————————————————–
Yes to Value, No to Growth
Recall that after the nifty-fifty and dotcom bubble bursts, Value outperformed Growth for a few years.
We believe there’s no reason why we wouldn’t see a similar pattern following the COVID-induced free money 2022-2023 tech bubble burst.
TopDown Charts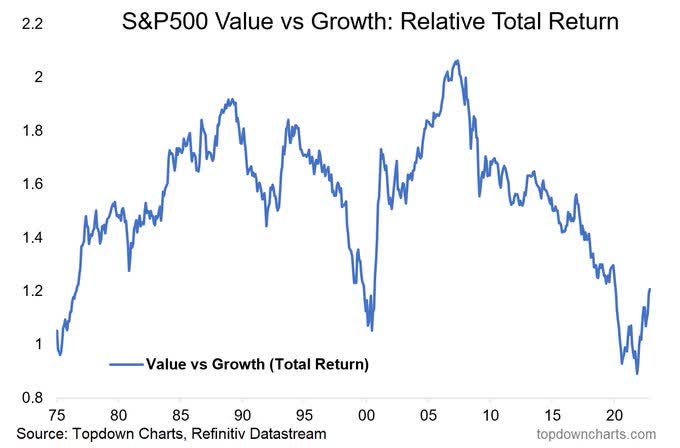
Big No to Big Tech
The dismal performance of mega caps, aka Big Tech, is yet another ominous, clearly bearish, sign for the overall market.
We expect the red line to keep marching lower, and we find it hard to expect the while line to keep heading higher when Big Tech heads south.
Crescat Capital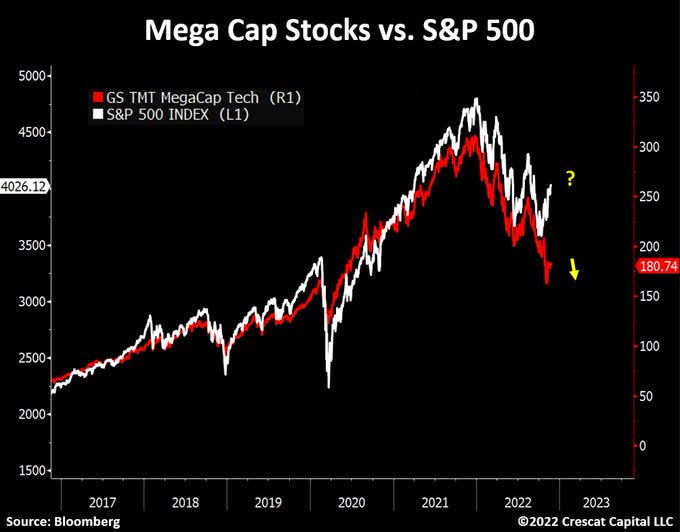
(High-Grade) Bonds > Stocks
In times of stress and uncertainty investors require and deserve a higher equity risk premium to compensate for the higher (market/investing) risk.
As of now, investors aren’t being compensated (enough) for taking on equity risk above and beyond bonds.
Having said that, we still wish bonds to be (even-) more attractive relative to stocks that they’re already.
Societe Generale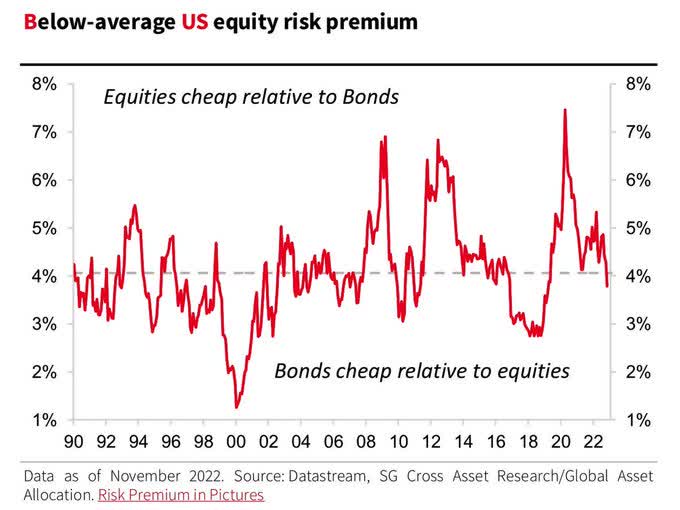
Neither the large migration into cash (in early 2020) nor the more gradual flows into equities (in late 2020 and 2021) has yet been unwound.
On the other hand, bonds have been under selling pressure in light of the asset-class worst performance in history.
BoA
Over the past year, foreigners have been rotating out of equities and into bonds.
So should you. [Even if you’re not a foreigner…]
Soon.
Charles Schwab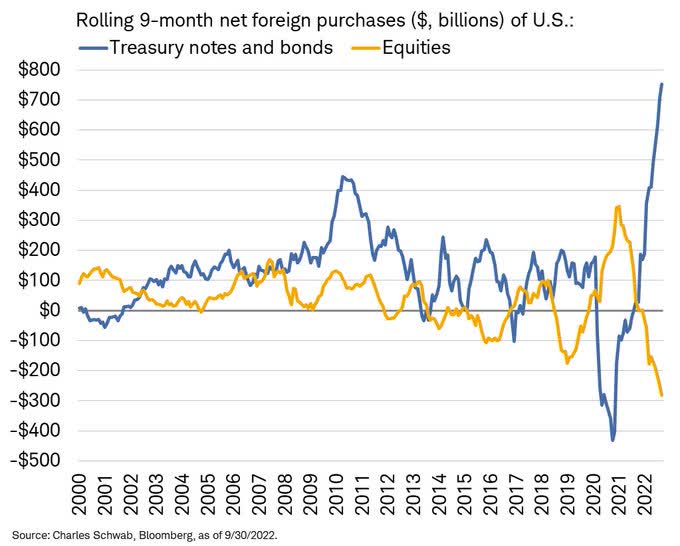
Invest/High-Grade ETF Space
There are many investment/high-grade bond ETFs, with the largest ones being (in that order) [Emphases of tenor/duration in the ETFs’ names are ours]:
- Vanguard Short-Term Corporate Bond ETF (VCSH)
- Vanguard Interm-Term Corp Bd ETF (VCIT)
- iShares iBoxx $ Investment Grade Corporate Bond ETF (NYSEARCA:LQD)
- iShares 1-5 Year invmt Grd Corp Bd ETF (IGSB)
- iShares 5-10 Year invmt Grd Corp Bd ETF (IGIB)
- iShares Broad USD Invm Grd Corp Bd ETF (USIG)
- SPDR® Portfolio Short Term Corp Bd ETF (SPSB)
- SPDR® Portfolio Interm Term Corp Bd ETF (SPIB)
- Vanguard Long-Term Corporate Bd ETF (VCLT)
- iShares 0-5 Year Invmt Grade Corp Bd ETF (SLQD)
- Janus Henderson Short Duration Inc ETF (VNLA)
- Invesco Ultra Short Duration ETF (GSY)
- iShares 10+ Year Invmt Grd Corp Bd ETF (IGLB)
Y-Charts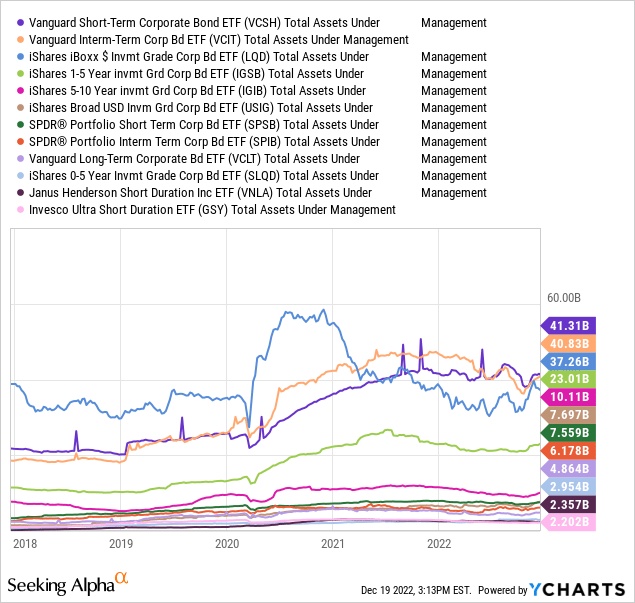
Right now, when looking at the high-grade space, we see little/less value in short-term/duration credits compared to longer-term/duration credits.
Therefore, we see no reason to consider or focus on short term/duration ETFs like VCSH, IGSB, SPSB, SLQD, VNLA, GSY.
We’re left with diversified, intermediate and long/er-term/duration ETFs such as VCIT, LQD, IGIB, USIG, SPIB, VCLT, IGLB.
Among the latter group, LQD is the one that pays the highest dividend yield* along with the following features (as of Dec 16, 2022):
- Expense ratio: 0.14%
- Weighted Average Coupon: 3.73%
- Weighted Average Maturity: 13.13 years
- Effective Duration: 8.58 years
*As of Dec 15, 2022: 30 Day SEC Yield 5.02%; 12m Trailing Yield 3.42%
Y-Charts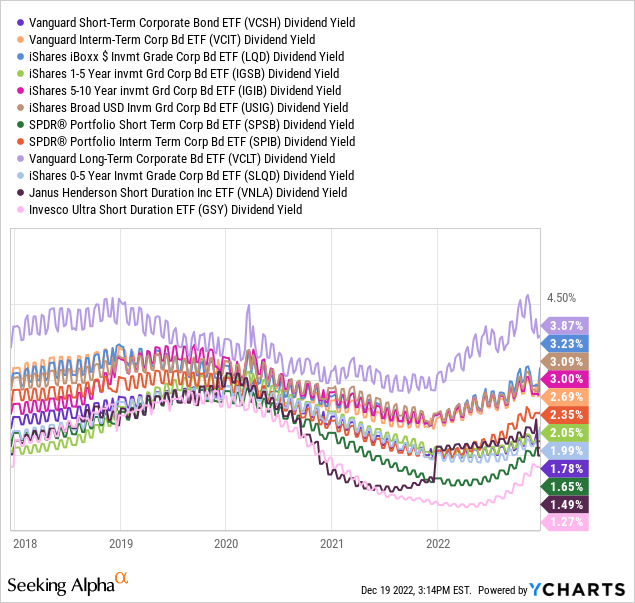
LQD – The Preferred ETF Among a Preferred Asset-Class
As you can see in the below chart, LQD (just like the entire credit market) has had a tough year, losing about 25% in value (excluding dividends) from peak to trough.
Nonetheless, in recent weeks (along with falling yields at the longer-end of the yield-curve) LQD has had a double-digit recovery, albeit a more hesitant trading pattern over the past week.
The ETF now trades at an important level that needs to be protected in order for the recent rally to maintain its strength and momentum.
Y-Charts, Author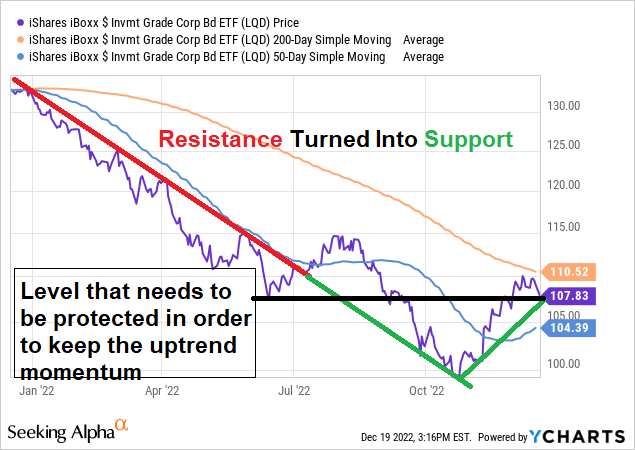
On a longer-term basis/chart, LQD needs to regain the $112-113 price range which has been a crucial level over the past decade.
Until this year, this price range functioned as a support level from which LQD bounced each and every time it touched that level.
Now, the former support has become a new/current resistance and so in order for LQD to keep the faith (of investors), not only does it need to stay above $107, but it also needs to climb above $112-113.
Y-Charts, Author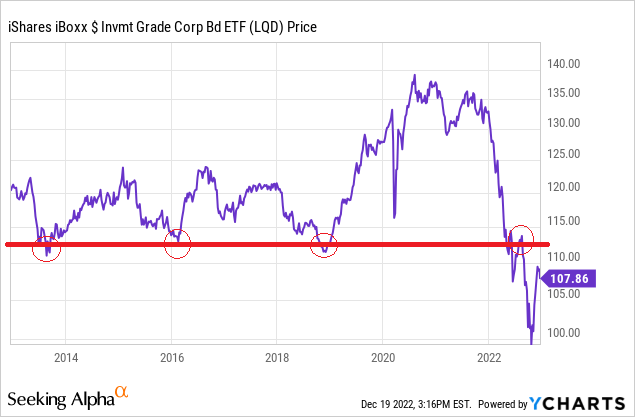
Be Careful with High-Yield Debt!
A lot of money is already flowing into bonds as we speak, particularly high yield debts.
Bloomberg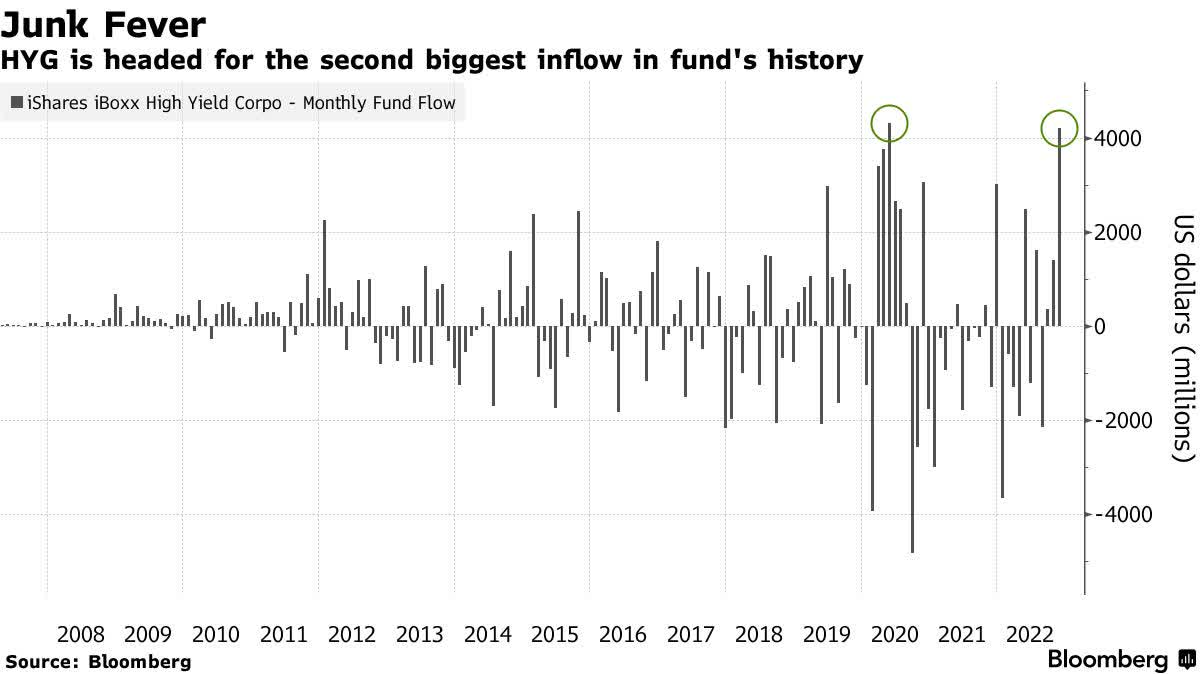
Nonetheless, as we’ve written (and shown) many times in recent weeks, we believe that HY spreads are still too low, and expect those to widen significantly.
Defensive, Non-Cyclical, Assets
Last but not least, here’s BofA FY 2023 return forecasts by asset class.
Leave industrial (e.g., Copper) and precious (e.g., Gold) metals aside for now (that’s another story for another time), you can see that (just like us) BofA is pro-bonds too.
IG bonds and US Treasuries (the credit types we’re already buying, e.g., long TMF + short TMV ) are topping the list (excluding metals).
Stocks, per BofA, aren’t expected to deliver any return in 2023.
BoA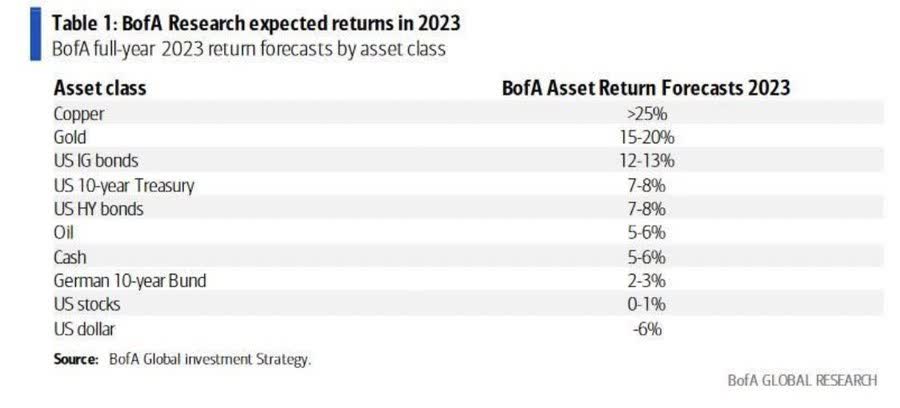
Taking into consideration how we’re (already) positioned, and how we intend to be positioned (over the next few weeks/months), we wouldn’t mind if these forecasts materialized.
This will ensure our Funds Macro Portfolio (“FMP”) is going to outperform SPY, significantly, for another year, just as is the case thus far in 2022.
Macro Trading Factory (“MTF”)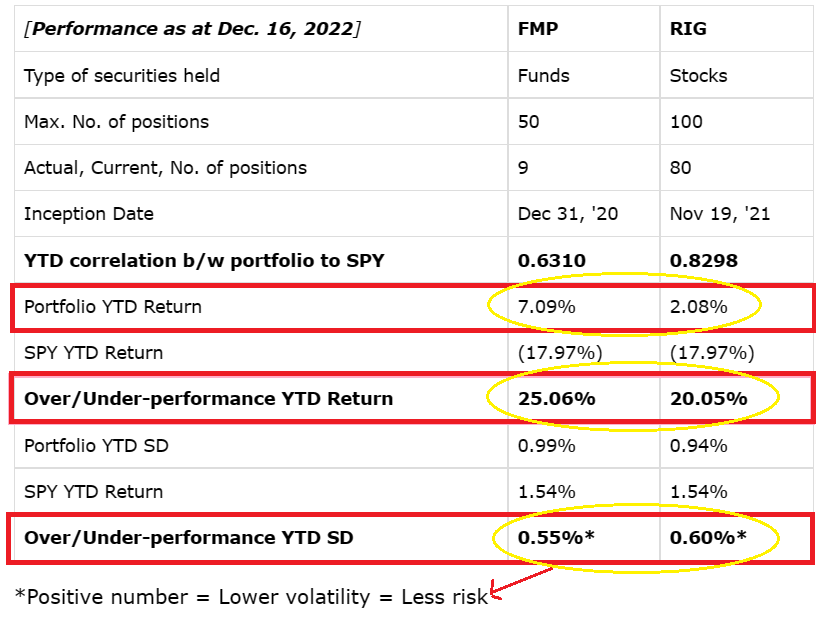
Right now (at the close of Dec. 16 trading day), FMP is outperforming SPY by ~25% YTD while taking ~40% less risk (measured by standard deviation).
We believe that the investing preferences as laid out in this article are going to assist us maintain that edge over the leading benchmark that is currently too risky to our taste.
Be the first to comment