

200mm/iStock Unreleased via Getty Images
Introduction
We review our investment case on L’Oréal SA (OTCPK:LRLCY) six months after we upgraded our rating to Buy.
Since our upgrade in March, L’Oréal shares trading in Paris have gained just 2.5% in EUR (mostly from its dividend), and remain nearly 20% down year-to-date. L’Oréal’s American Depository Receipts (“ADR”) trading over-the-counter in the U.S. have lost nearly 10% in USD in the past six months:
|
L’Oréal ADR Share Price History vs. Librarian Capital Rating(Last 1 Year) 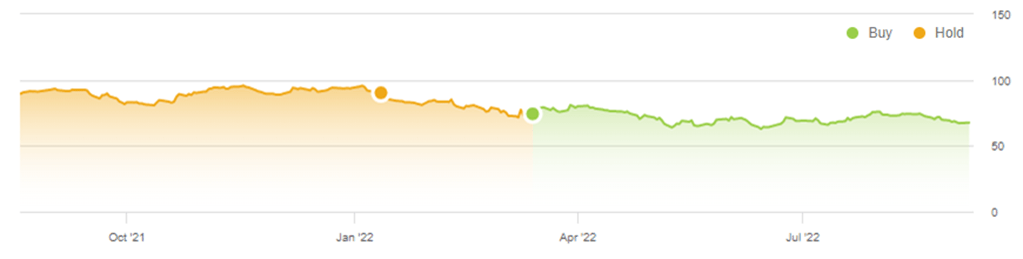 Source: Seeking Alpha (07-Sep-22). |
L’Oréal’s operational performance has continued to be on track. H1 2022 results released on July 29 showed L’Oréal has returned to its long-term growth trajectory, with a 3-year EBIT CAGR of 9.0% from 2019.. EBIT margin has again expanded, thanks to price/mix and operational leverage. In addition to a continuing rebound from COVID-19 disruption, L’Oréal sales have grown faster than both the market and key peer Estée Lauder (EL). Relative to the Euro, currency tailwinds have moved further in L’Oréal’s favour since H1 2022. Shares are trading at 33x last-twelve-months EPS. Our forecasts show a total return of 38% (10.4% annualized) by 2025 year-end. Buy.
L’Oréal Buy Case Recap
L’Oréal is the #1 global Beauty company by sales, involved in every segment and region. Our investment case on L’Oréal’ had been based on the following:
- The Beauty market will continue its strong structural growth, as an aspirational category for consumers, helped by growing demand from APAC (especially China) and premiumization (especially in Skincare).
|
Global Beauty Market Growth (2010-21) 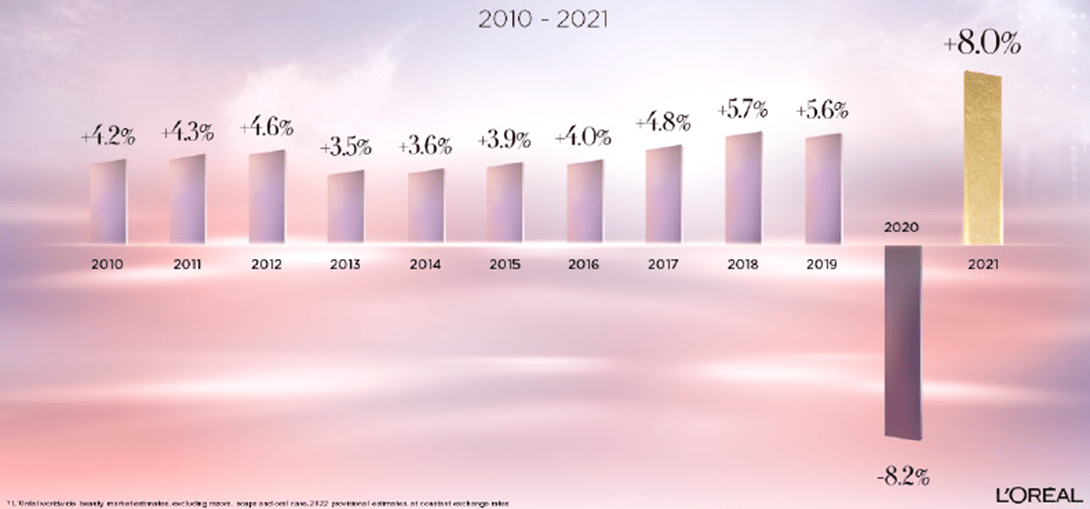 Source: L’Oréal results presentation (H1 2022). |
- L’Oréal has strong global franchises built on leading brands, high-quality products, scale, innovation and marketing capabilities.
- L’Oréal will grow sales faster than the market thanks to these advantages, and grow its earnings faster than sales with natural operational leverage. We believe L’Oréal’s EPS CAGR will be close to 10% over time
- Compared to its main rival Estée Lauder, L’Oréal has a more broad-based portfolio and a lower concentration in Prestige and Skin Care products, which means L’Oréal has lower growth but is lower-risk
COVID-19 was negative for L’Oréal, disrupting Travel Retail and also reducing demand for areas such as Make-up and Haircare. However, as of H1 2022, L’Oréal has nearly recovered all the momentum lost during the pandemic.
3-Year CAGR Exceeds Our Investment Case
As of H1 2022, L’Oréal’s growth trajectory has recovered from the momentum lost to COVID-19 in 2020-21.
H1 2022 Net Sales of €18.4bn represented a 3-year CAGR of 7.4% from pre-COVID H1 2019; while this included some benefit from currency, 3-year Net Sales CAGR was still 6.6% on a like-for-like basis:
|
L’Oréal Net Sales By Half-Year (Since 2018) 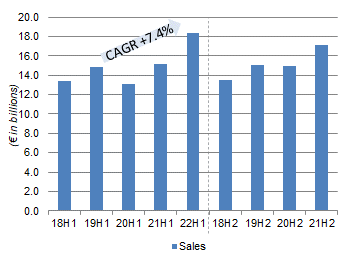 Source: L’Oréal results releases. |
H1 2022 EBIT of €3.75bn similarly represented a 3-year CAGR of 9.0% from H1 2019, faster than the Net Sales CAGR as L’Oréal’s EBIT margin continues to expand consistently:
|
L’Oréal EBIT By Half-Year (Since 2018) 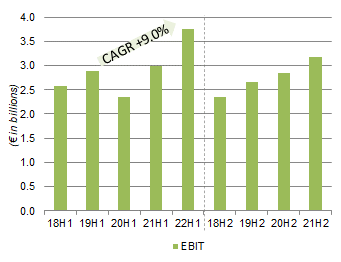 Source: L’Oréal results releases. |
H1 2022 Adjusted EPS of €6.05 represented a 3-year CAGR of 11.4% from H1 2019, faster than the EBIT CAGR and above the “close to 10%” we have in our investment case, thanks in part to a 4.6% reduction in the share count after the repurchase of €8.9bn of shares from Nestlé (OTCPK:NSRGY) in December 2021.
These growth rates are particularly remarkable as H1 2022 represented a still-incomplete recovery from the pandemic, with partial lockdowns and air travel restrictions in parts of the world (especially China) during this period.
L’Oréal’s Continuing Margin Expansion
L’Oréal’s H1 2022 P&L shows how its EBIT margin has continued to expand, despite elevated inflation and investments.
Net Sales grew 20.9% year-on-year due to a weak Euro (or 13.5% like-for-like). Gross Margin grew slightly less, by just 18.6% year-on-year, after Gross Margin fell approximately 140 bps (of which 70 bps was due to currency). However, EBIT grew 25.3% year-on-year, after R&D, Advertising & Promotion (“A&P”) and SG&A costs all grew less than sales:
|
L’Oréal P&L (H1 2022 vs. Prior Periods) 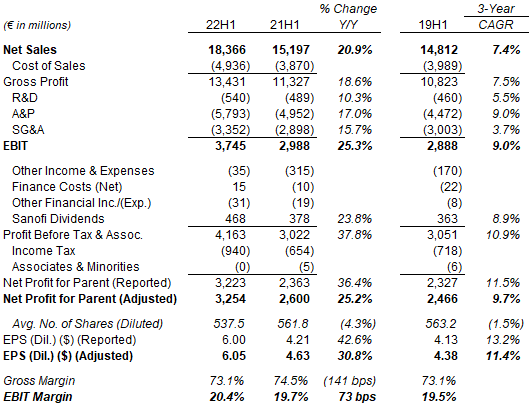 Source: L’Oréal results release (H1 2022). NB. Relocation of Asia Travel Retail business on July 1 shifted €90m of sales from Q3 to June, worth 60 bps to the like-for-like Net Sales growth in H1. |
L’Oréal’s EBIT margin expanded approximately 70 bps year-on-year in H1; it would have expanded 90 bps except for a 20 bps headwind from the reclassification of certain software costs. Margin expansion was helped by price/mix (or “valorization” in L’Oréal lexicon). Of the 13.5% like-for-like Net Sales growth in H1, half (6.7%) was from price/mix and the other half (6.8%) was from volume.
L’Oréal has continued to invest. Since H1 2019, A&P costs have a CAGR of 9.0%, growing faster than Net Sales, while R&D costs have a CAGR of 5.5%, growing slower than Net sales but still reaching a run-rate of nearly €1.1bn in H1.
Management stated that L’Oréal is managed on an annual basis and investors should not extrapolate H1 to the full year. However, they also stated that they expect growth in both Net Sales and EBIT in 2022, and continue to expect EBIT margin expansion every year.
L’Oréal Outgrowing the Market & Peers
L’Oréal’s H1 2022 sales growth was significantly faster than both the market and Estée Lauder.
Group like-for-like Net Sales growth of 13.5% in H1 was more than twice the market growth of 6%. L’Oréal also grew significantly faster than the market in every region except Europe, where it was 0.2 ppt behind:
|
L’Oréal Net Sales Growth vs. Market (H1 2022) 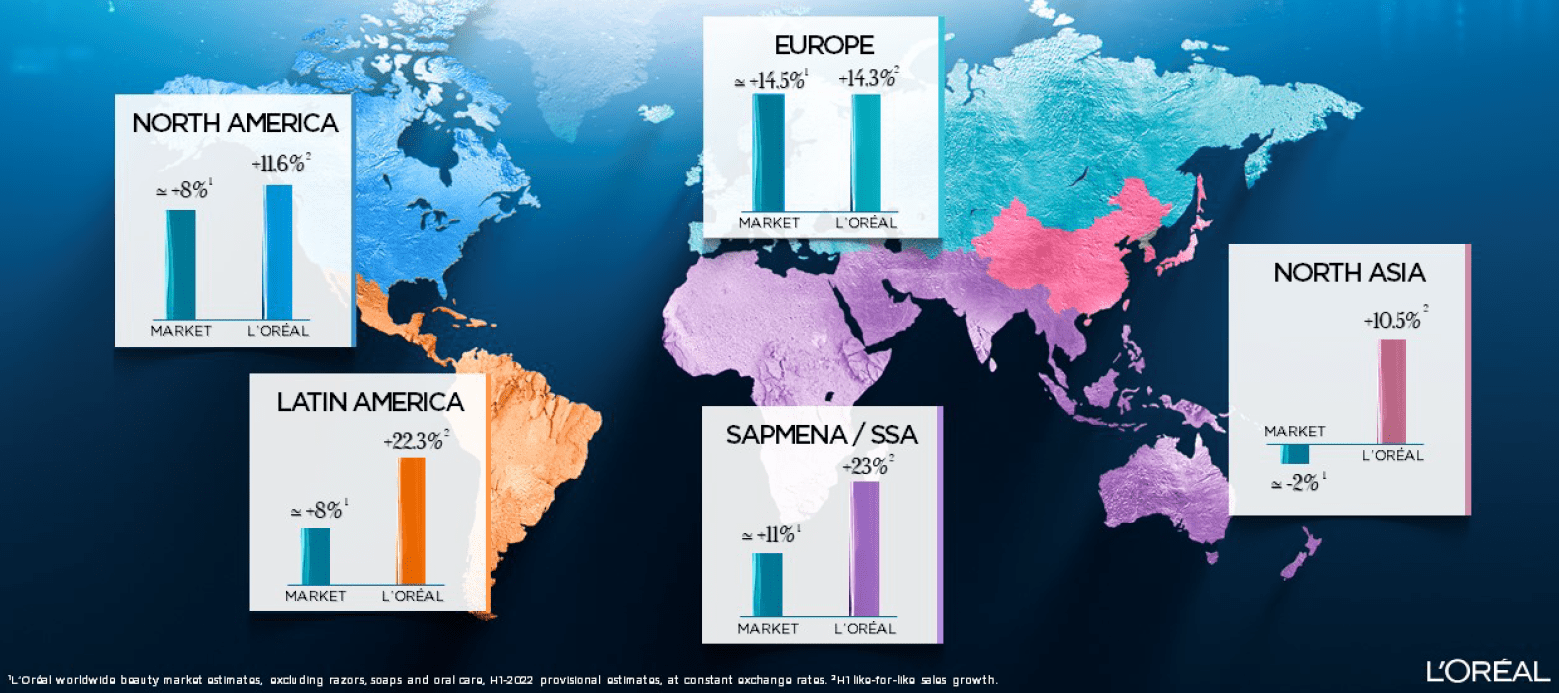 Source: L’Oréal results presentation (H1 2022). |
L’Oréal did significantly better than Estée Lauder, whose sales were organically flat year-on-year in H1 CY21 (or up 2% including acquisitions), after growing 9% in Q1 but shrinking 8% in Q2. The main reason for this appears to be China, where the market shrunk 10% in Q2 due to COVID-related restrictions. Compared to EL, L’Oréal is both less exposed to China (which was 36% of EL’s sales in FY21, but likely just 20% of L’Oréal’s sales in 2021) and did better in that market (growing sales by 6% like-for-like in Q2 vs. EL sales falling 13%, both figures excluding Travel Retail).
L’Oréal likely did better than EL in China because it is less reliant on brick-and-mortar stores and more focused on e-commerce, and also because it does not have its national distribution centers located in Shanghai, a city that was essentially shut by COVID restrictions during April and May.
Currency Tailwinds vs. The Euro
For its European shareholders, L’Oréal is also enjoying a material benefit from the historically weak Euro.
Outside the Euro, which was 19.1% of its sales, L’Oréal’s major currencies include the U.S. Dollar, the Chinese Yuan, the U.K. pound, etc. – nearly all have risen significantly against the Euro in H1 2022 and risen further subsequently:
|
L’Oréal‘s Key Currency Weights & Rates 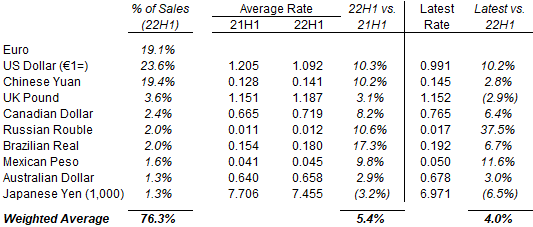 Source: L’Oréal results presentation (H1 2022) and Refinitiv (07-Sep-22). |
The currencies listed (including the Euro) represent 76% of L’Oréal’s sale, and their rates imply a year-on-year tailwind of 5.4% based on average H1 2022 rates, and a further tailwind of 4.0% based on the latest rates.
At H1 2022 results, management stated that currency spot rates at the time implied a tailwind of 7% for Net Sales for full-year 2022. Subsequent currency movements have likely increased the tailwind to nearly 10%.
Is L’Oréal Stock Overvalued?
At €342.00, relative to 2021 financials, L’Oréal shares are at a 37.3x P/E and a 2.9% Free Cash Flow (“FCF”) Yield:
|
L’Oréal Earnings, Cash Flows and Valuation (2019 to H1 2022) 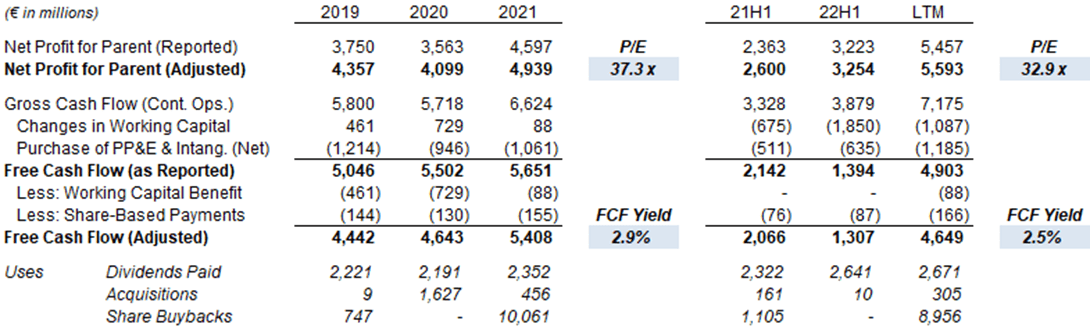 Source: L’Oréal company filings. |
Relative to last-twelve-month (“LTM”) financials, which include a H1 2022 where Adjusted EPS was up 30.8% year-on-year, shares are at a 32.9x P/E, though FCF Yield is lower at 2.5% due to a higher working capital outflow. As discussed above, currency tailwinds have increased recently, so the “real” valuation metrics should be even cheaper.
L’Oréal’s annual dividend is €4.80, representing a Dividend Yield of 1.4%. The dividend was raised 20% this year and represented 54% of the Adjusted EPS.
L’Oréal had €5.00bn of net debt at H1 2022, due to both new debt to repurchase shares from Nestlé and H1 seasonal working capital outflows. We expect it to return to Net Cash relatively quickly.
L’Oréal continues to hold a 9.44% stake in Sanofi, worth €9.6bn (5.2% of L’Oréal’s market capitalization) at current prices. L’Oréal’s share of Sanofi earnings is partially captured in the P&L through Sanofi dividends received.
L’Oréal Stock Return Forecasts
We update our forecasts and extend them by a year. We now assume:
- 2022 Net Income of €5.71bn (was €5.33bn)
- 2023 Net Income growth of 6.5% (was 9.5%)
- From 2024, Net Income to grow at 9.5% each year (unchanged)
- 2022 share count of 538m (unchanged)
- From 2023, the share count to be flat (unchanged)
- Dividend to grow at 10.5% each year (unchanged)
- P/E of 33.5x at 2024 year-end (was 36x)
Our new 2025 EPS forecast is 4% higher than before (€13.02), and implies a 2019-25 EPS CAGR of 9.8%. We have increased our 2022 Net Income forecast based on L’Oréal’s strong H1 and currency tailwinds; we have reduced our 2023 forecast to reflect a partial reversal of 2022 currency tailwinds.
|
Illustrative L’Oréal Return Forecasts 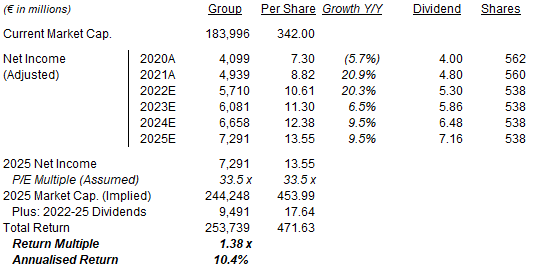 Source: Librarian Capital estimates. |
We have reduced our assumed P/E to reflect higher interest rates, similar to the reduction we have recently made for Estée Lauder (from 42.0x to 37.5x). The new assumed 33.5x P/E is also similar to where L’Oréal shares are currently.
Our dividend assumptions imply that the Payout Ratio will reach 54% in 2025.
With shares at €342.00, we expect an exit price of €445 and a total return of 38% (10.4% annualized) by 2025 year-end. We consider this forecasted return attractive for such a unique asset.
Conclusion: Is L’Oréal Stock A Buy?
We reiterate our Buy rating on L’Oréal stock.
Be the first to comment