

Canadian Dollar, USD/CAD Price Analysis
- As the US Dollar has continued to fall, USD/CAD has continued with strength.
- This highlights how the Canadian Dollar has recently been even weaker than the US Dollar.
- Can USD/CAD break out to fresh highs?
USD/CAD Rallies into Resistance
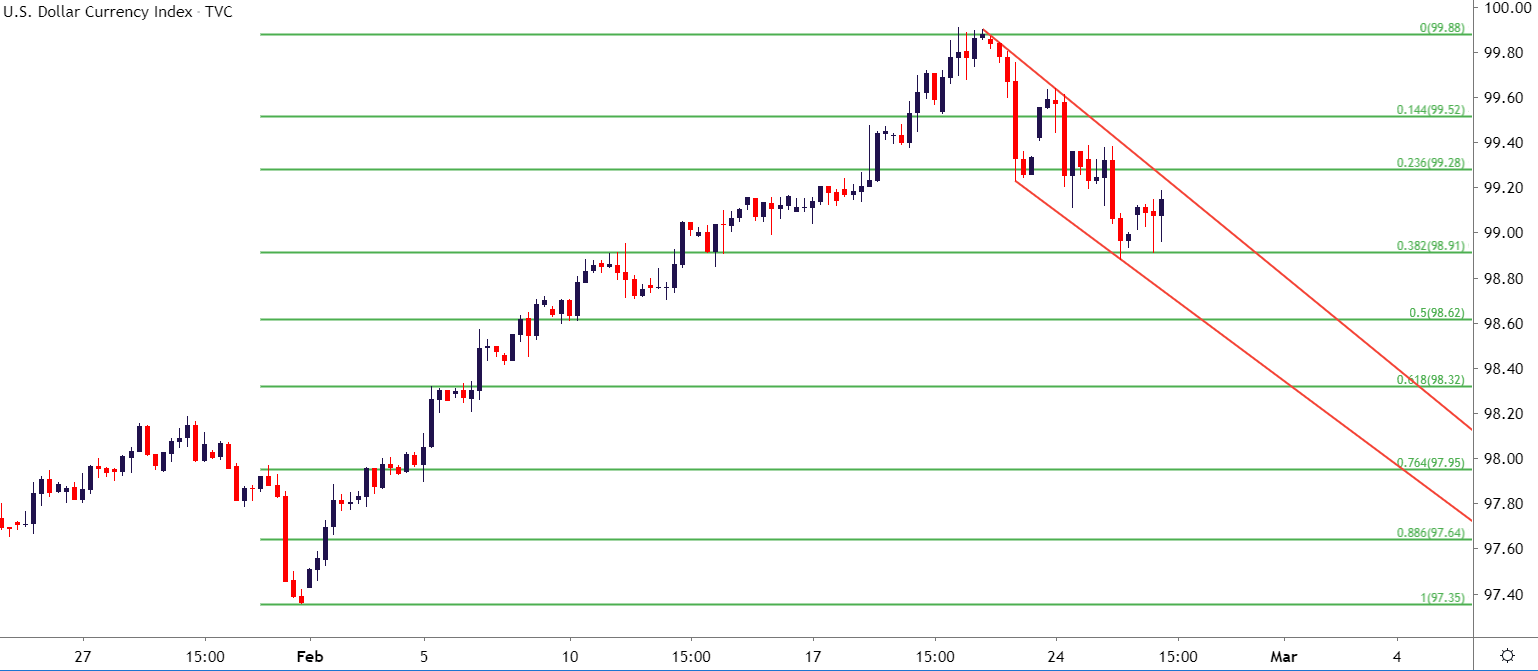
It’s been a continuation of fear so far through this week, with a possible turning point in a number of risk markets starting to show. The US Dollar, in particular, has been in focus as last week’s breakout and Thursday’s push to fresh three-year-highs has quickly unwound. But, over the past half-of-a-day, support has held: Buyers appear to be getting just a little bit more aggressive, and this highlights the potential for a return of USD-strength. That support build comes in around the 38.2% retracement of the February rally in the currency; and this highlights a very interesting strategy component in the USD/CAD pair.
US Dollar Four-Hour Price Chart
USD/CAD for USD-Strength Strategies
As looked at a couple of different times over the past week, USD/CAD could remain an interesting candidate for strategies of USD-strength; largely on the basis of Canadian Dollar weakness, which has recently outdone that of the US Dollar.
I had looked into a setup last week that could work towards bullish continuation strategies: Following a robust trend through January and the first week of February, price action finally found some element of resistance around the 1.3306 marker, which is the 50% level of the 2019 major move in the pair. Buyers pushed slightly beyond that price, albeit temporarily, only for follow-through resistance at the November highs to come into play; helping to thwart the advance and stop buyers in their tracks.
But, as discussed in yesterday’s webinar – the devil is in the details. Following lower-highs in October and November, this was the first bullish advance that had the strength to move up to test a prior multi-month high. Even the pullback in the pair has remained in somewhat of an orderly format, discussed last week, as prices formed a falling wedge that took on the resemblance of a bull flag formation.
USD/CAD Four-Hour Price Chart
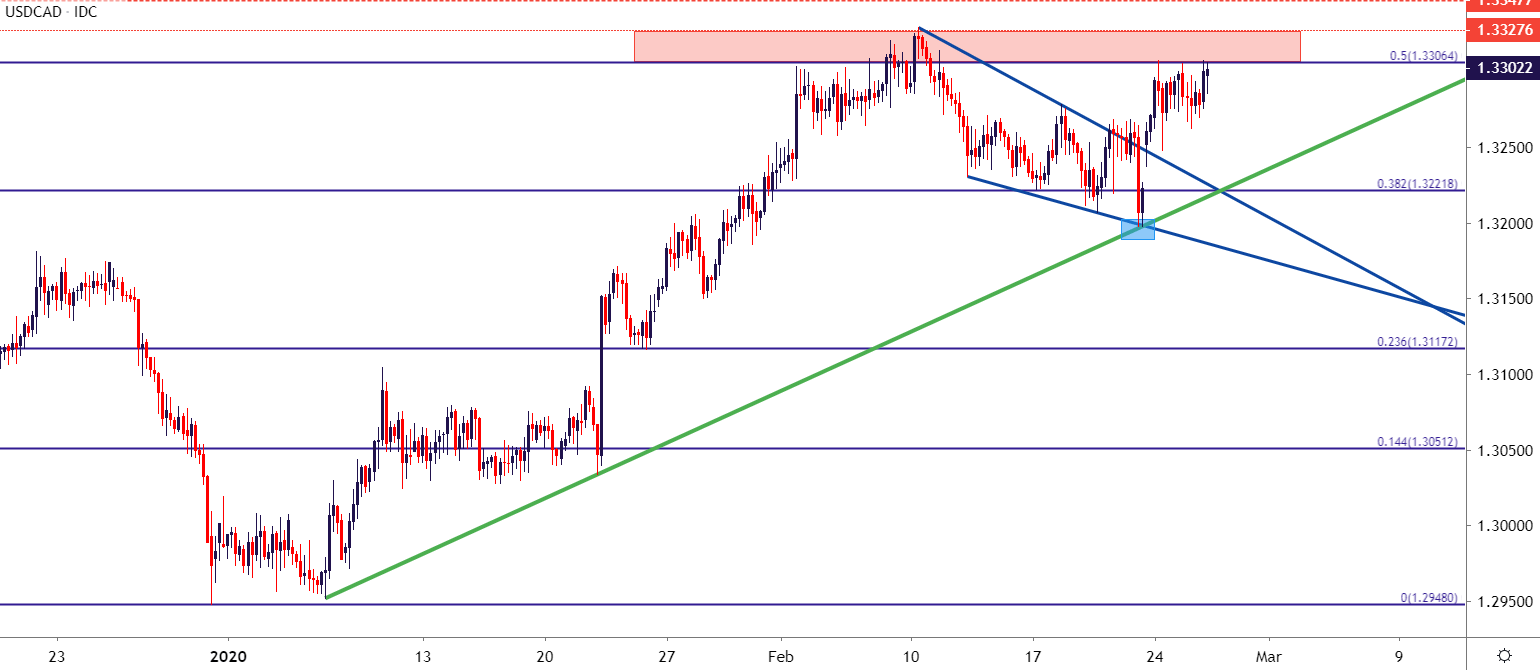
Chart prepared by James Stanley; USDCAD on Tradingview
USD/CAD Near-Term Strategy
At this point, the bullish bias in the pair remains given the continuation of higher-highs and higher-lows, and on a shorter-term basis, breakout potential shows as price action is testing this key level right now. Just beyond this level is the November and February swing highs, coming in around 1.3328; after which the October high lurks at 1.3347. Beyond that – the September high is at 1.3383, and this is confluent with a Fibonacci level at 1.3391 to create a zone of potential resistance. Next up would be the June swing high at 1.3433; after which the 1.3500 psychological level can come back into play for the first time since May of last year.
USD/CAD Daily Price Chart

Chart prepared by James Stanley; USDCAD on Tradingview
— Written by James Stanley, Strategist for DailyFX.com
Contact and follow James on Twitter: @JStanleyFX
Be the first to comment