


PM Images
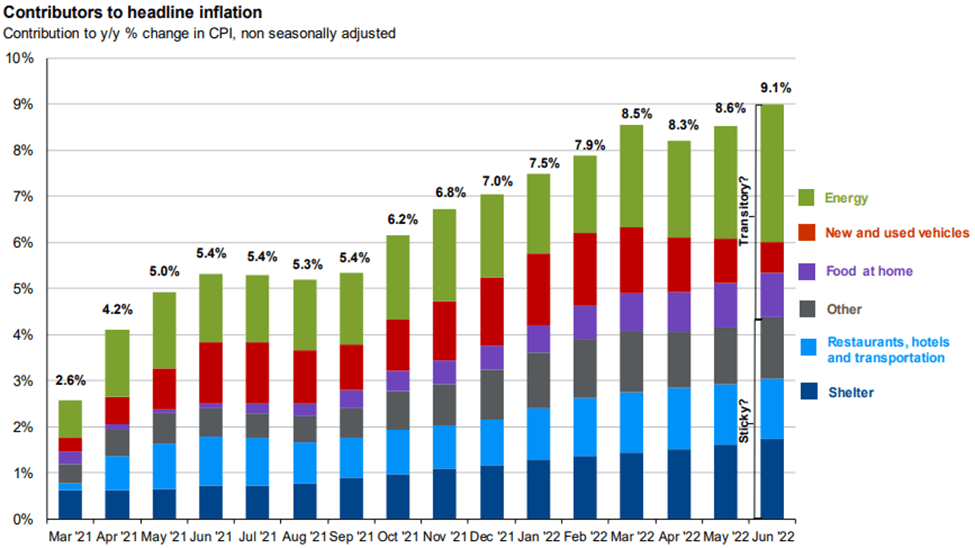
Persistent inflation and real-world price volatility are driving uncertainty for consumers. The significant fiscal and monetary stimulus provided to combat the pandemic economic lockdowns is now manifesting as the highest inflation that the U.S. has experienced in about 40 years. With the CPI showing an 8.5% 12-month increase in July, consumers are being squeezed by a combination of rising prices and wage growth that is not keeping pace.
JPMorgan
The current inflation rate has been driven by its component parts that can be considered transitory or sticky. Transitory components are those that are more discretionary to the consumer or driven by volatile commodity prices. We have already seen energy prices trade down from the highs reached earlier this year. While natural gas prices remain elevated, and very volatile, both crude and gasoline have fallen significantly from June highs. This has provided some relief in terms of gas prices at the pump. Since the highs reached in June, natural gas is lower by over 2.5%, although with significant volatility. Crude oil is 22.5% from its June high, and gasoline is down over 25%.
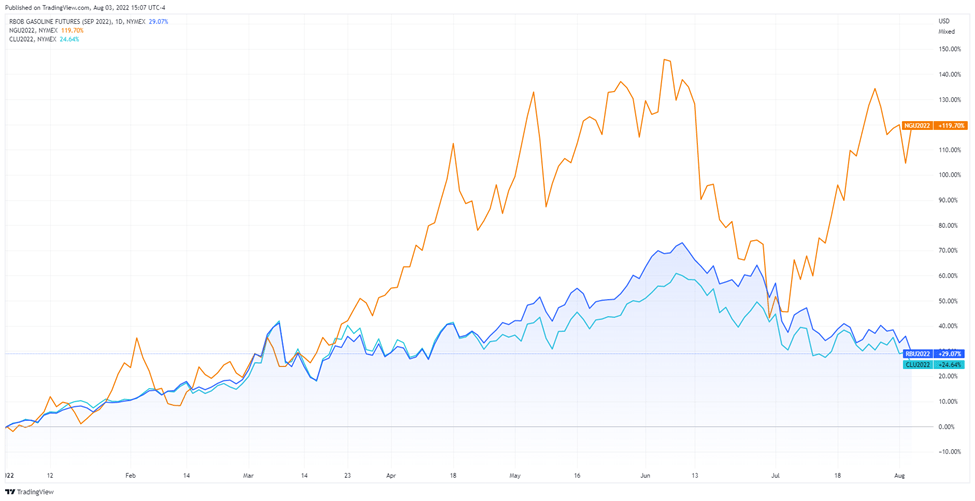
YTD Energy Prices (CME/NYMEX)
Costs that are sticky include housing, healthcare, and more recently travel and hospitality-related goods and services. While that last category has been resilient in recent months, that upward price pressure may not be as sustainable as that found in housing and healthcare as it is more discretionary. The increase in house prices, rents, and interest rates have driven housing costs higher for both renters and homeowners.
Consumer demand remains strong despite rising prices. Although, this is in part due to consumers spending more to compensate for higher prices. In other words, individuals might be buying the same quantity, or even less, but spending more due to higher prices.
Watch Changes in Money Supply
Money supply has also been a major driving force behind the acceleration and level of inflation. The M2 measure of money supply includes cash, checking accounts, CDs, money market funds, and other liquid easily convertible instruments that are close to cash. Over the last five years, M2 has grown from $13,558.9 billion to $21,667.5 billion. This is a change of 59.8% in five years, or a compound annual growth rate of over 9.8%. From February 2020 through June of this year, that compound annual growth rate is nearly 15.6%. This jump in the annualized compounded rate is mainly due to the large increase from February to May of 2020. Since then, the rate of increase has slowed, and year-to-date 2022 it is essentially unchanged. If the M2 remains steady or increases at a more normal rate, this will also alleviate upward pressure on prices.
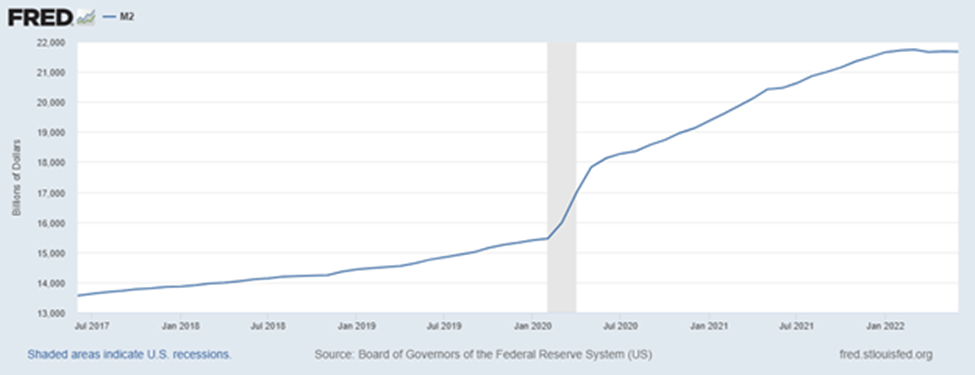
5-year M2 growth (St. Louis Fed)
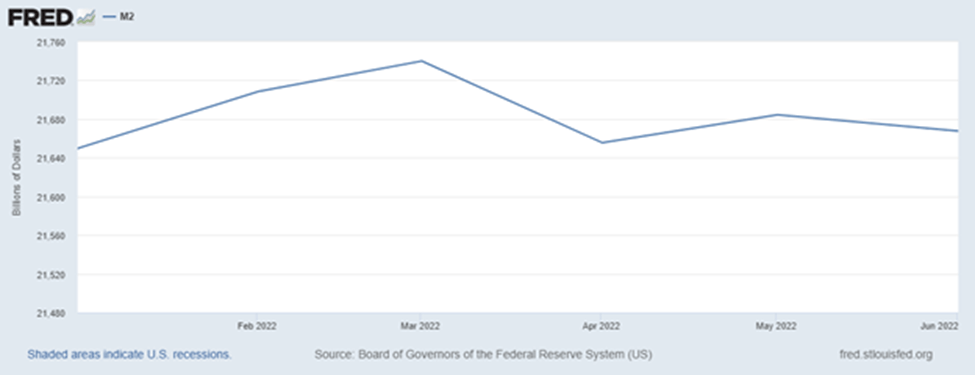
YTD M2 growth (St. Louis Fed)
Real World Price Volatility
While housing costs have risen at a brisk pace since the pandemic began, the volatility in interest rates has contributed to general uncertainty in the housing market. With 30-year mortgage rates jumping from 3.5% to over 6% and back down to around 5% in a short period, potential homebuyers are faced with a further challenge. In addition to the hurdle of securing adequate funds for a down payment, new homebuyers must now consider the mortgage payment in a different context as well. After all, the difference in payment between a 3.5% mortgage and 6% mortgage is significant for many would-be buyers.
Businesses also face this uncertainty as their cost of capital has become unusually volatile in recent months. New capital projects may be put on hold as financing costs rise, or the general uncertainty may cause some managers to place expansion initiatives on the back burner in favor of riding out current conditions in anticipation of more certainty in the future.
Underwhelming Wage Growth
Nominal wages for labor have experienced some of the highest growth in decades. Unfortunately, this comes at the same time as 40-year high inflation, causing the net result to be negative wage gains for the average worker. The chart below illustrates this point. At the beginning of the pandemic, nominal and real wages moved significantly higher as inflation was still muted. While wage growth has continued at a higher level, inflation has more than caught up, sending real wages further into negative territory than what was seen during the 2008-09 financial crisis. The real gains in wages during most of 2020 was likely aided by stimulus programs in addition to the low level of inflation. This real gain was a significant driver of increased savings rates and savings for most consumers. Unfortunately, that is no longer the case, and consumers are experiencing eroding purchasing power for both staples and discretionary items.
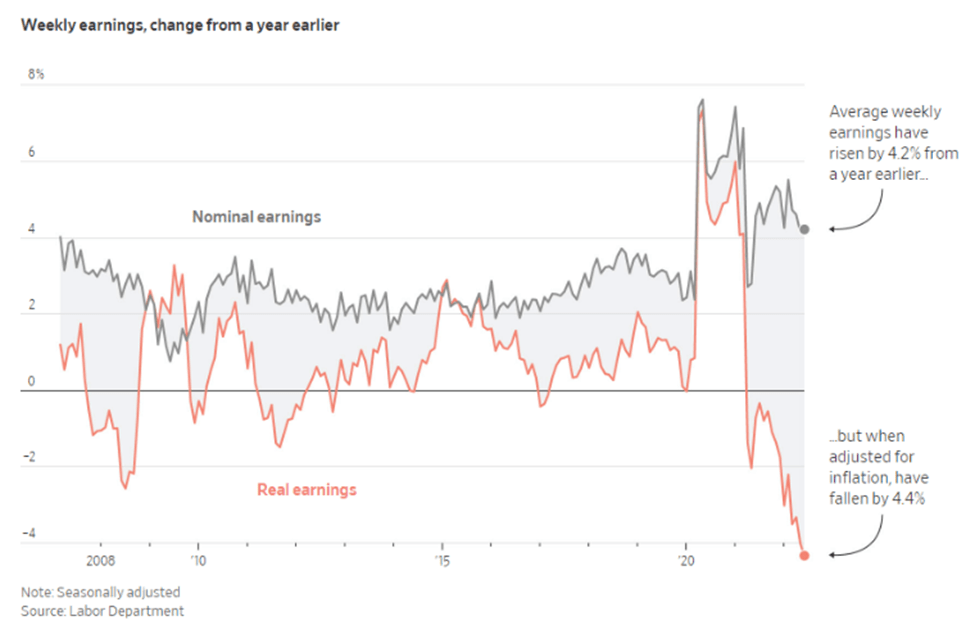
Nominal and real earnings growth (Labor Department, The Irrelevant Investor)
Misery index
Despite rising inflation and volatility of prices for goods and services, the unemployment situation remains strong. With the July jobs report released last week, the unemployment rate dropped back to 3.5% after the economy added 528,000 jobs during the month. It is reasonable to expect wages to continue growing, at least in nominal terms, given the tight labor market.
The chart below shows what is described as the misery index since just after WWII. The misery index is a simple composite of the inflation rate and unemployment rate. So while we are experiencing high inflation, this is offset in part by the low unemployment figures, keeping the misery index at a more reasonable level. The chart shows that this index spiked to levels nearly twice as bad during the 1970s and ultimately peaked around 1980. We are nowhere near that level now, and given the positive momentum in jobs combined with the down trend in commodity prices, we are unlikely to experience that same level of “misery” seen in the 1970s and 1980s.
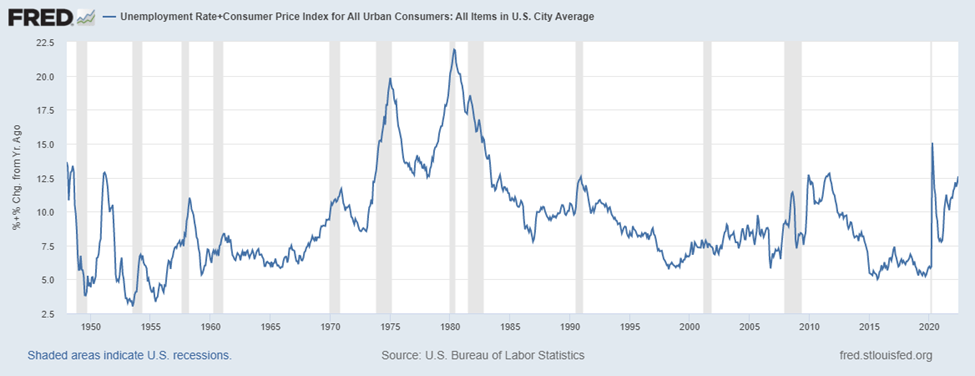
Misery Index (St. Louis Fed)
The other side of inflation
Given what is discussed above, it is not difficult to make a case for not only avoiding recession, but a continued period of growth and relative prosperity. Volatility in commodity prices and interest rates will need to decline for that to be possible, but that seems likely. While we may settle at levels higher to what we had prior to the pandemic, the prospect of 3-4% inflation, 5% 30-year mortgages, and 3.5-4% unemployment would form a solid foundation for the next cycle of economic growth.
If something that resembles that scenario comes to fruition, the question is then what areas of the market are poised to thrive in that environment. My first thoughts take me back to mega cap tech, but also technology that promotes further efficiency gains and in some cases could be considered deflationary.
With lower inflation and more stable prices, companies will resume making capital investments in their businesses. These growth and expansion projects will benefit the bellwethers within the tech industry, specifically Microsoft (MSFT), Amazon (AMZN), and Alphabet (GOOG) (GOOGL), among others. Chipmakers NVIDIA (NVDA) and Intel (INTC) should also be able to recover as supply chain issues slowly resolve and demand accelerates. Like with most suggestions I make, using a low-cost, diversified ETF is a more conservative approach to investing in these themes. In this case, I like the Invesco QQQ Trust (QQQ) to gain the core exposure I think will perform best moving forward. The fund is down about 20% year-to-date, making this an attractive entry point for long-term investors.
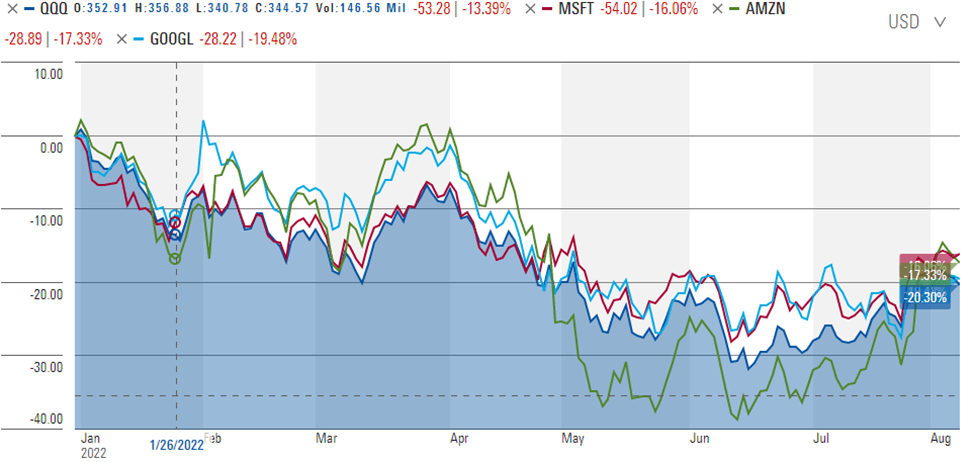
YTD Mega Cap Tech Performance (Morningstar)
Thinking longer term, it is reasonable to expect some efficiency gains will be driven by automation and robotics. With labor shortages likely to be persistent, especially in jobs requiring more physical effort, combined with returning some manufacturing to the U.S. to alleviate future supply shocks, businesses supplying automation and robotics are positioned to benefit in the long-term. While the U.S. will be a direct beneficiary of this effort, it will not be the only one. This will be a global effort to protect national interests and to cope with an aging population in much of the world. Because of this, it makes sense to gain exposure to companies that are located and sell their products and services around the world. The ROBO Global Robotics and Automation ETF (ROBO) meets these criteria. While more expensive than I prefer with an expense ratio of 0.95%, the fund is globally diversified with 45% of fund value invested in the U.S. and 55% invested in the rest of the world, including a small amount in emerging markets. Outside the U.S., the largest geographic exposure is to Japan, followed by Taiwan and Germany. Like with most tech, ROBO is off to a weak start this year, down about 29% year-to-date.
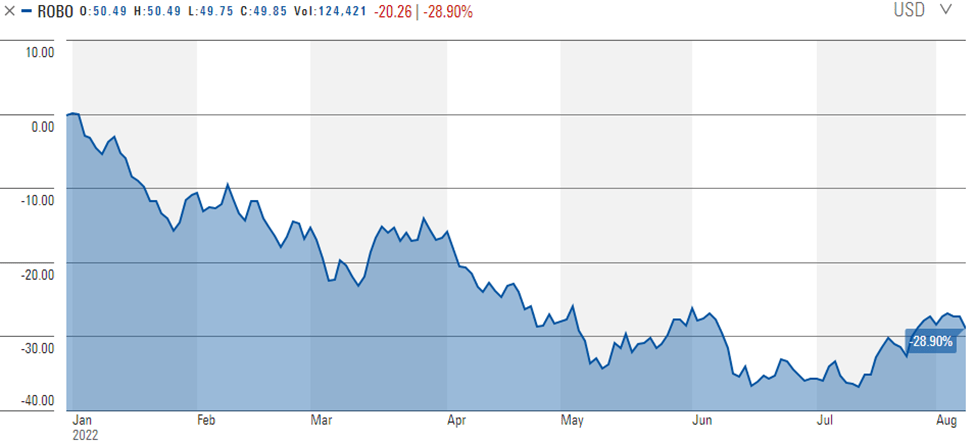
YTD ROBO Performance (Morningstar)
Final Thoughts
The case for lower inflation, price stability, and strong economic growth might seem overly optimistic to many. However, I believe that the foundation for this is forming right now. I am confident that inflation will subside based on the factors discussed above, notably easing commodity prices, stability in money supply, and the resolution of supply chain issues globally. I expect demand for some goods to moderate as well. With mortgage rates materially higher than they were a year ago, I expect some leveling off in housing prices, a significant contributor to high inflation. It is also reasonable to expect travel and leisure related costs to stabilize as consumers return to more normal patterns while business travel remains muted.
The most direct beneficiaries of the economy resuming more stable growth will be within the tech industry, both short-term and long-term. Long-term labor supply shortages can be alleviated in part by greater use of robotics and automation, an area that is investible today. Like with most of my suggestions, I recommend a diversified and low-cost approach to capture the gains over the long term. Compounded returns from investing occur over years and decades, not weeks and months, and these ideas reflect that. Any tilts within your portfolio allocations should be sized in a way that aligns with your risk tolerance and preferences. I look forward to your feedback in the comment section below.
Be the first to comment