

Rand Fundamental Backdrop
The rand has displayed robust defiance throughout Q2 despite persistent local economic and political woes. This is no surprise as throughout the COVID-19 pandemic, the ZAR has predominantly been driven by external global factors. Risk sentiment has played a continual role in dictating rand trends along with its Emerging Market (EM) currency counterparts.
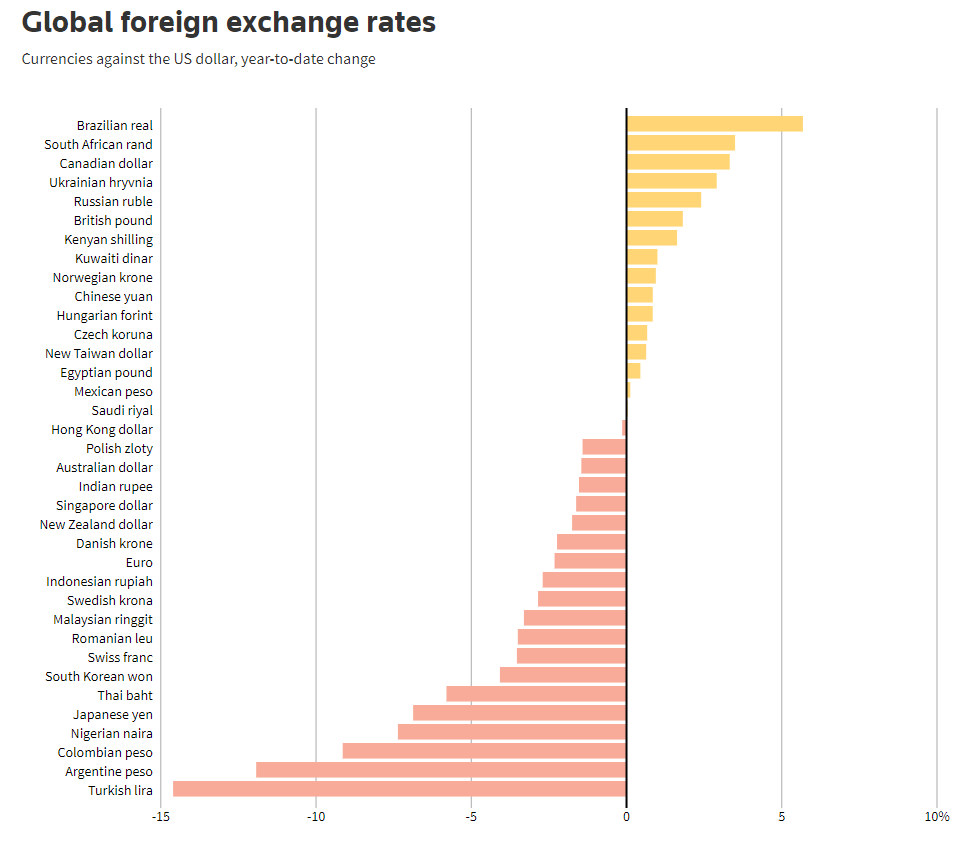
Other EM currencies have also performed strongly but the rand has held the top spot against the dollar for most of 2021 with the Brazilian Real recently taking over.
The reasoning behind this outperformance has not been down to rand strength but rather comparatively worse conditions experienced in peer nations. For example, India with their escalating COVID-19 condition, while Russia and Turkey’s geopolitical risks carry resistance for their respective currencies.
USD/ZAR Financial Crisis Vs Covid-19
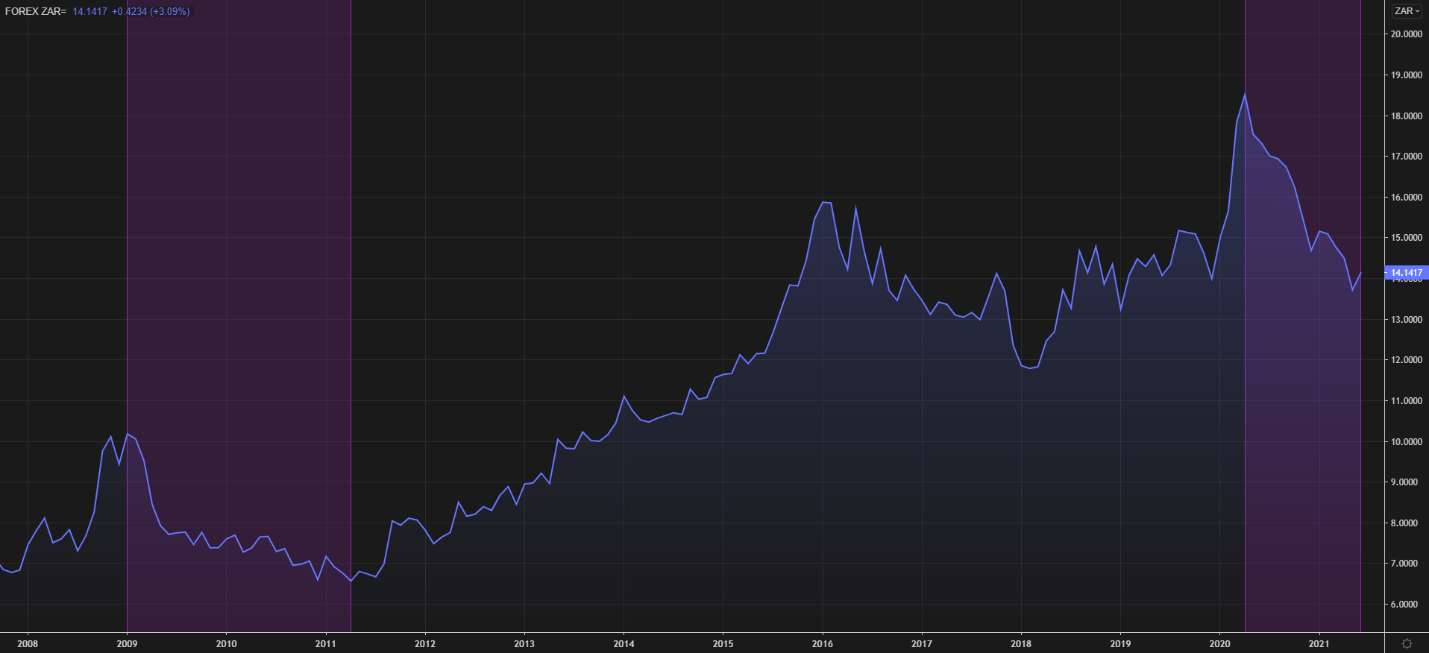
Chart prepared by Warren Venketas, Refinitiv
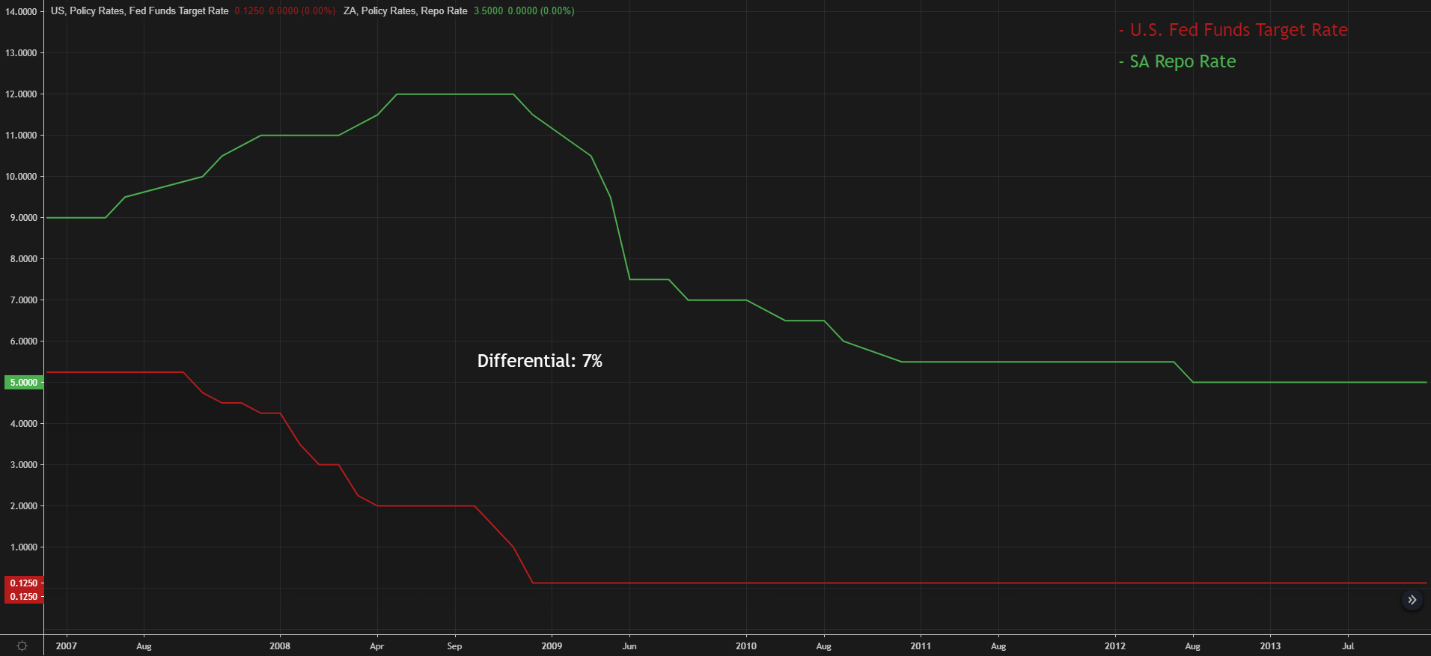
The carry trade element remains in place in Q3 as the U.S. Federal Reserve continues with low interest rates – even though longer-term interest rate hikes have been brought forward after the Q2 FOMC meeting in late June. An interesting comparison between the financial crisis in 2007/8 and the current COVID-19 pandemic (see chart above) shows a similar trend in the way of noteworthy rand strength against the dollar post-rate cuts (purple).
Fed Funds Rate Vs SA Repo Rate: 2007 – 2013 (Financial Crisis)
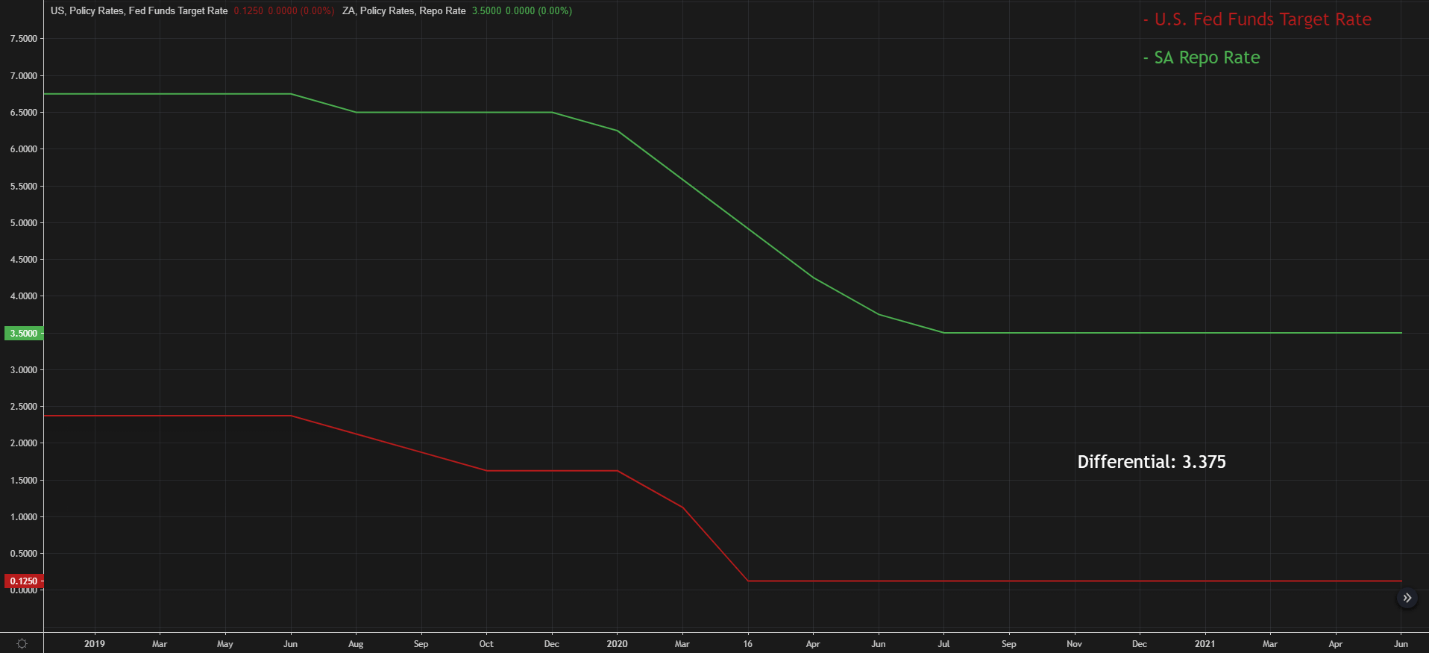
Fed Funds Rate Vs SA Repo Rate: 2019 – Present (Covid-19 pandemic)
USD/ZAR fell roughly 45% from the October 2008 high to the May 2011 low. While current levels on USD/ZAR show a decline of approximately 30% off April 2020 highs. Does this mean the situation is like-for-like? In a nutshell, no. I do not believe USD/ZAR will fall a further 15% in this case as the difference between the two periods (in terms of rates) is that the interest rate differential between the South African repo rate and U.S. Fed Funds rate is quite significant.
During the financial crisis period post-2008, the spread was 7% narrowing to 4.875% in late 2012; while the current spread at present (Q2 2021) is 3.375%. This reduces the effect of the carry trade which could be a key reason behind the disparity between the two periods as a higher differential usually carries more support for the currency linked with the higher interest rate (rand).
Historical % Change USD/ZAR Points to Rand Weakness
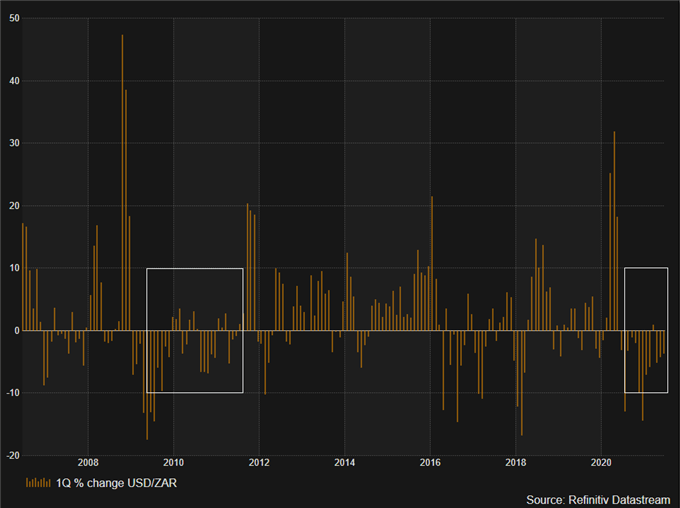
Chart prepared by Warren Venketas, Refinitiv
The chart above shows the 1Q percentage change from the financial crisis period which exhibits similar economic conditions to current whereby significant rand strength is succeeded by a consolidatory period slightly skewed toward dollar upside. The rand could be in for marginal appreciation against the dollar before a bullish USD/ZAR outlook, as we head toward the latter part of Q3.
SA COVID-19 Cases on the Rise
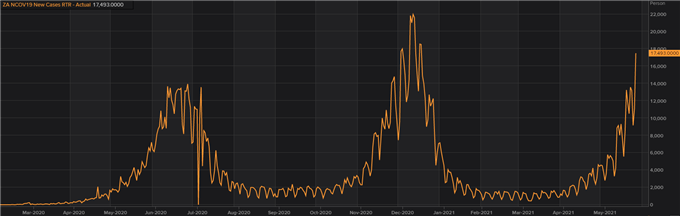
The COVID-19 factor could not be discounted in this Q3 trading forecast as South Africa is currently in the midst of a third wave that could surpass prior ones in terms of severity and case volume. This could lead to further opposition for rand bulls and therefore substantiates the bullish slant on the USD/ZAR pair.
Technical Analysis
USD/ZAR Weekly Chart
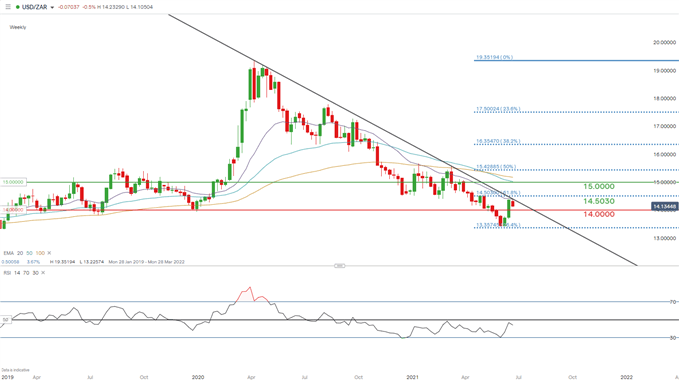
The weekly USD/ZAR chart above highlights the impressive resilience shown by the rand during the course of 2021. Price action throughout this period has established a formidable trendline resistance zone (black) which has been holding firm in spite of several attempts to push above.
Currently, we see bulls bidding to pierce resistance once more so market participants will be looking for a confirmation close above this resistance zone along with the coinciding 14.5000 psychological level. This level is further underlined by the 61.8% Fibonacci retracement taken from February 2018 lows to the April 2020 high.
The start of Q3 should see price action hover between the 14.0000 support and 14.5000 key levels after which possible taper talk from the U.S. as well as the Jackson Hole symposium in late August could prompt further dollar strength which may promote upside toward 15.0000.
The RSI oscillator has been indicative of bearish momentum since September 2020 however, a rise above the 50 level on the index could spur long USD/ZAR positions.
Be the first to comment