

ArtistGNDphotography/iStock via Getty Images
The Fed raised interest rates by 75bps this week, which was expected by the market. Yet, equities sold off fiercely, and indices look on course to test their June/July lows.
The market is now firmly focused on the higher inflation narrative out there. The two most overcrowded trades on the Street are now Long U.S. dollar (“USD”), and Long Oil/Commodities, as seen from the Bank of America Global Fund Manager Survey below.
Bank of America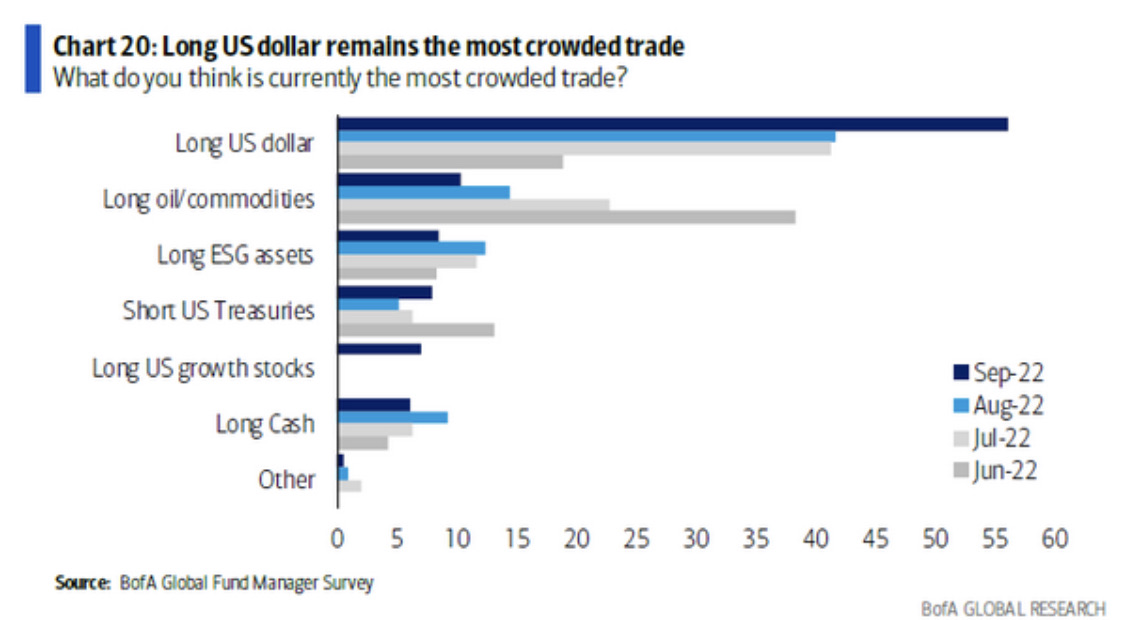
Overcrowded trades rarely perform well, and are vulnerable to sharp unwinds. Looking at the technical charts, it is my belief that commodity spot prices are undergoing a stealth bear market.
Sooner rather than later, inflation expectations are likely to fall to reflect falling commodity prices. Once the macro charts align – lower commodities, lower yields, lower USD, I believe this will bring about a new bull market, especially in growth stocks.
I have shared some of these commodity charts before in previous articles, but they bear repeating.
Copper is a leading indicator of inflation, entering an uptrend in early 2020, ahead of its commodity peers. It is also likely a leading indicator for disinflation. Copper has broken down from a 12-month distribution pattern. This bearish pattern is in the driving seat, and will likely drive prices much lower.
Weekly Chart: Copper
TradingView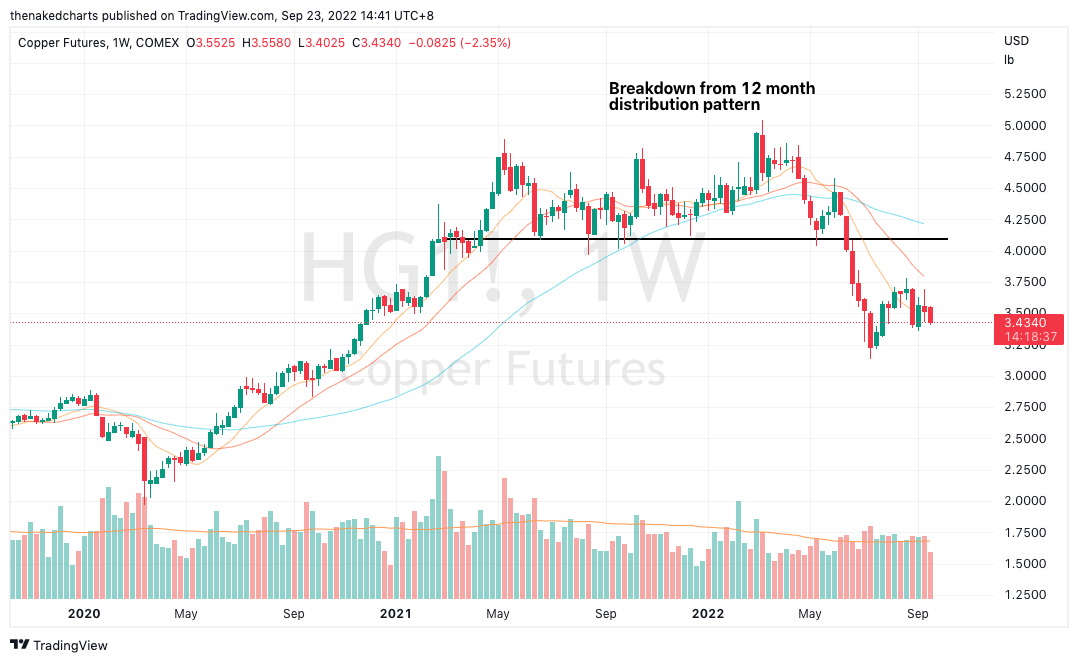
WTI Crude bottomed slightly later than copper in 2020 and is now facing the same technical headwinds as copper. WTI Crude has broken down from a 5-month distribution pattern and recently broke below its multi-month uptrend support. Note that this is an overcrowded trade (as per the BofA survey shared earlier), and we may see precipitous price drops. A sign of weakness is also oil’s inability to rally, despite Putin escalating tensions in Russia’s war with Ukraine this week via the partial mobilization of reserves.
Weekly Chart: WTI Crude
TradingView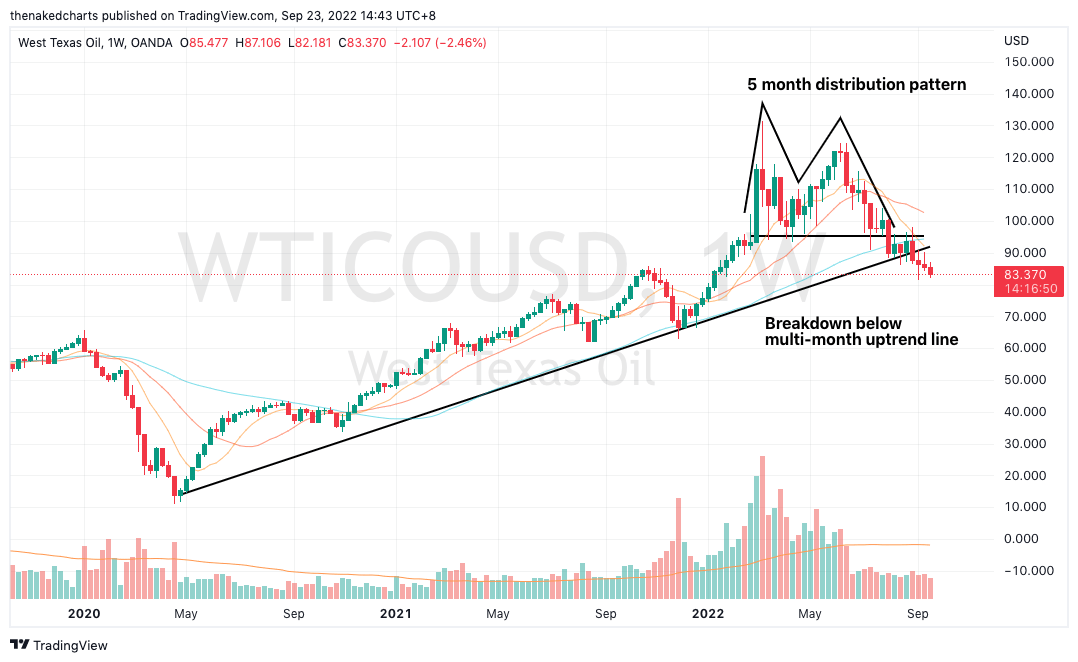
Oil & gas producers (XOP) had taken a longer time to correct relative to spot energy prices. However, XOP now appears to be getting the memo. The sharp selling it faced in mid-June was a red flag, and those losses were going to be difficult to recover from. Now, XOP looks likely to test its long-term uptrend support.
Weekly Chart: XOP
TradingView
Gold (GLD) also looks on the cusp of breaking down below key supports. Silver (SLV) already has, ahead of gold by a few months. Gold has a strong knack of sniffing out inflation, which it did successfully did when it broke out in 2019, away ahead of cyclical commodities. Now, its breakdown from a 2.5-year range could be seen as a strong message that inflationary pressures are likely to subside.
Monthly Chart: Gold
TradingView
The Invesco DB Commodity Index Fund (DBC) provides a good proxy for broad-based spot commodity prices. It is now testing the key support of a massive 7-month distribution pattern. If DBC breaks down, prices are likely to enter a sustained downtrend.
Weekly Chart: DBC
TradingView
The overall picture is incomplete, though. I want to see weakness in the USD and lower yields, which will be beneficial for risk sentiment. While the USD looks parabolic on the chart, there is still no sign of reversal (yet).
Weekly Chart: Dollar Index
TradingView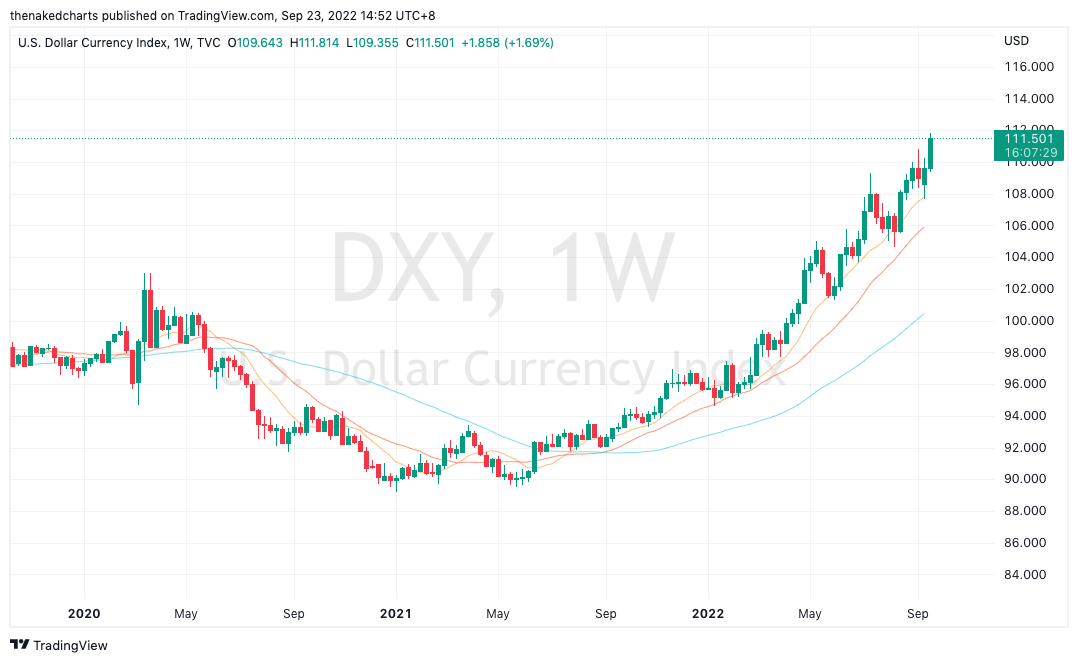
In conclusion, the Fed rate hike would likely have sparked off a lot of fear on the street, and the market is positioned to expect more rate hikes. That is why the long USD and long commodity trades are the most crowded as of September.
Under the surface, commodity spot prices are painting a different picture. If and when other macro charts align (USD and yields), it will present a bountiful opportunity in badly-hit sectors like technology/growth/cryptos. Patience is required, but I think we are getting close.
Be the first to comment