

Dow Jones, DAX 40, FTSE 100, Trader Positioning – Talking Points
- Short exposure to global equities seems to be slowing
- Dow Jones and DAX 30 may fall as long bets increase
- FTSE 100 in consolidation mode with a mixed outlook
What Does Trader Positioning Say About Global Stock Market Trends?
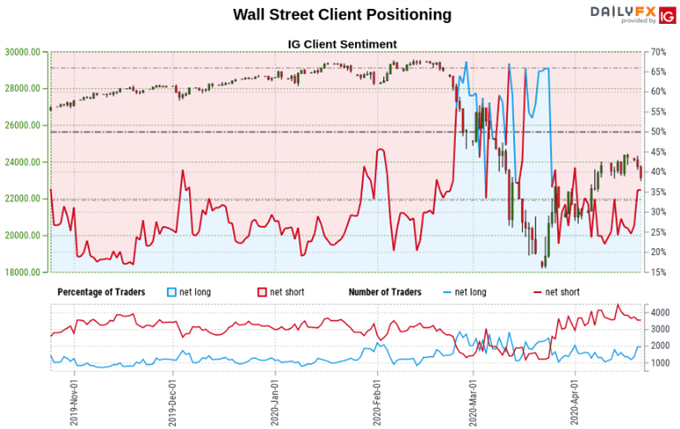
World stock indexes have recently lost some of their upside momentum, particularly amid a collapse in crude oil prices. Investors have also cautiously dialed down short exposure in equities such as the Dow Jones, DAX 30 and FTSE 100. Meanwhile my Wall Street index appears to be showing signs of technical weakness that may prolong the recent downbeat mood from investors. How can traders’ bets impact these trends ahead?
Starts in:
Live now:
Apr 29
( 00:04 GMT )
Recommended by Daniel Dubrovsky
What Do Other Traders Buy/Sell Bets Say About Price Trends?
Dow Jones Sentiment Outlook
According to IG Client Sentiment (IGCS), about 37.37% of retail traders are net long the Dow Jones at the time of writing. The number of traders netlong is about 13.40% higher than yesterday and 25.70% higher from last week. Recent changes in sentiment warn that the current price trend in the index may soon reverse lower despite the fact traders remain net-short.
Dow Jones Technical Analysis
The Dow Jones may also be at risk to turning lower from a technical perspective after prices broke under rising support from last month – green line on the 4-hour chart below. This also followed the presence of negative RSI divergence which was showing fading upside momentum. In the event of further losses, keep a close eye on the support range between 22244 and 22545. A turn higher has resistance eyed at 24327.

Recommended by Daniel Dubrovsky
Improve your trading with IG Client Sentiment Data
Dow Jones Futures 4-Hour Chart

Dow Jones Futures Chart Created in Trading View
DAX 30 Sentiment Outlook
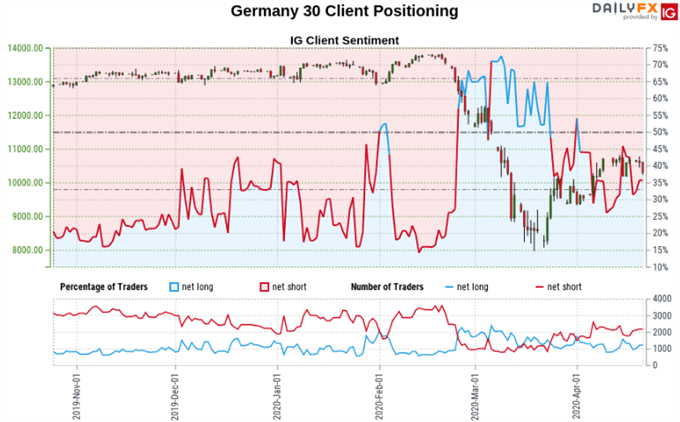
IGCS shows about 45.47% of traders are net long the DAX 30 at the time of publishing. The number of traders netlong is 29.60% higher than yesterday and 36.78% higher from last week, while the number of traders netshort is 24.90% lower than yesterday and 18.68% lower from last week.Recent changes in sentiment warn that the current price trend may soon reverse lower despite the fact traders remain netshort.
DAX 30 Technical Analysis
The DAX 30 is eyeing key rising support from last month’s bottom – red line on the 4-hour chart below. This would then place the focus on the late March and early April inflection point between 9929 to 10205. A descent through this barrier exposes current lows from this month at 9300. Otherwise a turn higher has resistance waiting at 10811 in order to resume the uptrend.
DAX 30 Futures 4-Hour Chart

DAX 30 Futures Chart Created in Trading View
FTSE 100 Sentiment Outlook
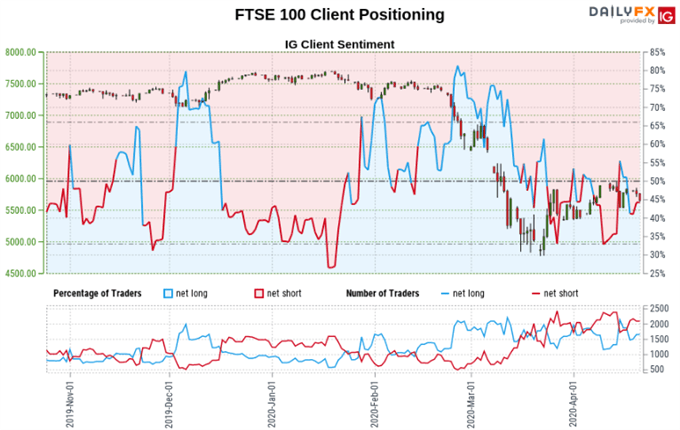
About 48.06% of retail FTSE 100 traders are net long at the time of writing according to IGCS. Those traders net long are about 18.35% higher than last week while investors short over the same period declined by roughly 3.92%. Overall, the combination of current sentiment and recent changes produces a further mixed FTSE 100 trading bias.
FTSE 100 Technical Analysis
From a technical perspective, the FTSE 100 remains in a consolidation mode since late March. The outer boundary of resistance sits at 5861 with the lower boundary of support at 5399. What may uphold an upside bias down the road is a rising trend line from March’s bottom. Clearing resistance exposes the February-March inflection point between 6443 to 6533.
FTSE 100 4-Hour Chart
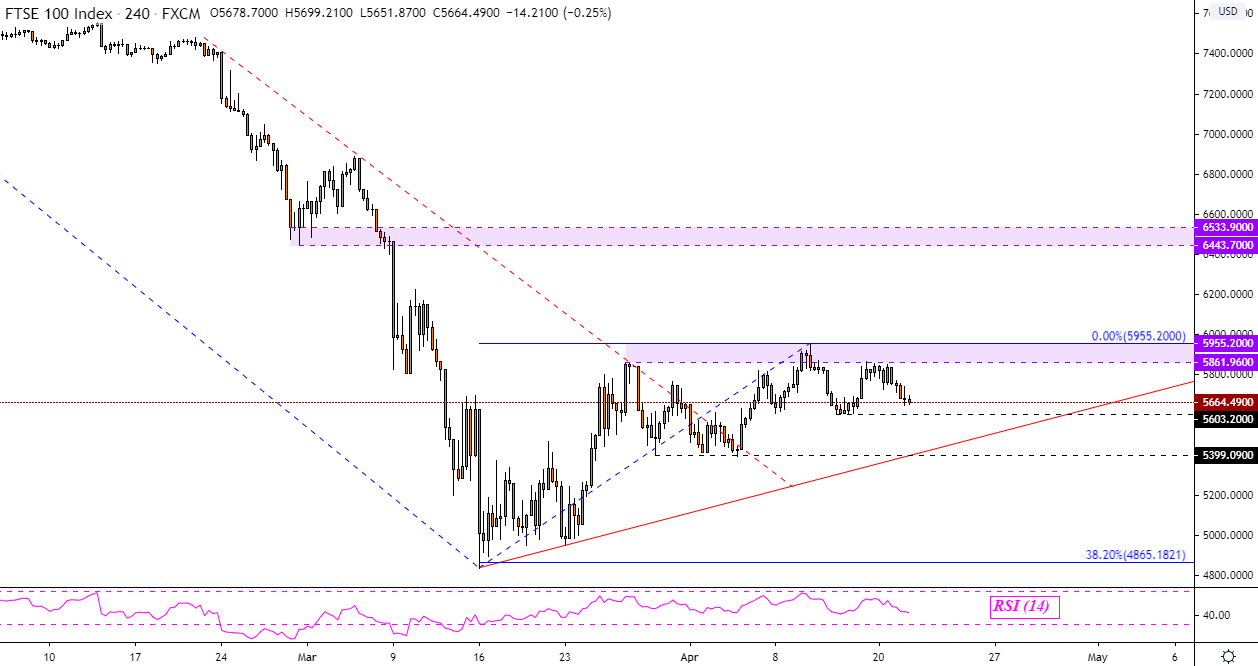
FTSE 100 Chart Created in Trading View
*IG Client Sentiment Charts and Positioning Data Used from April 21 Report
— Written by Daniel Dubrovsky, Currency Analyst for DailyFX.com
To contact Daniel, use the comments section below or @ddubrovskyFX on Twitter
Be the first to comment