

JackF/iStock via Getty Images
Intro
If we pull up a chart of Lennar Corporation (NYSE:LEN), we see that the stock’s 10-week ($81.96) moving average recently crossed above the 40-week counterpart ($79.30). These moving averages are often used by trend followers to detect early signs of a trend change. Furthermore, we also see signs of a trend change in the popular ADX technical indicator, which also gave a buy signal not long ago on the intermediate chart.
The pattern which seems to be playing out here is an ascending triangle, which is a bullish pattern irrespective of where it appears on a technical chart. The reason being is that the pattern of higher highs indicates accumulation as buyers start to enter the picture. The attractiveness of the pattern is the height ($25+) of the same. Any sustained move above $90 a share on strong volume will be a key signal that the bullish triangle is indeed confirmed.
Seeing what was taking place, we decided to buy the $80/$82.50 February bull call spread on the 16th of November last for $1.62 per spread. We recommend that our subscribers always only use 1% of their net lick on each option position they take out. Following this rule governs how many call spreads for example one then buys. With 73 days to expiration, the spread is now trading for $1.56 per call spread with shares after having pulled back somewhat in recent sessions to $85.79. We remain bullish in both our strategy and position for the following reasons.
Lennar: Bullish Technicals (StockCharts)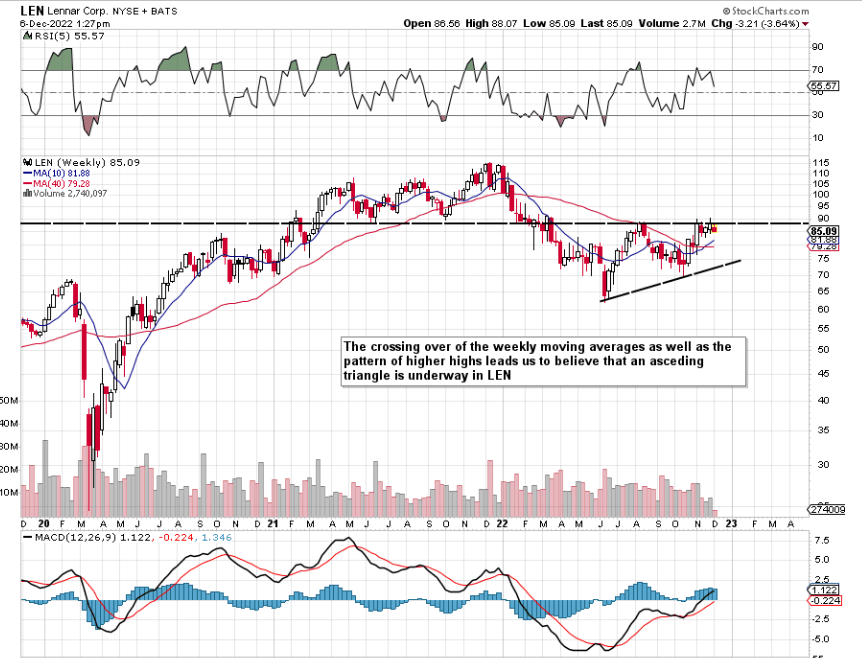
Strong Profitability Coupled With Attractive Value
When it boils down to it, the value of the company pertains to the relationship of the stock’s valuation to its profitability. Lennar’s forward GAAP earnings multiple of 5.37 is below its trailing multiple (5.76), below Lennar’s 5-year average (9.77), and significantly below what the sector is trading at (13.59). Furthermore, bottom-line estimates for this fiscal year have been very stable over the past six months, so this trend gives weight to those earnings multiples noted above.
From a profitability standpoint, the company’s return on capital tops 16%, which again is well ahead of both the sector (6.59%) and what we have seen from Lennar historically (8.59% – 5-year Average). Furthermore, Lennar’s most recent quarter delivered a net income margin of almost 17%. This percentage comes in meaningfully ahead of the company’s 14.04% trailing 12-month margin (Momentum).
With respect to strategy (Bull Call Debit Spread), we chose this strategy for a few reasons. Firstly, by going out to the February cycle (Buying more time), we were able to lower our break-even over the December strikes at the time by buying more extrinsic value. Our break-even in this position now comes in at $81.62, which is well below the bottom side of the breakaway gap we see below. This is the advantage of buying call spreads (which have sufficient time) over the stock outright. Since our breakeven now is below the prevailing share price, the probability of profit in the position is above the 50% mark.
Lennar: Breakaway Gap (StockCharts)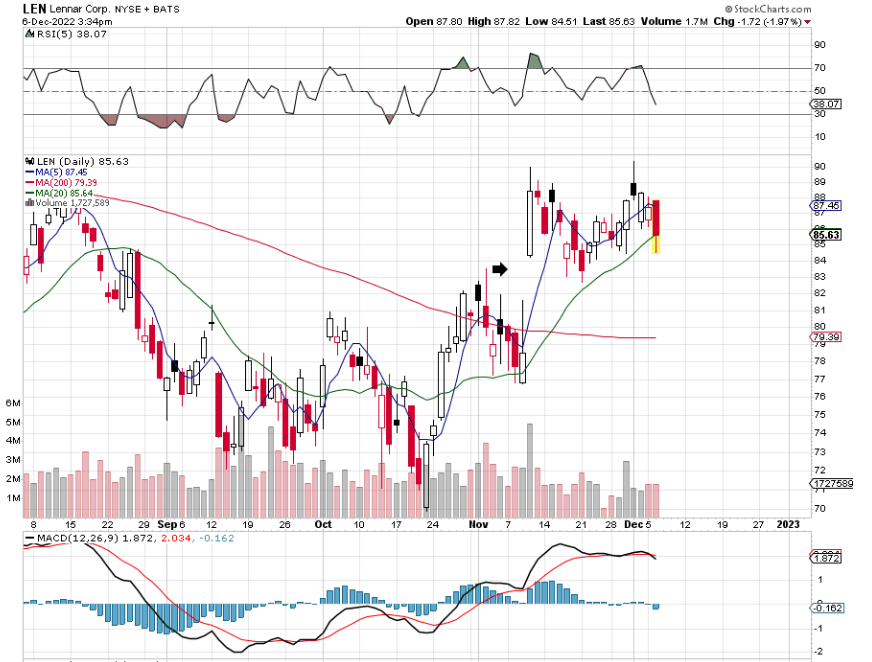
Implied Volatility On The Rise
Suffice it to say, with both options of the spread currently in the money, we will continue to make money from theta decay as extrinsic value continues to come out of those options. Furthermore, as we see below, implied volatility at present in Lennar is on the rise and also well below the stock’s historical volatility. Therefore, we expect to see a sustained rise in implied volatility over the next weeks, which will help our position as we are essentially option buyers. What this means is that the higher the volatility goes (Vega), the more the prices of our options increase, all things remaining equal.
Lennar: Implied Volatility V Historic (Interactive Brokers)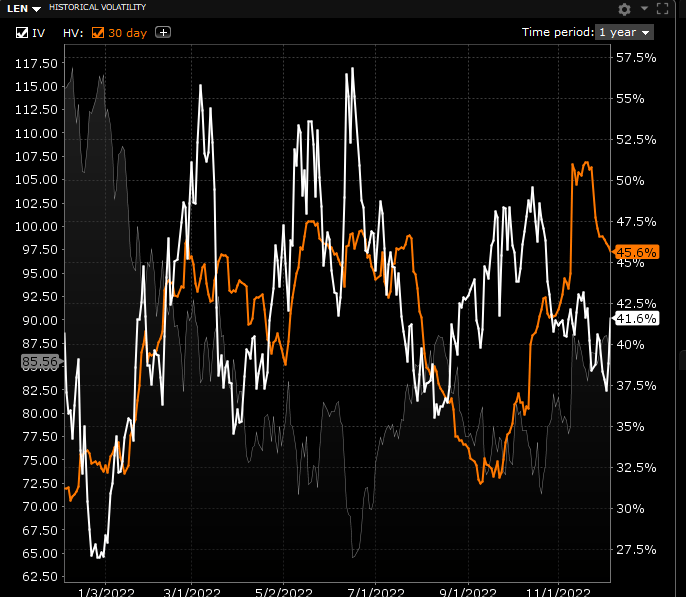
Conclusion
Therefore, to sum up, with shares of Lennar trading just below the $86 level at present, we still believe there is significant upside in this play for a number of reasons. For one, the stock’s valuation and profitability trends look really attractive and forward-looking earnings revisions remain very stable. The company’s solid fundamentals have resulted in a bullish triangle on the technical chart, which led us to getting long the stock through the call debit spread strategy. Let’s see how December turns out. We look forward to continued coverage.
Be the first to comment