

GOCMEN/iStock via Getty Images
Last week I suggested that we could be at a turning point whereby the bearish consensus finally starts leaning bullish after realizing that earnings, economic growth, and the Fed’s rate-hike cycle are not as bad as feared. Considering that we just capped the best performing month in the stock market since November 2020, I’d say the turn is in. The broad-based rally was led by four of the five mega-cap technology stocks, which still account for nearly one quarter of the value of the S&P 500. Earnings reports and outlooks were well received from Apple, Amazon, Google, and Microsoft, while Meta Platforms, otherwise known as Facebook, was the only disappointment. While GDP for the second quarter declined again, meeting the loose definition of a recession, consumer spending remained resilient. The Fed raised rates by 75 basis points, but Chairman Powell acknowledged that we are making progress in slowing growth, which reduced expectations for rate hikes later this year. If we can see a meaningful decline in the headline inflation numbers for July, which will be reported in August, this bear-market bounce could become a baby bull market.
Edward Jones 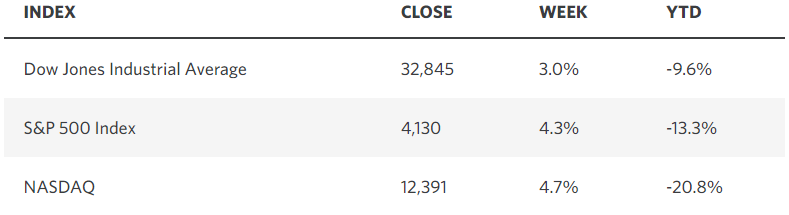
We are halfway through earnings season, and the results are impressive, considering the headwinds. According to FactSet, the earnings beat rate for the 56% of the companies in the S&P 500 that have reported has been a healthy 73% with all 11 sectors reporting year-over-year revenue growth of 10% or more. Most importantly, the earnings growth rate for the index in the second quarter has increased from 4% at the beginning of the month to 6% today. The revenue growth rate has increased from 10.1% to 12.3%. Earnings are not as bad as feared. The most encouraging aspect of this earnings season is that estimates for the remainder of this year and next are coming down, but stock prices are still rebounding. This is largely because valuations have fallen below their 5- and 10-year moving averages. This sets a much more realistic bar for beats moving forward.
FactSet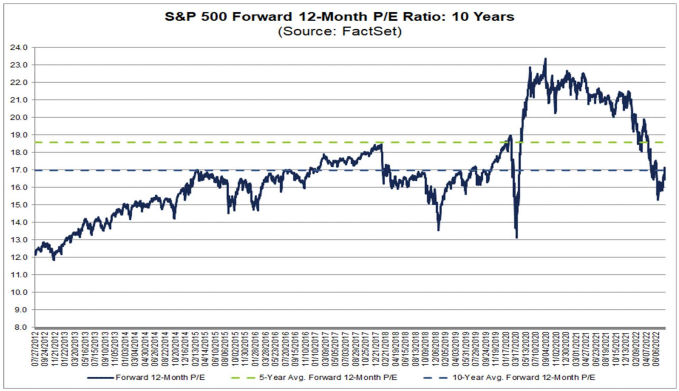
The recession debate may continue after last week’s negative print, but the body of eight economists who make up the National Bureau of Economic Research’s committee and call the shots are likely to say the expansion continues. This is because their definition of a recession is “a significant decline in economic activity that is spread across the economy and that lasts more than a few months.” The key word here is “spread,” which I don’t think can be met when consumer spending, which accounts for 70% of the economy, grew in both first and second quarters of the year. Additionally, the labor market was strong. In fact, all six factors used to make the official decision have shown expansion since the beginning of the year. There is no recession.
Yahoo Finance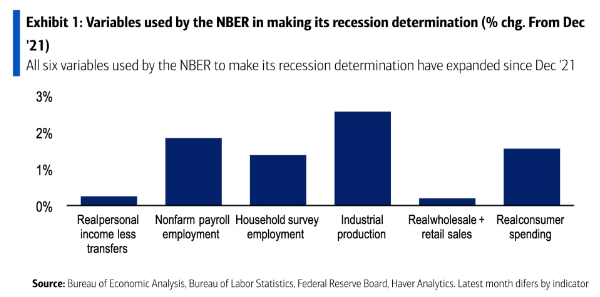
The reason this debate is relevant is that bear-market declines accompanied by an official recession are far worse and last longer than ones that are not. Therefore, if we can conclude with a high degree of certainty that we are not in recession, as I do, then the probability that the June low was the ultimate low increases dramatically. Bear markets not accompanied by recessions last an average of four months and realize declines of 22%. We exceeded both during the first six months of this year. Bear markets in concert with recessions average declines of approximately 37% and last more than a year. The GDP report was not as bad as feared because the source of weakness was inventories and housing rather than the engine of economic growth—consumer spending. This is why the market responded favorably.
While there was much trepidation about last week’s rate hike by the Fed, which resulted in back-to-back increases of 75 basis points in the Fed funds rate to a range of 2.25-2.5%, the stock and bond markets looked forward at expectations for inflation and the potential for additional rate increases. Both eased, which is why risk assets rebounded. Again, this was not as bad as feared.
Investors now see short-term rates peaking at a range of 3.25-3.5% after a rate increase of 50 basis points in September and two 25-basis-point increases in November and December. These are followed by a rate cut in May. This is a lower peak rate than what was expected just a couple of weeks ago, and it is due to the rapid slowdown in the rate of economic growth and lower inflation expectations.
Edward Jones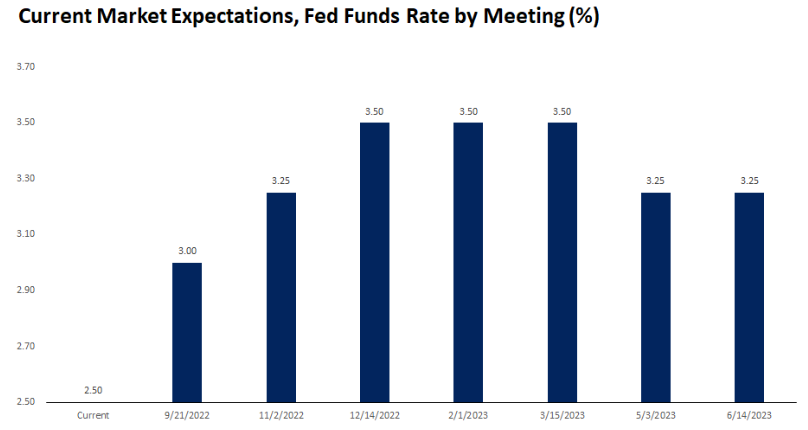
While the core rate for the personal consumption expenditures (PCE) price index appears to have peaked, the nominal rate that includes food and energy has not proven so yet.
Briefing.com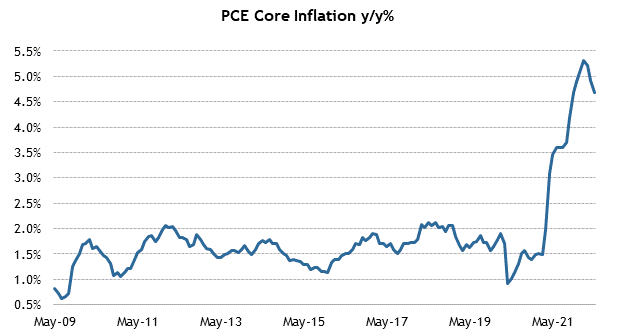
I think that will happen in August with the headline inflation reports for July. Oil prices have fallen sharply over the past 60 days along with several other hard and soft commodities. The year-over-year comparisons become a lot more difficult for crude oil as we move into the fall months, which is when oil rose to as high as $85 per barrel. What was as much as a 100% year-over-year increase would fall to approximately 25% at today’s price.
Stockcharts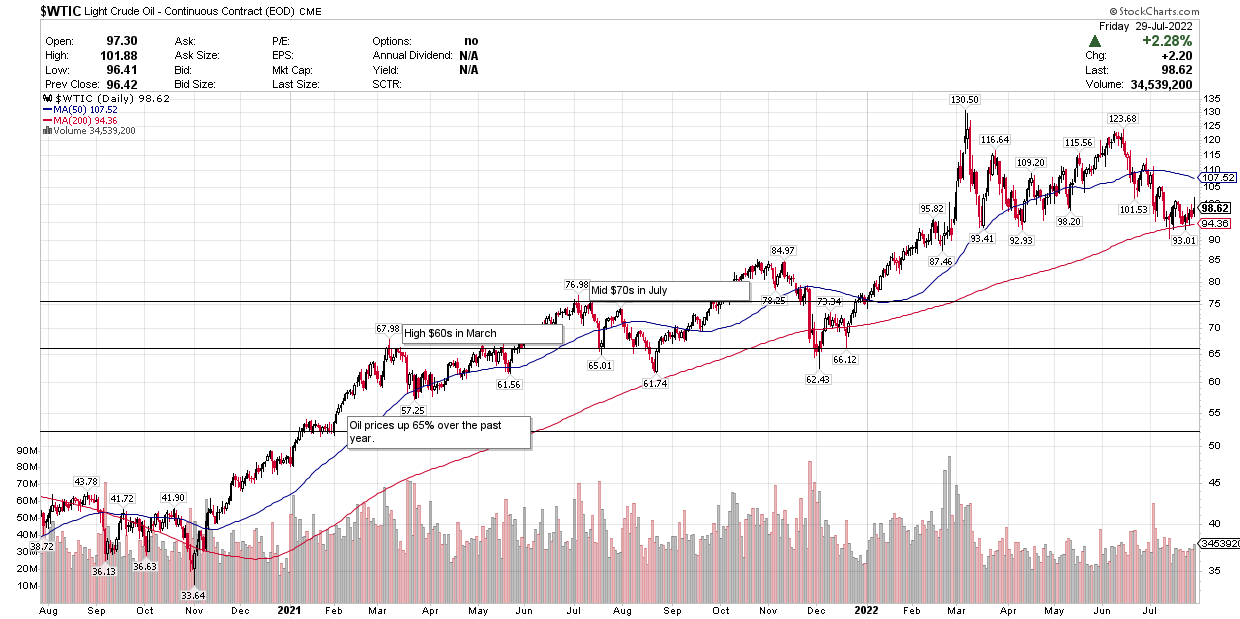
Last week’s sector performance was as pro-growth as the week before with cyclical sectors outperforming defensive ones. In my opinion, this is indicative of a soft landing that results in a modest increase in the rate of economic growth as we approach year end. That is conditioned on the rate of inflation subsiding, and the Fed completing its rate-hike cycle this year.
Finviz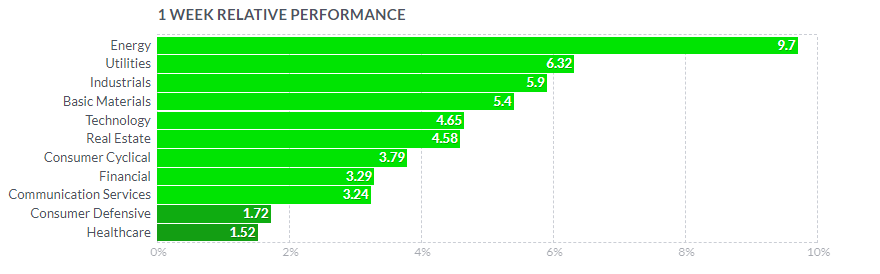
Now a word of caution, because as much as I welcomed last month’s rally and the increasing probability that June marked the bear-market low, I do not want to see the major market indexes march back to their January highs any time soon. The reason being that the second-half recovery is based on the porridge not being too hot or too cold, but just right. The surge in stock and bond prices over the past month has resulted in a significant easing in financial conditions, which is NOT what the Fed wants to see at this juncture. If the U.S. economy is to thread the needle to a soft landing, then we need to see very gradual improvements rather than a revival of the speculative fervor that helped induce price increases. Pullbacks that result in higher bottoms will be the glue that makes the uptrend stick.
Bloomberg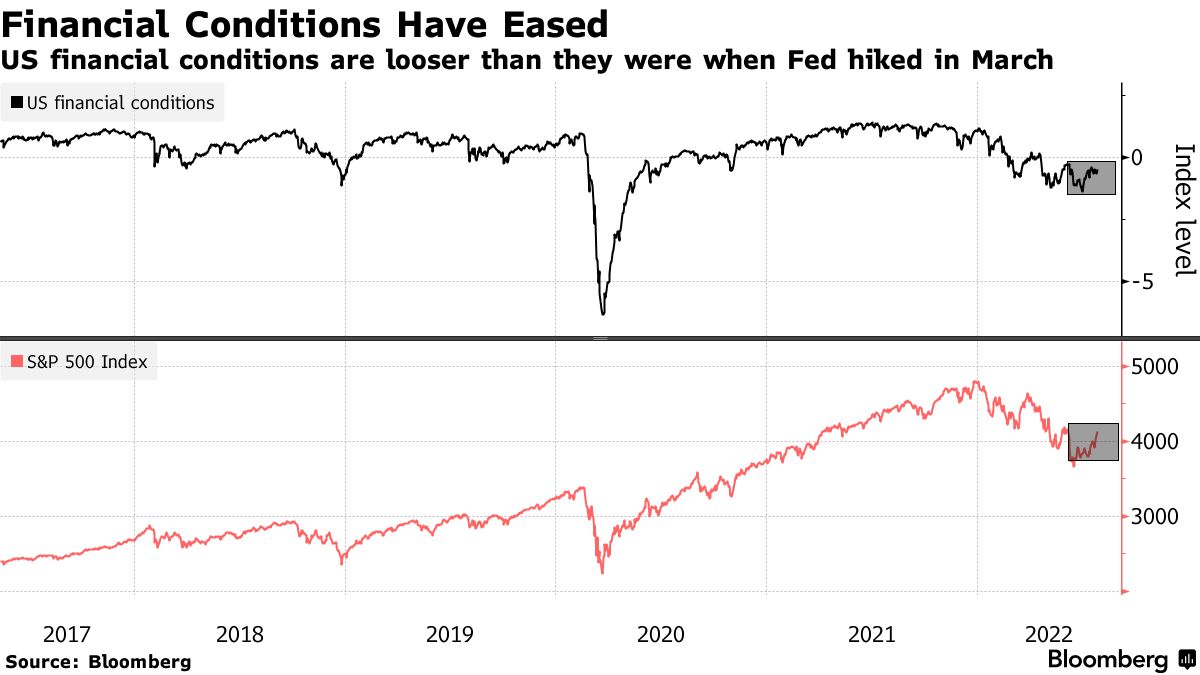
Economic Data
In addition to more than 100 companies in the S&P 500 reporting this week, we have the jobs report for July on Friday, which needs to cool in terms of the number of new jobs and wages in order to keep inflation expectations in check.
MarketWatch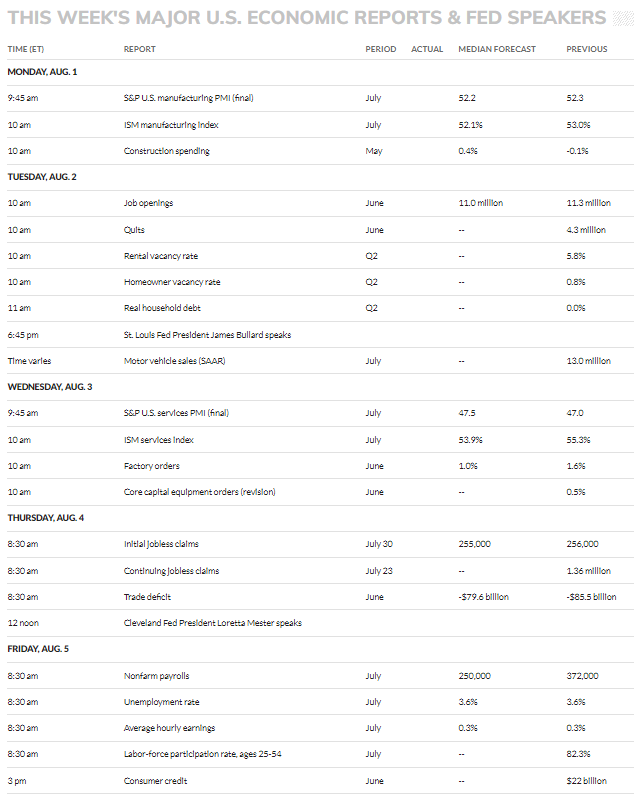
Technical Picture
We are very near what I consider to be overhead resistance at 4,150-4,200 on the S&P 500, so I would not be surprised to see a pullback to the 50-day moving average at approximately 3,900 from current levels.
Stockcharts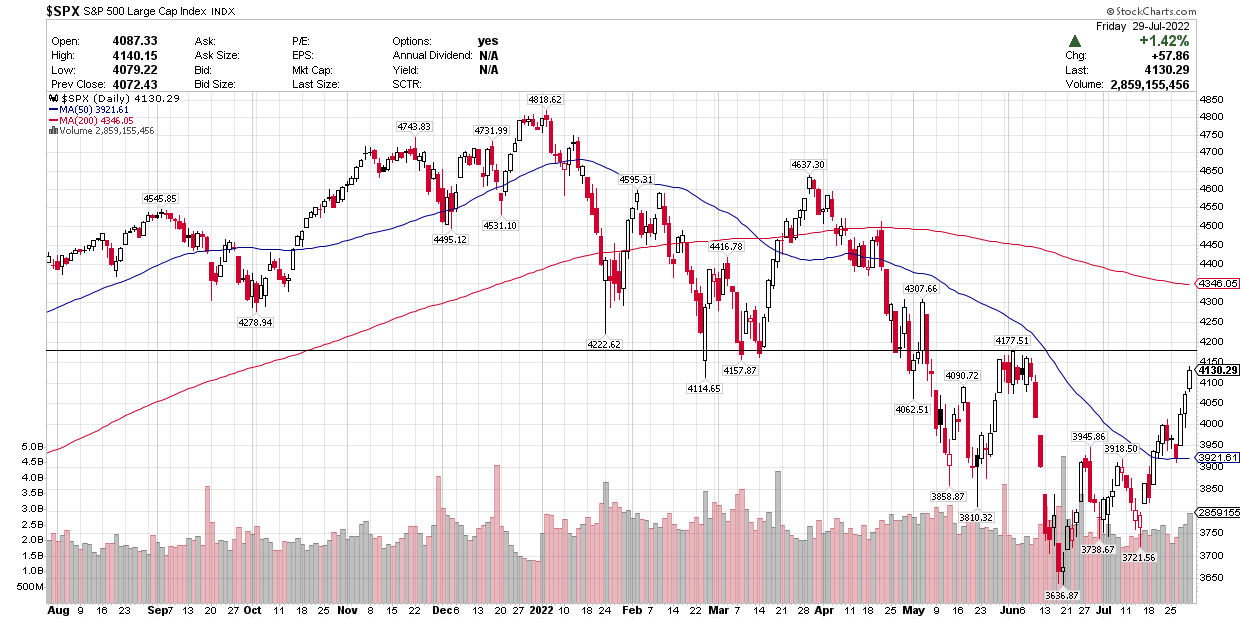
Be the first to comment