

Eoneren/E+ via Getty Images
There are different definitions and implementations of long-only momentum, so we start with the definitions used in this article:
Cross-sectional momentum (CSM): Stocks are ranked according to relative performance in a lookback period, and the strongest are selected to go long in a portfolio.
Price-series momentum (PSM): Stocks are selected based on their absolute performance in a lookback period. If there are more signals than allowed, the winners are ranked according to their performance in the lookback period.
In this article, our stock universe is the S&P 500 index. We use Norgate data and their series that include delisted stocks to remove any bias from the analysis. The relative performance rank method is based on the 12-month rate-of-change and the absolute performance measure is the 12-month moving average cross.
Specifically, in the case of CSM, at the end of each month, we rank all listed stocks in the S&P 500 at the time and select the top ten according to the 12-month rate-of-change. The portfolio is rebalanced accordingly.
In the case of PSM, we chose the top ten stocks with prices above the 12-month moving average. If there are more stocks than allowed in the portfolio (10), then we use the 12-month rate-of-change to select the strongest. Rebalancing occurs when the price of a stock drops below its 12-month moving average.
The results below are based on backtests and do not include commissions and slippage. The purpose is to perform a comparison between the two long-only momentum methods. The backtest period is from 01/29/1993 to 09/16/2022, and the first date was selected to be the inception date of the SPY ETF (SPY).
Cross-Sectional Long-Only Momentum Performance
Yearly Returns Of Cross-Sectional Long-Only Large Cap Momentum (Price Action Lab Blog – Norgate Data)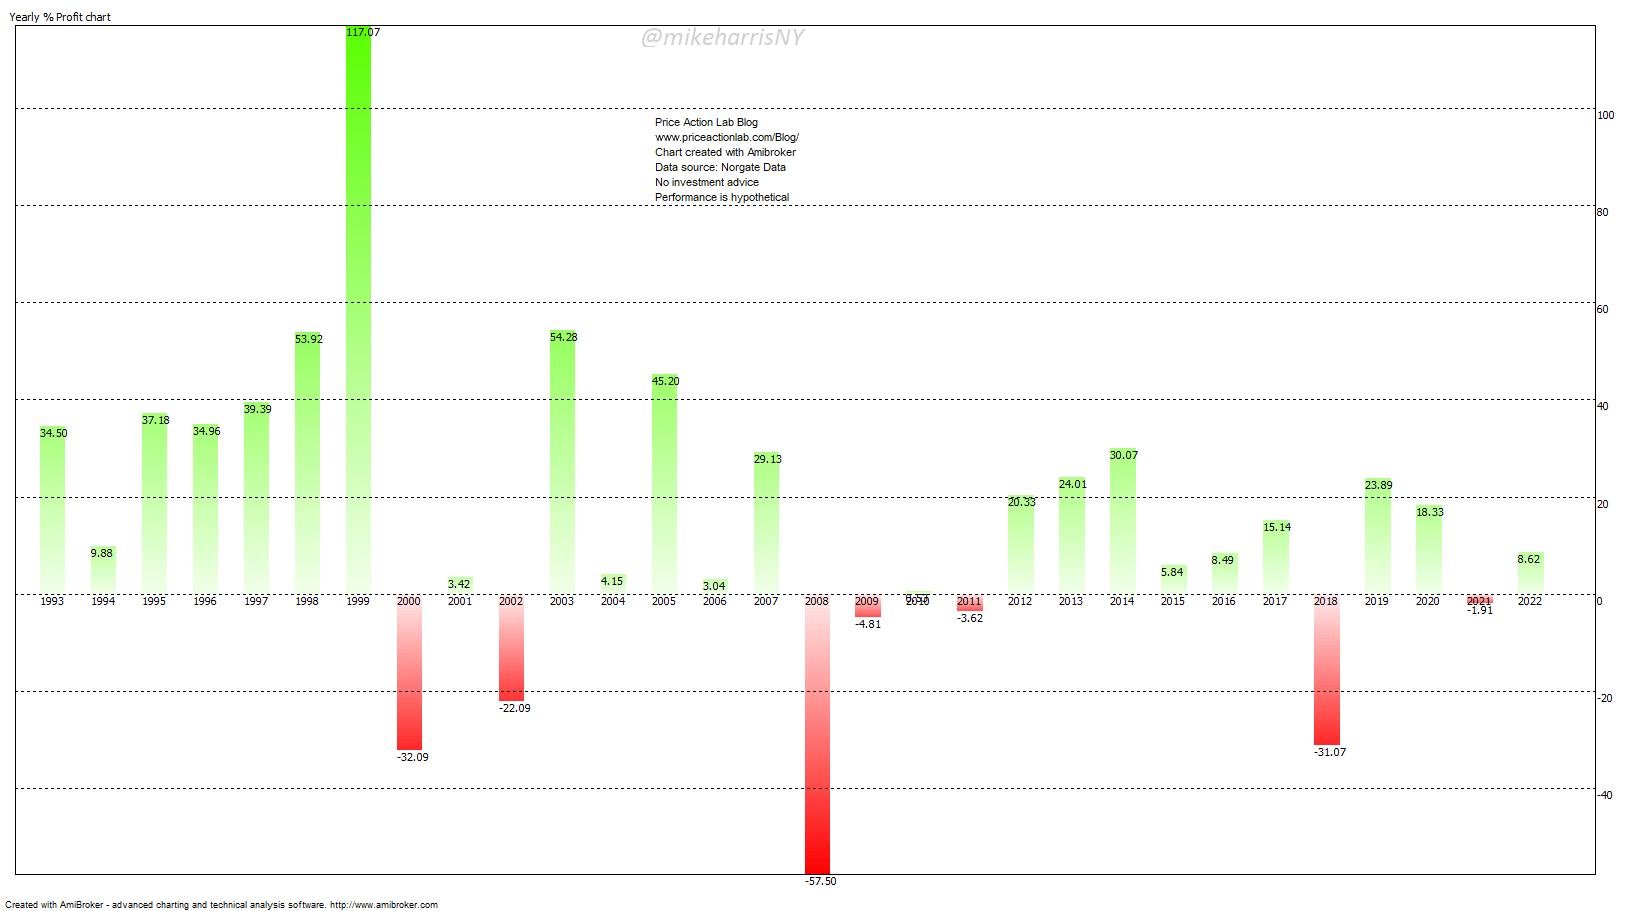
CSM was strong in the 90s but has since lost a large fraction of its own momentum. Note that although CSM was highly unprofitable in the dot-com and GFC bear markets and also in 2018, year-to-date it shows a positive return of about 8.6% (less the cost of friction).
It is possible CSM was an anomaly of the 90s and it is slowly disappearing, while the year-to-date return is random.
The maximum drawdown is 65.4%. Below is the drawdown profile chart.
Drawdown Profile of CSM (Price Action Lab Blog – Norgate Data)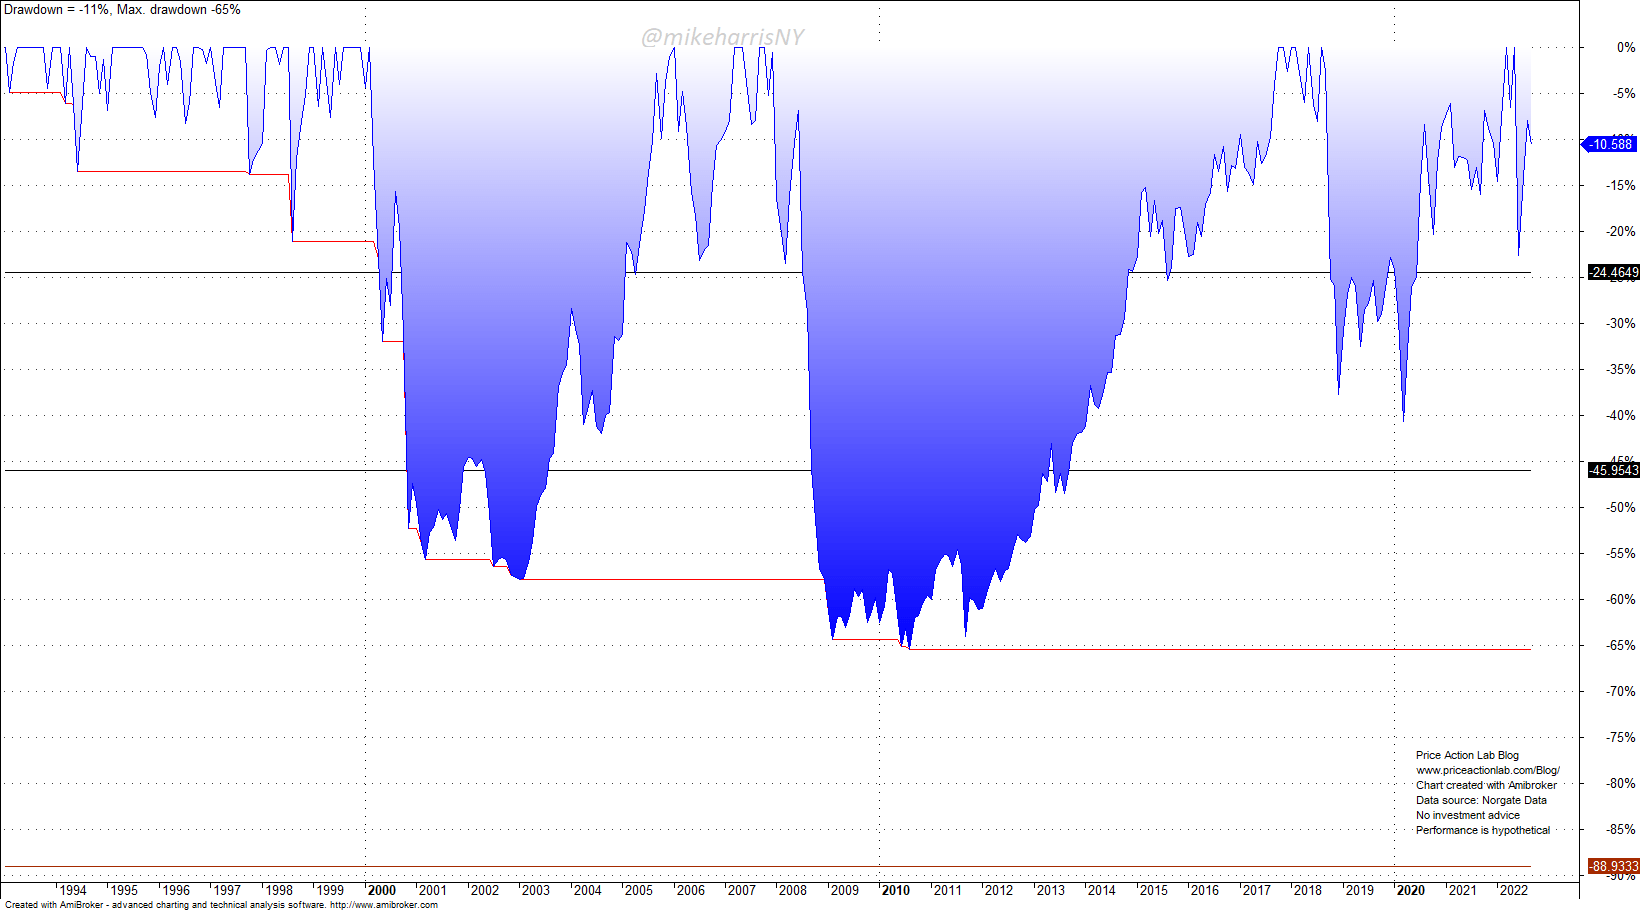
The drawdown profile chart depicts high risks with two peaks of more than 55% and one reaching 65%. The high annualized return of 11.2% of CSM was delivered at high risk. See below for more details.
Price-Series Long-Only Momentum Performance
Yearly Returns Of Price-Series Long-Only Large Cap Momentum (Price Action Lab Blog – Norgate Data)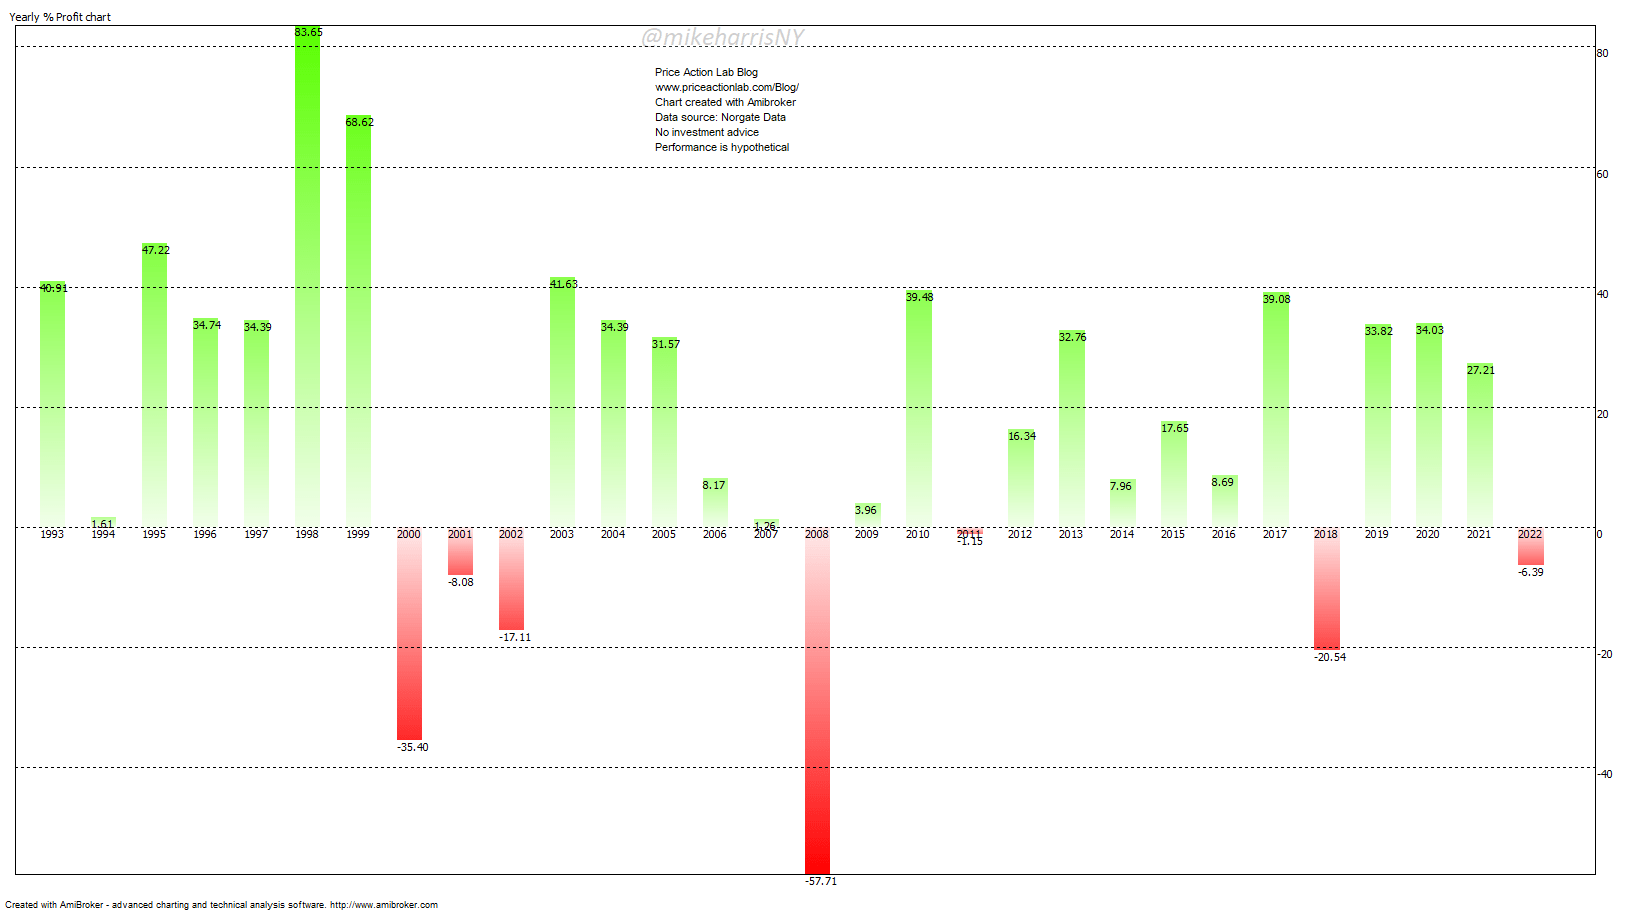
The performance of PSM is much more robust and also higher than the performance of CSM. Specifically, recent performance from 2019 to 2021 does not show the same deterioration signs as in the case of CSM and is comparable to the performance in the early 90s. Therefore, the PSM anomaly appears to have retained its strength despite being popular.
PSM has delivered more excess alpha than CSM: the annualized return is 14% versus 11.2% for CSM. However, the maximum drawdown is nearly 68%, as shown below.
Drawdown Profile of PSM (Price Action Lab Blog – Norgate Data)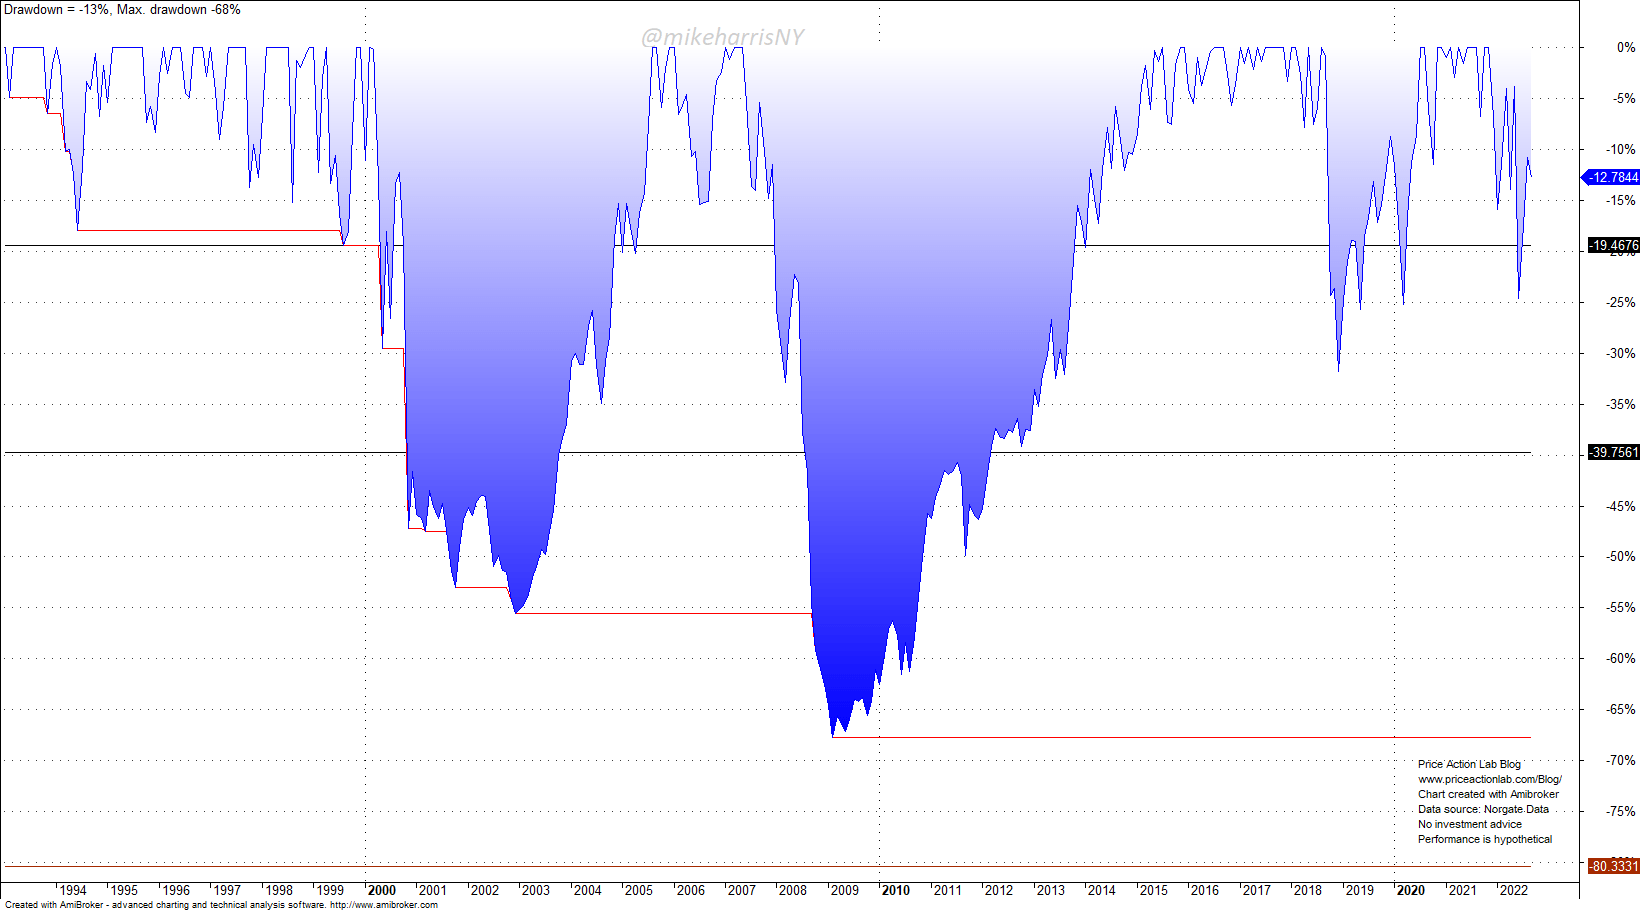
PSM suffers during bear markets. There is another condition that can affect PSM and is not reflected in the above data because it has never occurred in US markets in recent history: an extended sideways market.
The biggest risk to PSM is the possibility of a multi-year consolidation in US stocks. In that case, losses can grow over 50% or even become larger than those in a bear market. This is because sideways price action causes many false signals for moving averages.
Performance Comparison
Below we compare the performance of CSM, PSM, and SPY ETF buy and hold, in the backtest period.
| CSM | PSM | B&H | |
| Annualized return | 11.2% | 14.0% | 9.6% |
| Max. Drawdown | -65.4% | -67.7% | -55.2% |
| Volatility | 25.4% | 25.6% | 18.9% |
| Sharpe ratio | 0.44 | 0.55 | 0.51 |
| Trades | 3,192 | 364 | |
| Win % | 55% | 44% |
(1) PSM has provided the highest excess return of 4.4% but at a high drawdown and risk. This can be seen from the comparison of equity curves below:
CSM, PSM, and B&H Equity Curves (Price Action lab Blog-Norgate Data)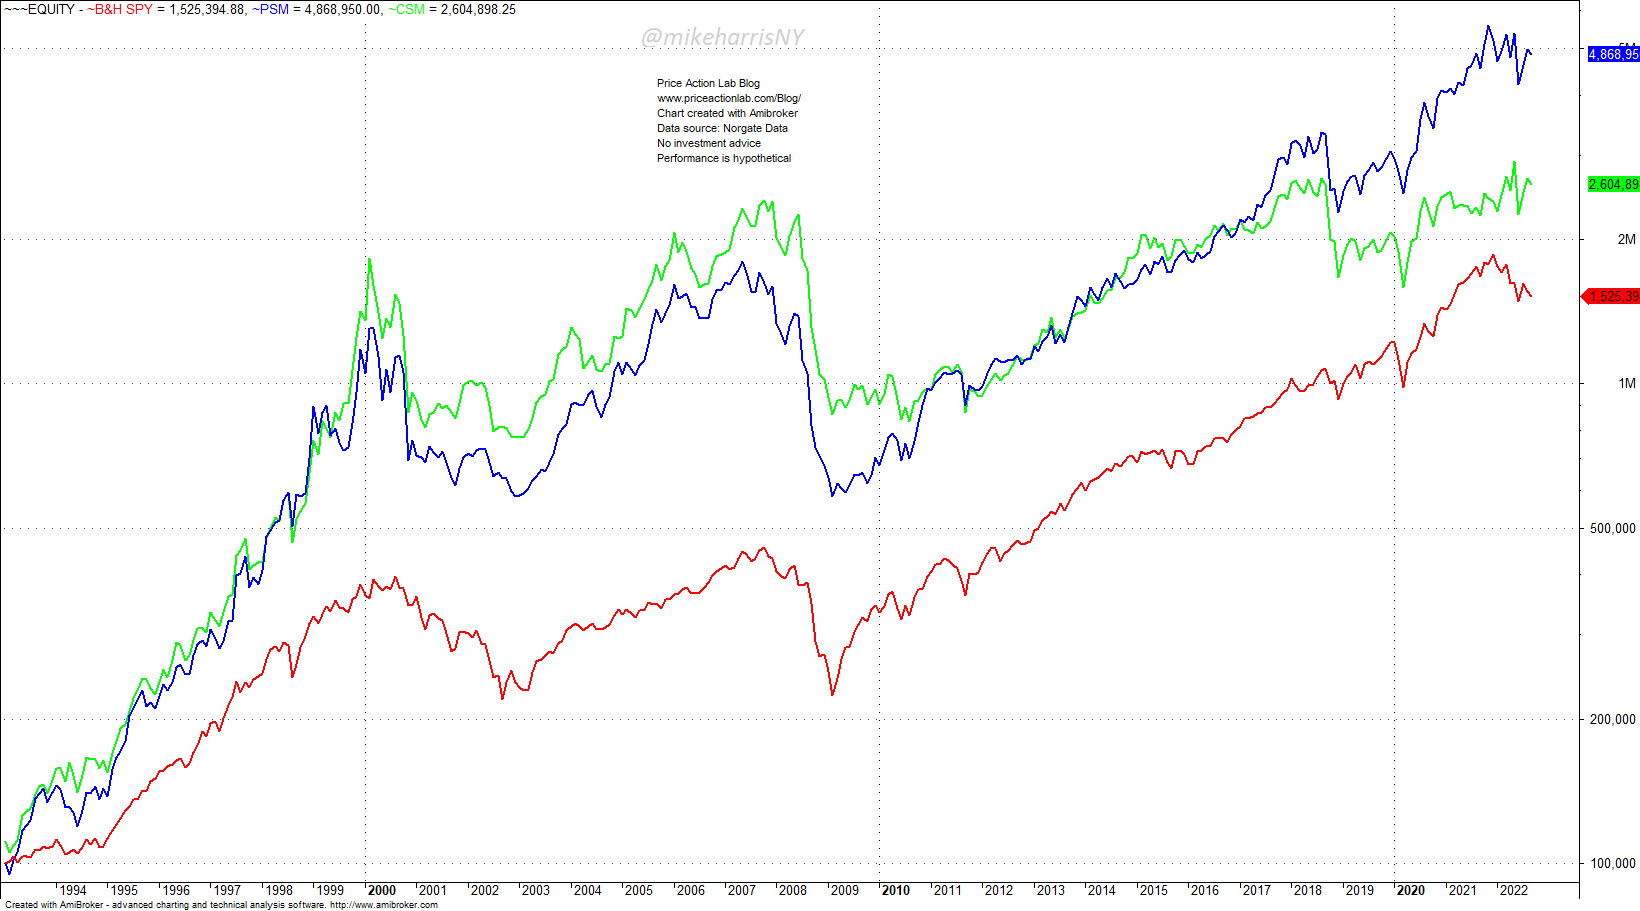
The red line is SPY buy and hold. The blue line is PSM and the green line is CSM. Note that PSM and CSM performance were close until mid-2018, but afterward, they started diverging.
(2) CSM has a higher turnover as compared to PSM by nearly one order of magnitude. In addition, given the sluggish performance in recent years, CSM is falling out of favor.
(3) The biggest risk to PSM is a long sideways market in US stocks. In this case, losses can accumulate to levels seen in severe bear markets. Note that passive investors are not affected as much in sideways markets.
Open Positions
Both CSM and PSM are long the following stocks as of August 31, 2022:
DVN, OXY, MRO, CTRA, APA, COP, CF, PXD
CSM is also long: XOM, VLO
PSM is also long: MCK, EOG
The entry dates of the above positions vary a lot for CSM and PSM.
Conclusion
We have seen that large-cap price-series and cross-sectional momentum have delivered high excess returns in the past, but at higher risks, even when compared to buy and hold.
The cross-sectional momentum anomaly is probably disappearing, although year-to-date the return is positive. Another run similar to that in the 90s is unlikely in the future.
The price-series momentum anomaly displays more robustness but is very sensitive to bear and long sideways markets. Any excess returns come at a very high risk.
All in all, these methods for trading large-cap stocks appeal only to speculators and those who have advanced means of managing risk. From the risk angle, there is no advantage to employing momentum methods, unless they are part of a broader ensemble of strategies. Traders and investors who attempt to use momentum without understanding the risk may be caught by surprise.
Be the first to comment