

Pgiam/iStock via Getty Images
A few weeks ago, the CBOE equity “puts to calls” ratio went to the highest level in the last 20 years, even above the levels reached during the 2007-2008 financial crisis. This classic indicator of investor sentiment, first introduced to investors in a 1971 Barron’s article written by Martin Zweig, measures what investors expect from the stock market by measuring what they are doing in the options market.
This ratio acts as a contrary opinion indicator. When investors start buying more than the normal number of puts compared to calls, it signals a bearish bias in their expectations. This occurs when the price decline is usually over, and higher prices lie ahead. The normal ratio is usually 6.5 puts for every ten calls. The current high ratio of 9 puts strongly points to higher stock prices.
CBOE Equity “Puts to Calls” Ratio (Michael McDonald)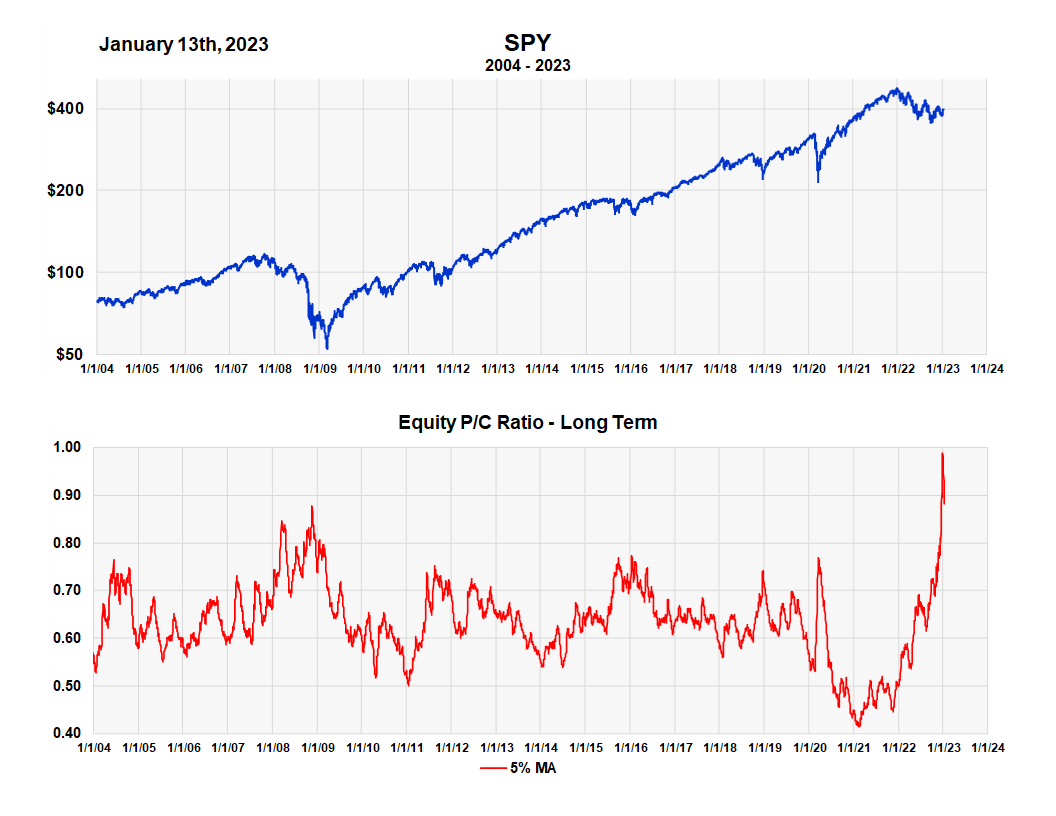
The level of “put buying” in large ETFs like SPY and QQQ has been just as insightful.
While earnings and economic factors determine stock values, it’s what investors are “thinking” and “doing” about the data that moves markets. Since these two largest ETFs essentially represent the stock market, measuring investor buying of puts and calls in these ETFs should confirm this chart. And they do; the level of “put buying” in both SPY and QQQ seems to confirm what the CBOE equity puts to calls ratio is saying – that stock prices are headed higher.
“Put buying” in QQQ and SPY
One can measure the “puts to calls” ratio in two different ways. The standard way, like the CBOE equity “puts to call” ratio, is to form a ratio of the number of put contracts purchased divided by the number of call contracts over a specified period of time. We use 20 days. This generally works very well for the overall stock market. However, when it comes to individual stocks and ETFs, we get better results using another method.
The standard method doesn’t measure how much money is going into puts and calls; it’s just a ratio of the number of contracts purchased. Suppose puts were three times more expensive than calls. The ratio of contracts might be one to one, but the ratio of money would be 3 to 1.
So, it’s important to calculate the ratio of the amount of money going into puts divided by the amount going into calls. This ratio is called the ratio of “premiums.” The charts below are premium ratios for SPY and QQQ.
“Puts to Calls” Ratio of QQQ Premiums (Michael McDonald)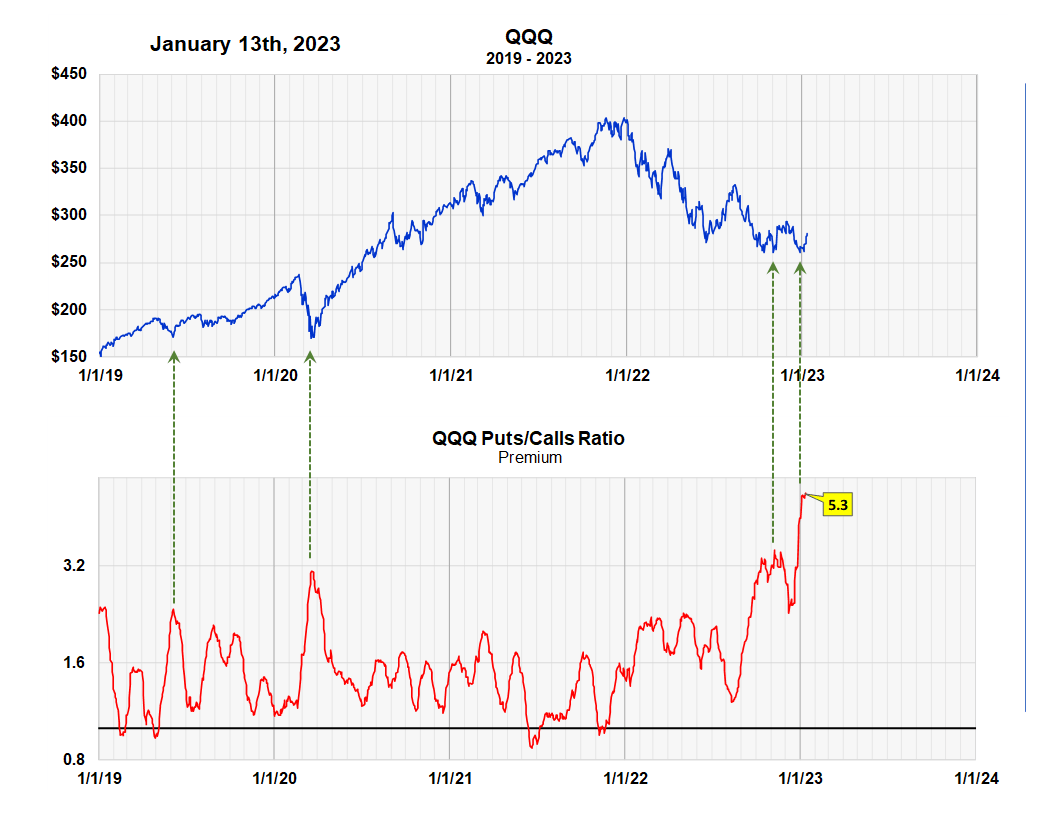
The first chart is for QQQ. The normal premium puts to calls ratio for this ETF is about 1.3. We’ve indicated with green arrows moments when the ratio went considerably above the norm. Each was associated with a local price low in QQQ. The current ratio of 5.3 is the highest ratio in the last four years. It means that five times more money is going into to puts than to calls.
“Puts to Calls” Ratio of SPY Premiums (Michael McDonald)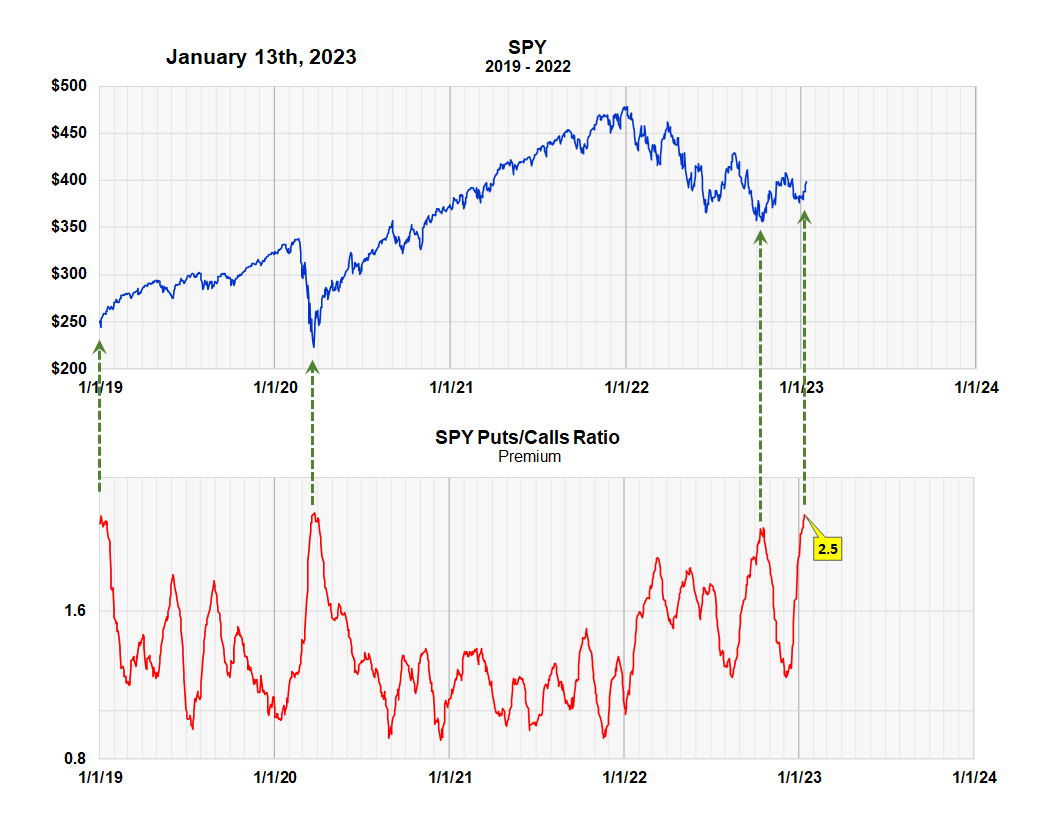
The normal premium puts to calls ratio for SPY is also around 1.3. We’ve indicated with green arrows moments when the ratio spiked to higher levels. As the chart shows, the current ratio of 2.5 is where it was at the market low in March 2020 during the pandemic bear market.
Takeaway
Three measurements of options activity – the classic CBOE equity puts to calls ratio, and the “puts to calls” premium ratios in both SPY and QQQ – confirm one another, and all point to higher stock prices ahead.
Be the first to comment