

aluxum
Earlier this year, I wrote a detailed article on Ladder Capital Corp (NYSE:LADR) in which I titled the article “my #1 mREIT for 2023.” I explained that whenever “I analyze a company, I always look hard at the managers who are running the business, always paying close attention to the sustainability of earnings.”
Why Ladder?
As you may know, I’ve been covering Ladder for over seven years, and in my inaugural article (2015) I explained that “in my quest for durable income I seek to maintain a tactically balanced portfolio that includes a combination of safe income sprinkled with higher yielding components.”
Seeking Alpha
I accumulated a large position in Ladder in 2020, when shares hit around $4.00 per share.
Seeking Alpha
Covid-19 allowed me to test myself and specifically my analytical skills, as this one real estate investment trust (“REIT”) achieved exceptional returns – a quintessential “cigar butt” pick that generated over 107% annualized returns.
Sharesight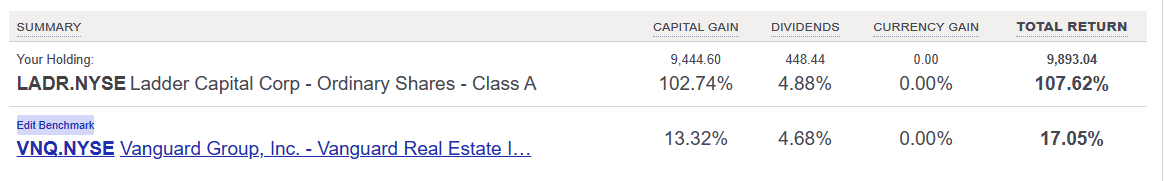
I sold a significant stake in Ladder when shares approached $10.00, however, I still own a modest position. As I pointed out, Ladder is my #1 mREIT pick for 2023. Let’s recap the business model…
The Basic Business Model
Ladder has three main business lines – lending, investment grade rated securities, and real estate equity (mostly net lease) – adding up to over $5.1 billion of assets. This multi‐cylinder approach is inherently safer than a mono-line approach and better able to produce profits through cycles and a wide range of market conditions.
LADR Investor Presentation
Ladder’s Senior Secured Balance Sheet business represents a majority (65%) of revenue – a business similar to Blackstone Mortgage Trust (BXMT) and Starwood Property Trust (STWD). Ladder owns $3.82 billion of balance sheet loans and just $66 million of mezzanine loans.
This illustrates how flexibly and nimbly the investment platform is able to pivot quickly into different product types as changing market conditions produce different investment opportunities.
LADR Investor Presentation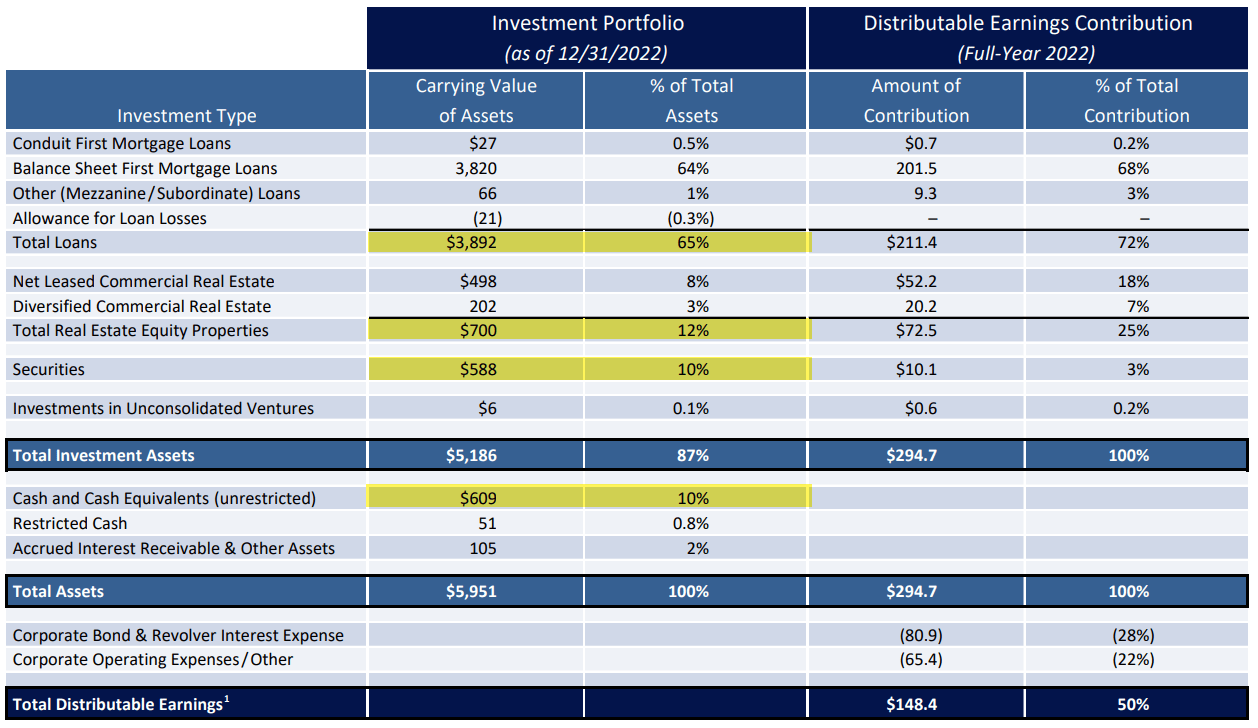
As viewed above, Ladder has $3.9 billion of loans (65% of total assets), $700 million of real estate equity (12% of total assets), and $588 million of securities (10% of total assets). Around 85% of assets are senior secured and/or investment grade-rated and 90% of the balance sheet first mortgage loans are floating-rate.
The weighted average loan-to-value (or LTV) ratio of the commercial real estate loans on the balance sheet (as of Q4-22) was approximately 68% (in line with prior quarters).
The most meaningful fourth-quarter changes to the asset side of the balance sheet were that the weighted-average coupon (end of Q4) jumped from 8.2% from 4.9% (in Q1-22). In addition, the weighted-average portfolio yield jumped to 8.8% (was 5.4% in Q1-22).
LADR Investor Presentation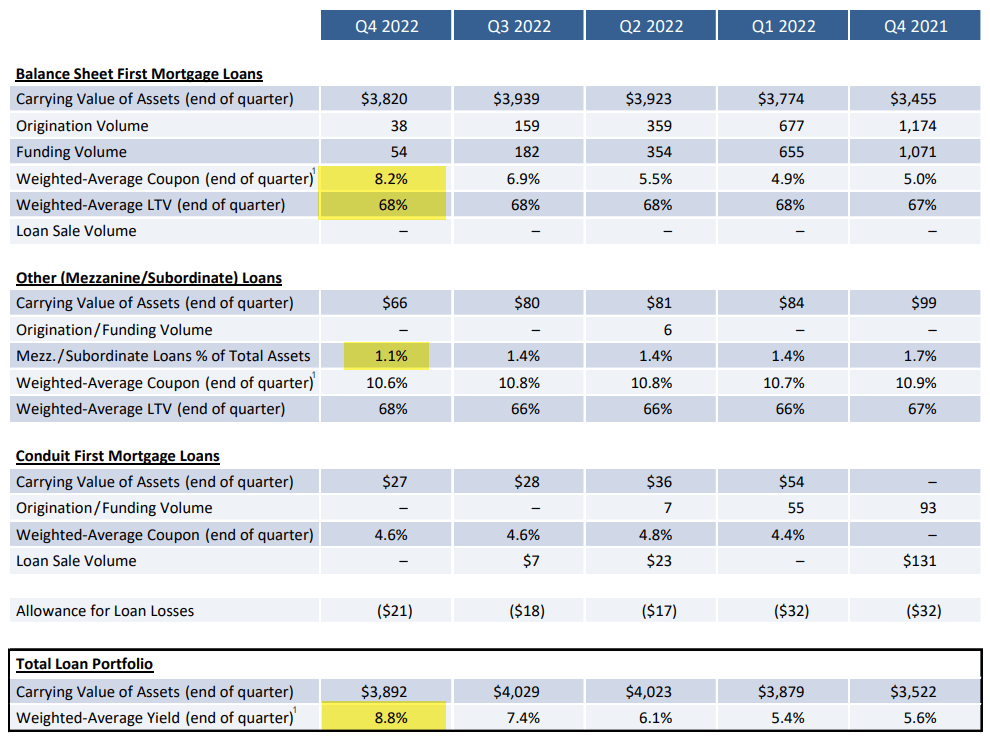
As I’ve pointed out previously, with large floating-rate balance sheet loans and significant fixed-rate liabilities, earnings are positively correlated to rising interest rates. The fact that Ladder has ~90% of balance sheet first mortgage loans comprised of floating-rate loans with interest rate floors is meaningful (100% of floating-rate loan portfolio at or above interest rate floors).
LADR Investor Presentation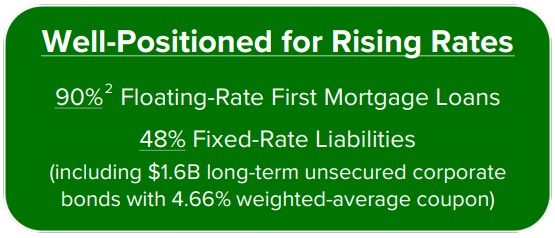
Meanwhile, 48% of Ladder’s debt obligations are fixed-rate, including over $1.6 billion of unsecured corporate bonds. As Ladder’s CEO, Brian Harris, pointed out on the Q4-22 earnings call last week
“…our top line income went through the roof because, again, our interest income was going up, but our interest expense was not really going up very quickly at all.”
One final differentiator for Ladder’s loan business is its average loan size. While Blackstone Mortgage, Starwood Properties, and KKR Real Estate (KREF) have higher individual loans, Ladder focuses on middle market loans with an average loan size of ~$25 million. This provides greater diversification for Ladder and mitigates risk of concentration with one loan.
- BXMT: $26.8 billion portfolio of 203 loans ($132 million per loan)
- STWD: $16.4 billion portfolio of 187 loans (~$87 million per loan)
- KREF: $7.9 billion portfolio (~$127 million per loan)
- LADR: $25 million average loan size (35% below $25 million).
The Securities Segment
While LADR expects its balance sheet lending business to be the primary driver of core earnings, the company also expects securitization activities to supplement quarterly earnings.
LADR Investor Presentation
The key risk metrics of this portfolio remains in line with historical norms, as the carrying value of the securities portfolio was $588 million. The portfolio is 86% AAA-rated, 99.5% investment grade-rated and in 2022, Ladder received $185 million of paydowns on these positions.
Given the seniority and short-dated maturity of this portfolio, Ladder expects the mark-to-market associated with these positions to reverse as the portfolio continues to pay off at par.
LADR Investor Presentation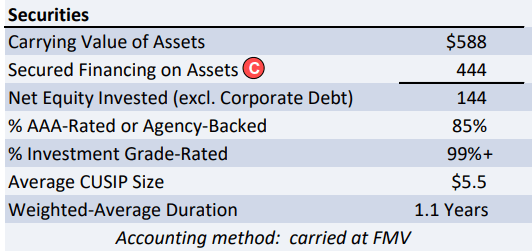
Real Estate Segment
Ladder’s equity platform is often misunderstood, and this is where I believe there is substantial equity to unlock. The company has around 5.2 million square feet, mostly (3.8 million square feet) invested in net lease, and the balance (1.4 million square feet) in binary risky opportunities. Here’s a snapshot of the Net Lease portfolio:
LADR Investor Presentation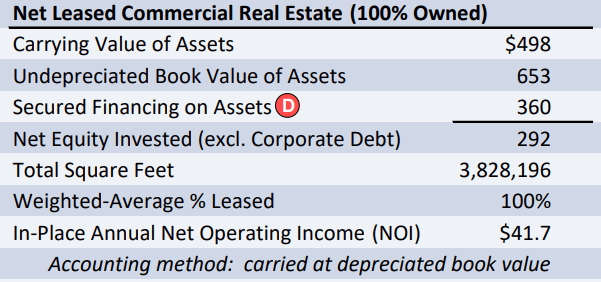
The net lease portfolio continues to provide stable net operating income and includes 156 net lease properties, representing over 70% of the segment. The net lease tenants are strong credits, primarily investment-grade rated and committed to long-term leases with an average remaining lease of 10 years.
The largest net lease investment is a portfolio of five office buildings leased to Bank of America in Jacksonville, Florida. The portfolio has a carrying value of $124 million made in 2017 that also includes a newly-constructed parking garage. BofA has nine years left on their initial lease term, with five-year extensions at below-market rents.
Last year, as reported in the press, Bank of America began to upgrade their office space at their own cost estimated to be approximately $150 million. They are also planning to construct an additional garage with 2,300 parking spaces (at their own cost of $20 million).
LADR Investor Presentation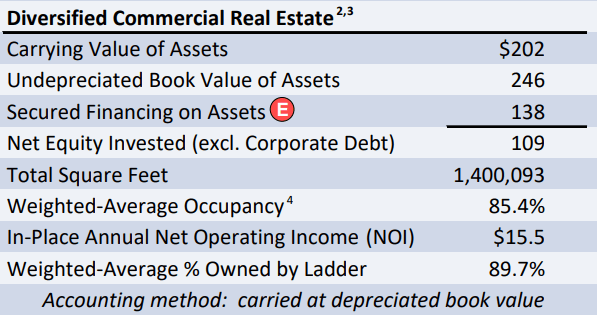
During Q4-22, Ladder sold one office complex, one net lease property, and one residential holding, which together generated a $39 million GAAP gain to shareholders and produced $3.8 million of gains for distributable earnings.
The Balance Sheet
As of Q4-22 Ladder’s equity unsecured bonds and non-recourse non mark-to-market debt made up 82% of the capital structure. 50% (or $3 billion) of assets were unencumbered, with 76% of those assets comprised of cash and senior secured first mortgage loans. In addition, and thanks to the large base of fixed rate unsecured debt, Ladder Q4-22 with a competitive total cost of debt capital equal to 5.34%.
LADR Investor Presentation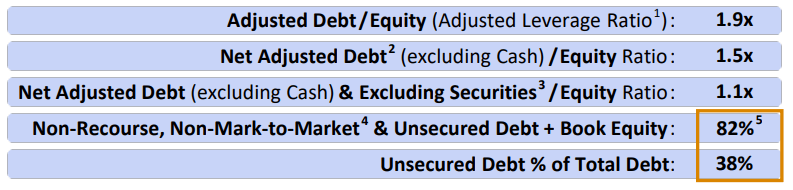
As Ladder’s CEO, Brian Harris, pointed out on the latest earnings call,
“We expected the Fed to aggressively raise short-term rates, and in less than 12 months, they raised the Fed funds rate by 450 basis points. Since we had over $2 billion of fixed rate liabilities, including $1.6 billion of unsecured corporate bonds, the increase in our interest income outpaced increases in our interest expense.”
In Q4-22, Ladder’s net interest income was $37.3 million, 3.5x the net interest income in Q4-21. As Harris explained,
“We believe the Fed will continue raising rates in the first half of this year and we will benefit further from those actions. If they then hold peak funds rate where it is, as they say they will, we should benefit from higher net interest income throughout the rest of this year and into 2024.
Because our weighted average maturity on our fixed-rate corporate bonds is about 4.7 years, we should be able to enjoy strong net interest income for several years as long as the Fed doesn’t completely reverse their recent rate increases.”
Ladder ended 2022 with $609 million in cash and undrawn $324 million revolver capacity and an adjusted debt-to-equity ratio below 2x. This means that Ladder has plenty of earnings power as it makes new investments in the quarters ahead.
LADR Investor Presentation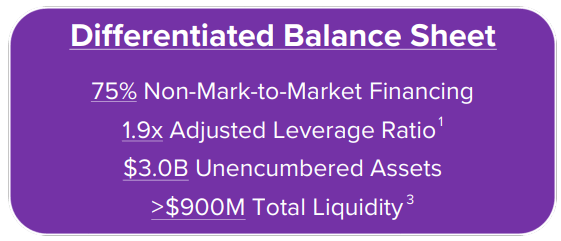
Speaking of Earnings Power
In Q4-22, Distributable Earnings were $38.9 million, Distributable EPS was $0.31, and Distributable ROAE (after-tax) was 10.2%.
LADR Investor Presentation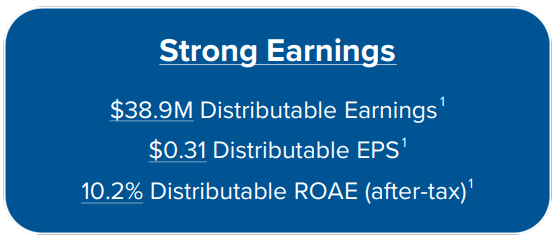
For the full year, distributable earnings were $148.4 million and distributable ROAE (after-tax) was 9.7%. Ladder declared a Q4-23 cash dividend of $0.23 per share, which represents an 8.1% annual dividend yield. The company increased its quarterly dividend by 15% during 2022.
LADR Investor Presentation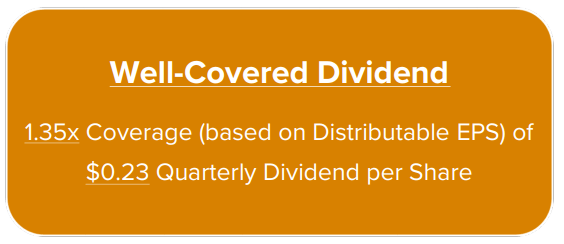
Now let’s take a look at Ladder’s dividend history, excluding special dividends:
iREIT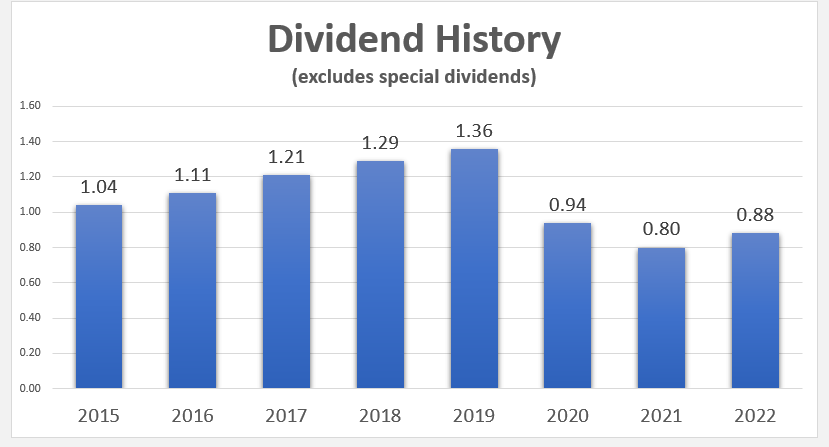
As you can see, Ladder cut its dividend in 2019 from $1.36 to $80 per share and has since begun to increase its dividend (was $.88 in 2022). As you can see below, Ladder has always built a meaningful cushion (payout ratio), which is the reason the company has historically paid out special dividends.
iREIT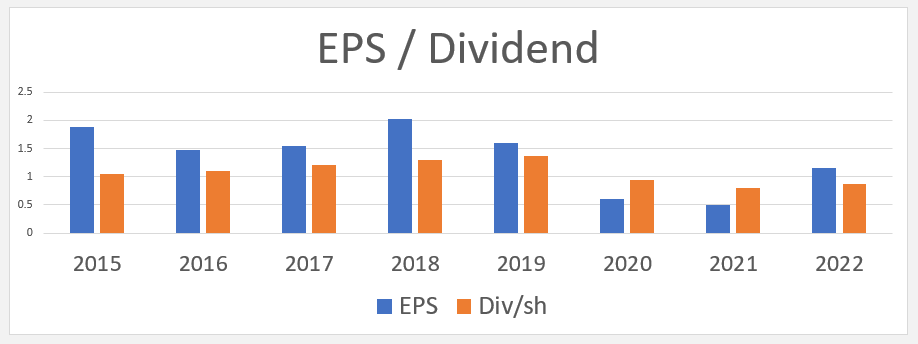
As you can see below, Ladder’s payout ratio in 2022 was 76%, which is in-line with pre-Covid levels:
iREIT
Now take a look at the payout ratio for Ladder and the peer group. Note that Broadmark (BRMK) has cut its dividend so the payout ratio is ~76%, and KKR Real Estate is forecasted by analysts to cut by 20% in 2023.
iREIT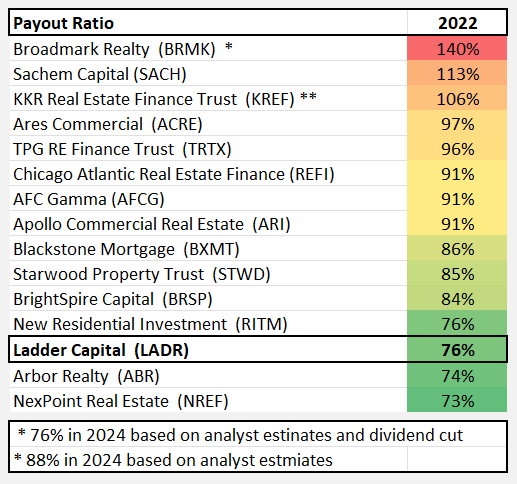
Now consider the analyst consensus estimates (“EPS”) for Ladder and the peer group:
iREIT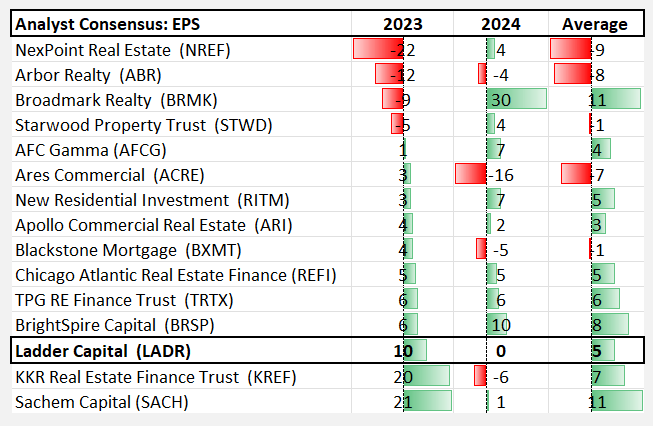
Conclusively, Ladder is well-positioned to deliver strong returns in 2023, as the company has superior access to capital with diversified financing sources and substantial undrawn capacity.
It originated $1.2 billion of balance sheet loans (2/3 either multifamily or manufactured housing), with multifamily originations focused on newly constructed properties. Ladder has the lowest cost of funds in the sector, and as the CEO pointed out:
“…it’s a lot easier as a lender when rates are higher than when rates are lower. So we are very comfortable here”
One other factor worth mentioning is that Ladder has solid insider ownership:
iREIT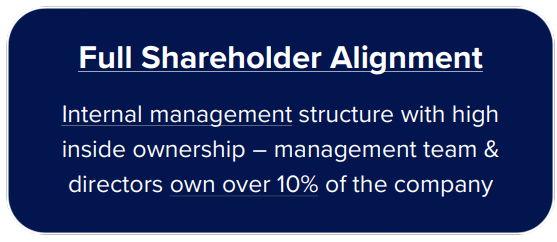
Valuation
Now let’s take a look at Ladder’s performance YTD:
iREIT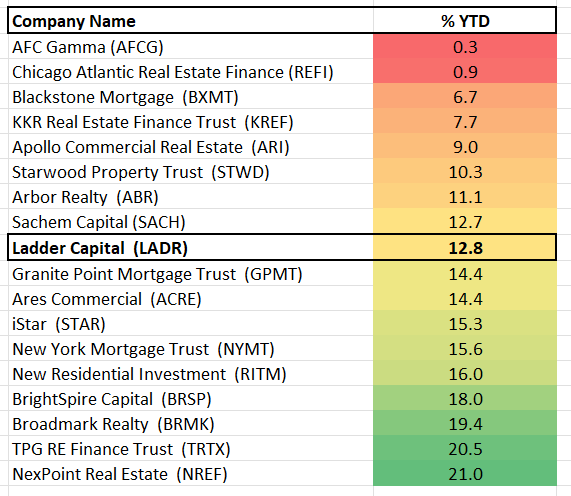
Now these valuation metrics:
iREIT
Ladder yields 8.4% with a P/E of 9.2x, and if the company paid out all of its earnings, it would yield 10.2%. We see nothing but upside with Ladder Capital Corp, and we maintain a BUY with a forecasted annualized total return of 20%.
We believe Ladder Capital Corp is the best-positioned in the commercial mREIT sector, and in this article we have demonstrated what separates the best from the rest.
FAST Graphs
Be the first to comment