

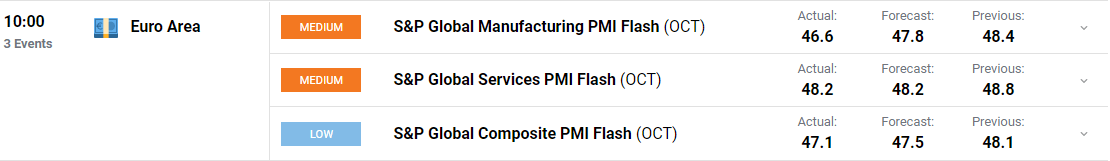
Eurozone PMI Key Points:
- Eurozone S&P Global Manufacturing PMI Flash (OCT) 46.6 vs September 48.4. 29-month low.
- Eurozone S&P Global Services PMI Flash (OCT) 48.2 vs September 48.8. 20-month low.
- Business Activity Down for Four Consecutive Months.
Recommended by Zain Vawda
Get Your Free EUR Forecast
The seasonally adjusted S&P Global Eurozone PMI Composite Output Index dropped from 48.1 in September to 47.1 in October, according to the ‘flash’ reading. The index signalled a fourth successive reduction in business activity across the eurozone. Excluding pandemic numbers, the latest reading was the lowest since April 2013.
Customize and filter live economic data via our DailyFX economic calendar
The manufacturing sector led the downturn as factory outputs and service sector outputs declined for a fifth and third consecutive month respectively. Europe’s most industrialized economy recorded the steepest decline as composite PMI sank to 44.1, its weakest since 2009 (excluding the pandemic). Business expectations for the year ahead remained subdued adding further pressure to the zone. Expectations are running at the second lowest since the early pandemic lockdowns. Confidence was especially low in manufacturing, and particularly in Germany, reflecting concerns over energy as well as the rising cost of living and global growth slowdowns.
Trade Smarter – Sign up for the DailyFX Newsletter
Receive timely and compelling market commentary from the DailyFX team
Subscribe to Newsletter
The Euro remains below parity against the dollar, which begs the question “How hawkish will the European Central Bank (ECB) be this week?” The market is already pricing in a 75bp hike for Thursday’s meeting, which is unlikely to offer the Euro much support. The pessimistic view around the Eurozone is unlikely to shift with today’s data adding further credence to recessionary fears. As inflation remains elevated it is very difficult to make a case for a slowdown in rate hikes with ECB Chief Economist Phillip Lane indicating that the central bank sees the neutral rate slightly above the 1-2% range. If Lane is correct this would mean further rate hikes are in store for the zone which could in theory hasten a recession.
Market reaction
EUR/USD 1H Chart
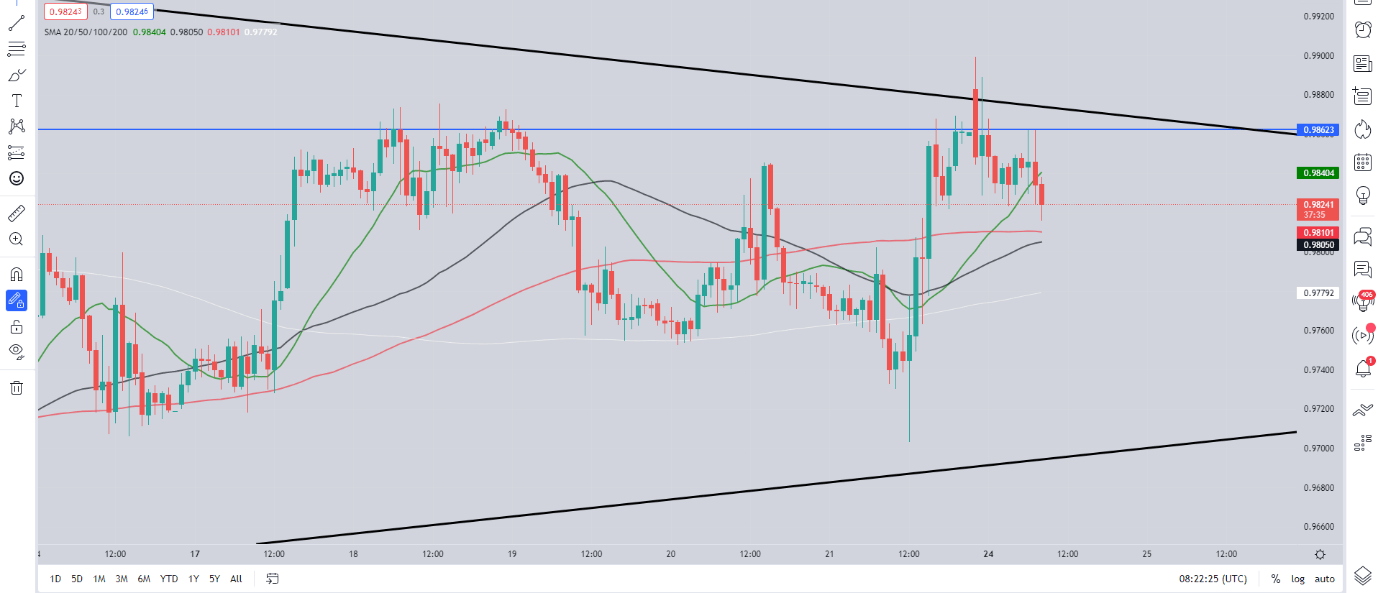
Source: TradingView, prepared by Zain Vawda
The Initial reaction to the data saw EURUSD decline 20 pips before steadying with further downside a possibility as the day progresses.
On the daily timeframe we remain within the symmetrical triangle pattern with the pair finding resistance after tapping the 50-SMA. There remains a strong possibility price may remain within the 150-pip range of the triangle pattern as we head toward the ECB meeting on Thursday.
Key Intraday Levels Worth Watching:
Support Areas
Resistance Areas
| Change in | Longs | Shorts | OI |
| Daily | 8% | 19% | 13% |
| Weekly | -5% | 13% | 3% |
— Written by Zain Vawda for DailyFX.com
Contact and follow Zain on Twitter: @zvawda
Be the first to comment