

AsiaVision
China stocks have outperformed the S&P 500 over the past month as volatility reasserts itself among large-cap domestic equities. The iShares China Large-Cap ETF (FXI) is down ‘just’ 5.5% since mid-August while the S&P 500 Trust ETF (SPY) is down an even 10%. It used to be a 10% drop was a cause of major concern, but such a move has become commonplace in 2022.
China Stocks Beating U.S. Equities MoM
StockCharts.com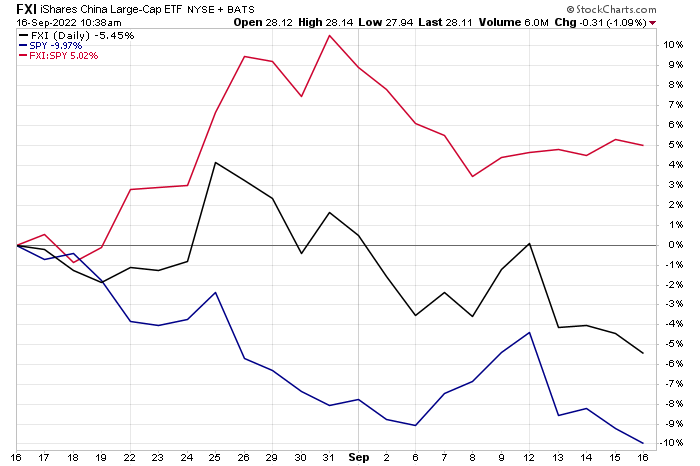
Digging into global returns over a six-month period, there have been a few green shoots in the land of the red. In fact, Chinese equity markets generally bottomed in mid-March while U.S. shares reached a trough three months later. A summer rebound was focused among domestic stocks across the market cap spectrum while foreign ETFs muddled around.
Six-Month Global Stock Performance Heat Map
Finviz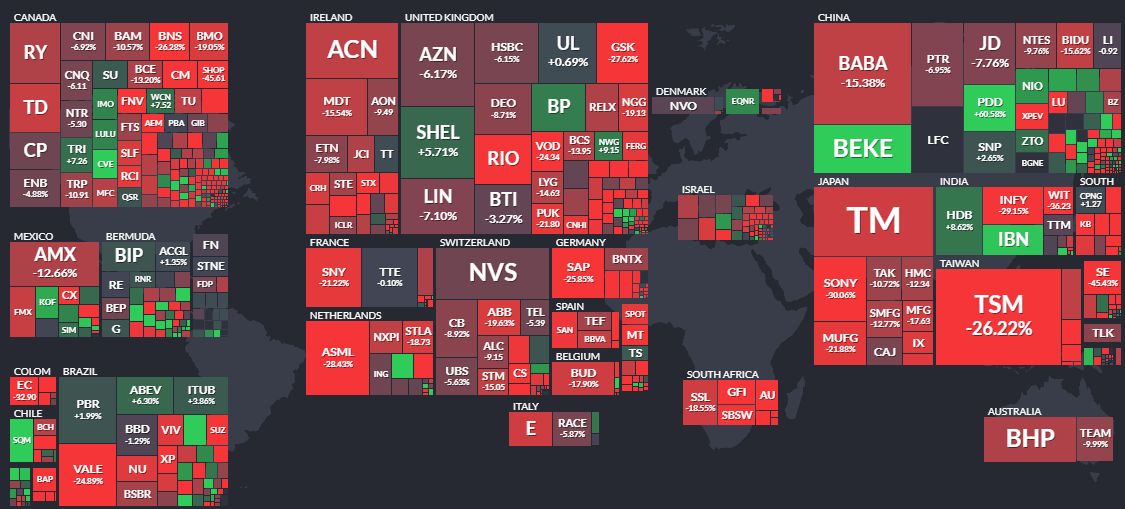
Let’s zoom into the KraneShares CSI China Internet ETF (NYSEARCA:KWEB). This is the heart of volatility in China stocks. Going back more than a year now, fears and realities that the country’s regulators would come after major tech and software names have pressured so many firms in China. KWEB dropped a whopping 80% from its early 2021 peak above $100 to barely above $20 at the March 2022 nadir.
Shares rebounded to the mid-$30s, a stunning 70% climb, into June. After failing to make a new rebound zenith in August, KWEB has cratered back down to $27.
The ETF has an expense ratio of 0.69% and pays a scant dividend yield, according to Morningstar. The fund holds 42 stocks and is quite concentrated, with the top four positions accounting for about one-third of the portfolio. What happens with Alibaba (BABA), Tencent (OTCPK:TCEHY), Meituan (OTCPK:MPNGF), and JD.com (JD) play a pivotal role in KWEB’s price action.
KWEB Portfolio X-Ray: High Growth, P/E Retreating
Morningstar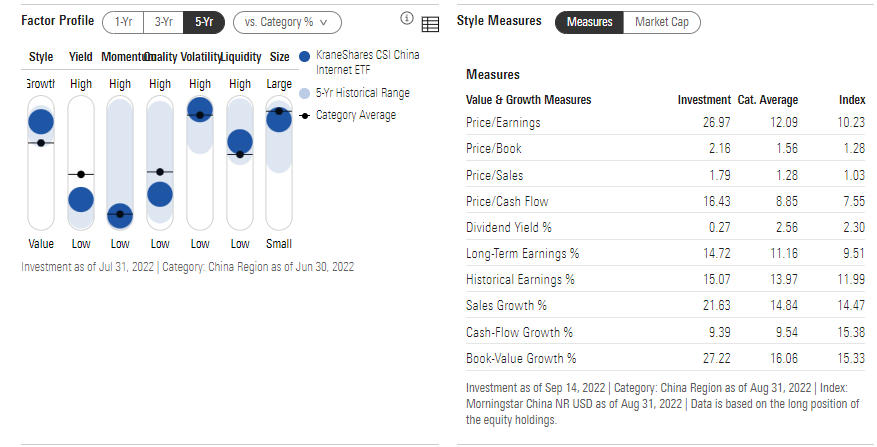
The portfolio is clearly in the large-cap growth part of the style box and features low quality and weak momentum with high volatility. Not an ideal combination right now. Its valuation is not much better, with a price-to-earnings ratio near 27, per Morningstar. Earnings growth, though, is seen as being near its historical average of about 15% looking ahead. So, the resulting PEG ratio, 1.8, is quite reasonable. Of course, there is exceptionally low confidence in what Chinese tech companies’ profits per share will be.
The Technical Take
I’d like to see KWEB climb above $34 before I can be truly encouraged by price action. Notice in the chart below that the ETF broke above a downtrend resistance line of the early 2021 all-time high. But there are two key resistance areas – near $34 and in the $38 to $40 range. Right now, KWEB appears to be on the verge of breaking important support at $27. The next few days will be critical. If this level is breached, then a move down to $24 could be in the cards.
KWEB Consolidating After the March Low, at Crucial Support
StockCharts.com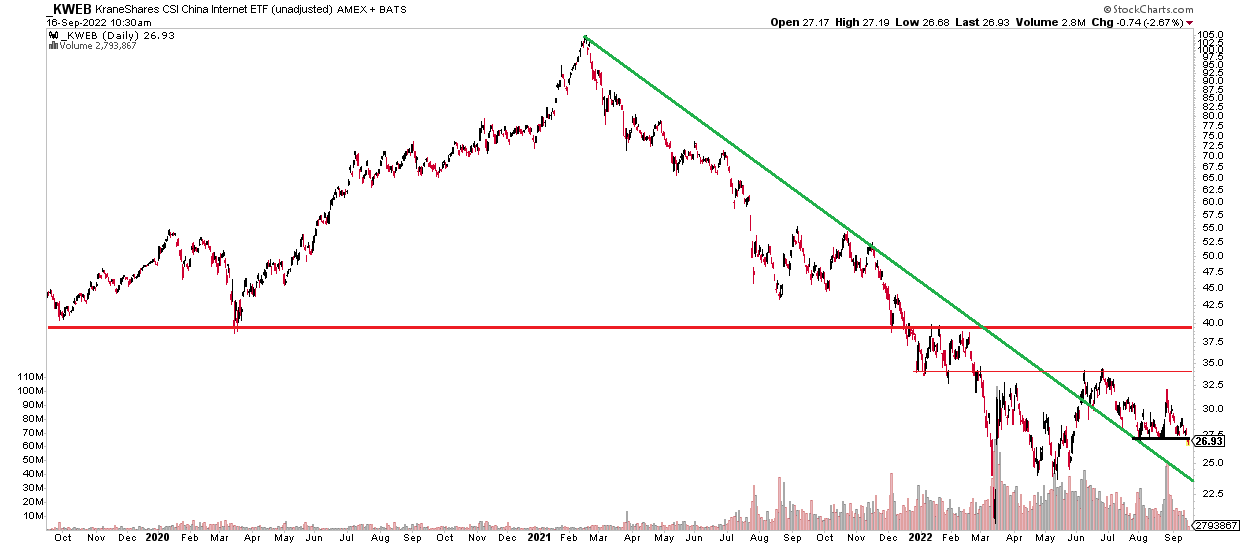
Bonus Chart: Relative Price Action
I thought it would be interesting to compare KWEB to the U.S. iShares Technology & Software ETF (IGV). The former appears to be putting in a basing pattern vs the latter, but we need to see the KWEB:IGV ratio chart break above the red line annotated below before we call a bottom. Once again, more work for the KWEB bulls to put in here.
KWEB vs U.S. Tech/Software ETF: Bottoming Pattern?
StockCharts.com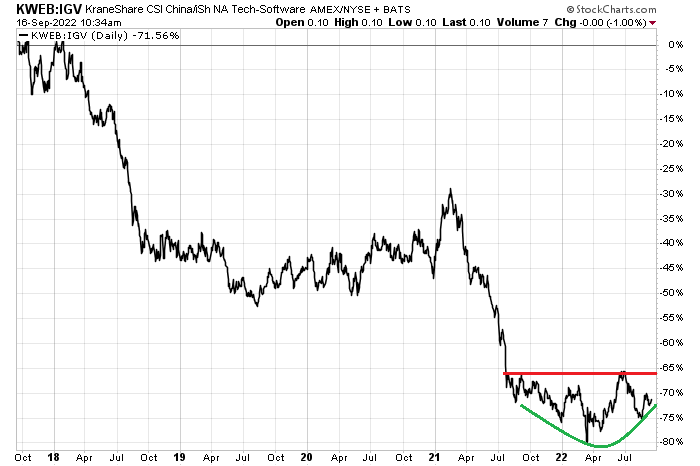
The Bottom Line
I like the valuation on KWEB right now. And I recognize the heightened volatility and uncertainty with respect to the earnings picture looking forward. A PEG under two seems reasonable. The technical picture is turning a bit more positive, but there’s still work to do by the bulls here. Overall, the valuation looks good, but the technicals are still too uncertain.
Be the first to comment