

NoDerog
In most normal circumstances, you might not think it possible to get shares of an iconic clothing and apparel company at a discount. But given how inefficient the market can be from time to time, such an opportunity does pop up every once in a while. A great example of this can be seen by looking at Kontoor Brands (NYSE:KTB), the producer of top fashion brands Wrangler and Lee. Although the company has experienced some weakness on its top and bottom lines recently, the enterprise as a whole appears robust and shares are trading at fundamentally attractive levels. I don’t doubt that some further weakening of the enterprise could occur. But for those focused on the long haul, shares do look cheap enough to warrant serious consideration, leading me to keep my ‘buy’ rating on the firm for now.
A nice fit
Back in August of this year, I wrote an article wherein I described myself as being bullish about Kontoor Brands. Even though management had reduced guidance for the 2022 fiscal year leading up to the publication of that article, I found myself impressed by the company’s overall financial trajectory. my overall conclusion was that shares looked appealing at that moment, especially once we consider that any pain the company was experiencing would be temporary in nature. At the end of the day, I ended up rating the company a ‘buy’ to reflect my belief that it should outperform the broader market for the foreseeable future. From a purely share price perspective, that call has proven to be really solid. While the S&P 500 is down by 0.2%, shares of Kontoor Brands have accomplished upside for investors of 8.2%.
Author – SEC EDGAR Data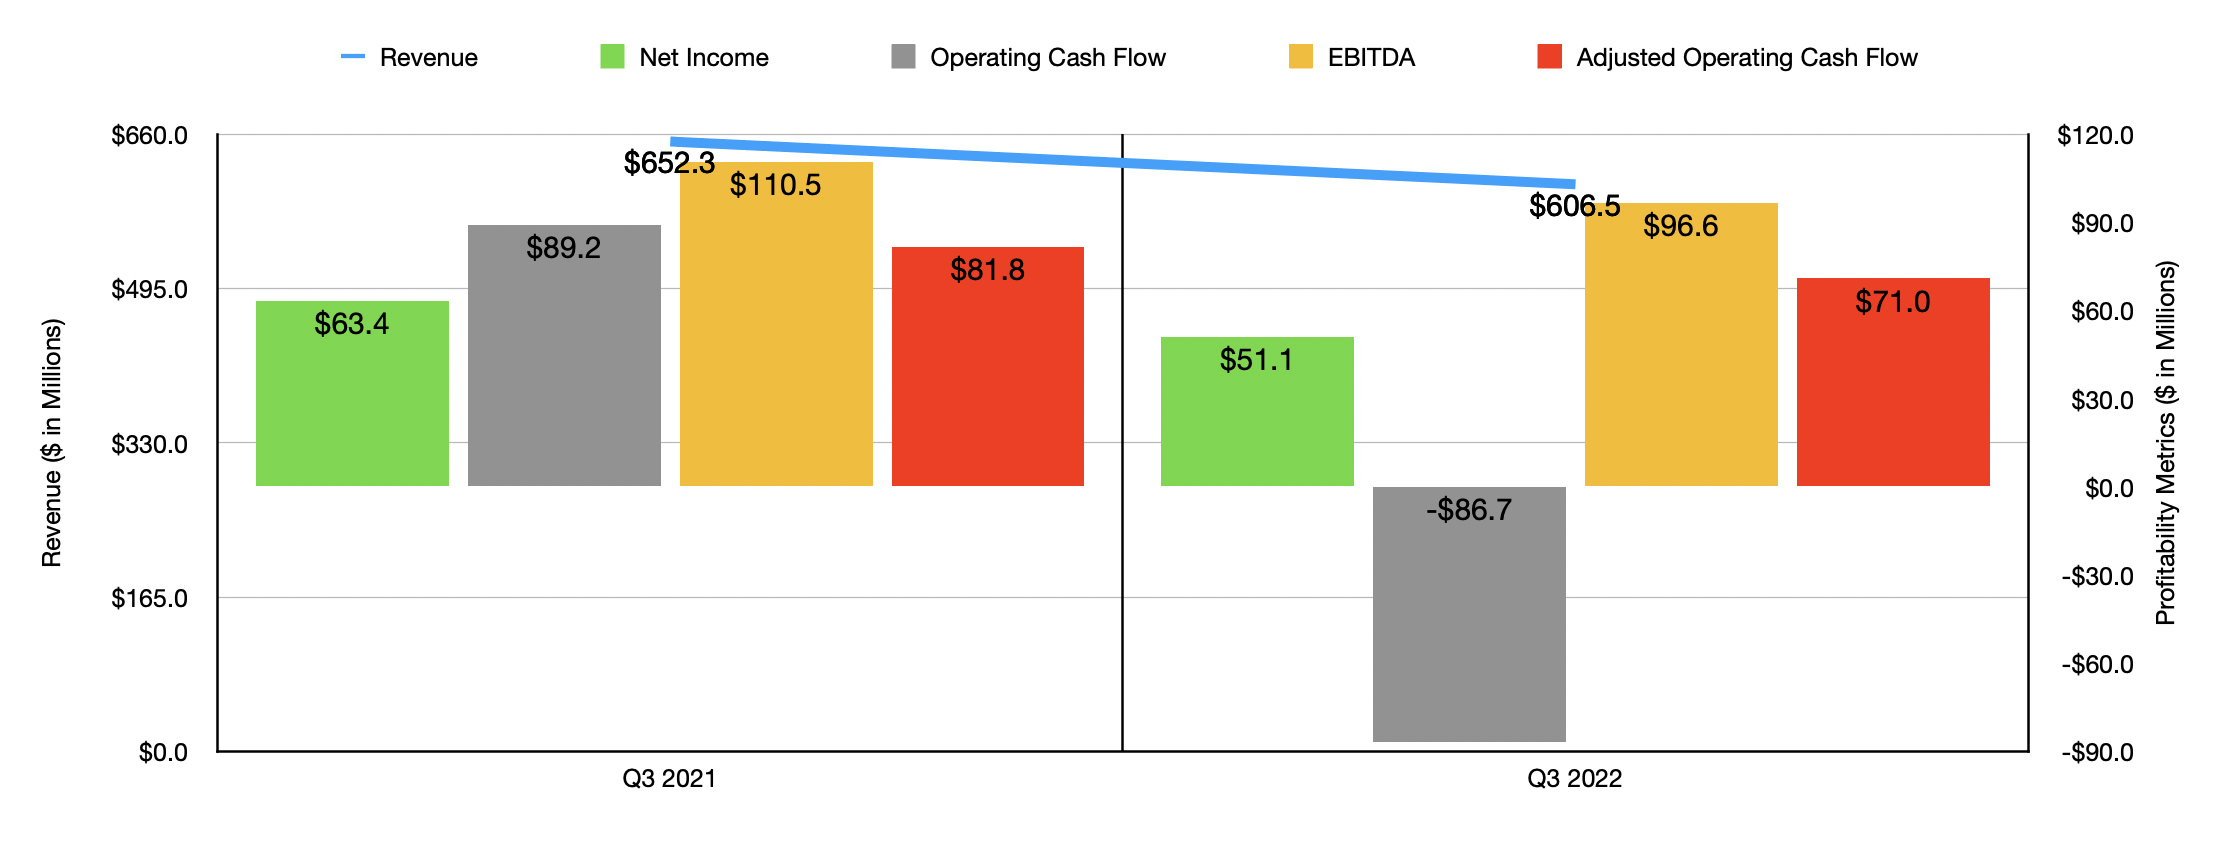
In a difficult market like what we are experiencing today, it might be hard to imagine that a company could outperform the broader market while posting weaker financial results year over year. But that is what just happened in the third quarter of the company’s 2022 fiscal year, the only quarter for which we have new data that we did not have data for when I last wrote about it. During that quarter, revenue for the business came in at $606.5 million. That’s 7% lower than the $652.3 million reported the same time last year. This decrease for the company came only in part as a result of foreign currency fluctuations. Revenue resulting from this category was impacted only to the tune of 2%.
The weakest portion of the firm was the U.S. Wholesale operations that management overseas. Sales here dropped by 9%, largely due to lower shipments, including those associated with its digital wholesale business, thanks to retailer actions aimed at reducing inventory levels. Non-U.S. Wholesale revenue also declined, falling by 2% year over year. However, this picture is not as bad as it appears. Foreign currency fluctuations negatively impacted this segment by 10%. The company also suffered from an undisclosed amount of pain associated with its Asia Pacific operations because of COVID-19 restrictions in China. And finally, the Direct-to-Consumer portion of the enterprise saw revenue drop by 1%, hit meaningfully by a 4% decline from foreign currency fluctuations and a decline in retail store sales.
With the decline in revenue also came a decline in profitability. Net income fell from $63.4 million in the third quarter of 2021 to $51.1 million the same time this year. In addition to being hit by the decrease in sales, the company was also negatively affected to the tune of $5.5 million because of a decline in its gross margin from 44.4% to 43.5%. Management attributed this pain to increased product and ocean freight costs resulting from inflation. Higher provisions for inventory losses were also somewhat problematic during the quarter. Naturally, other profitability metrics followed suit. Operating cash flow went from $89.2 million to negative $86.7 million. If we adjust for changes in working capital, the picture would have been far better, dropping more modestly from $81.8 million to $71 million. And over that same window of time, we also saw EBITDA worsen, dipping from $110.5 million to $96.6 million.
Author – SEC EDGAR Data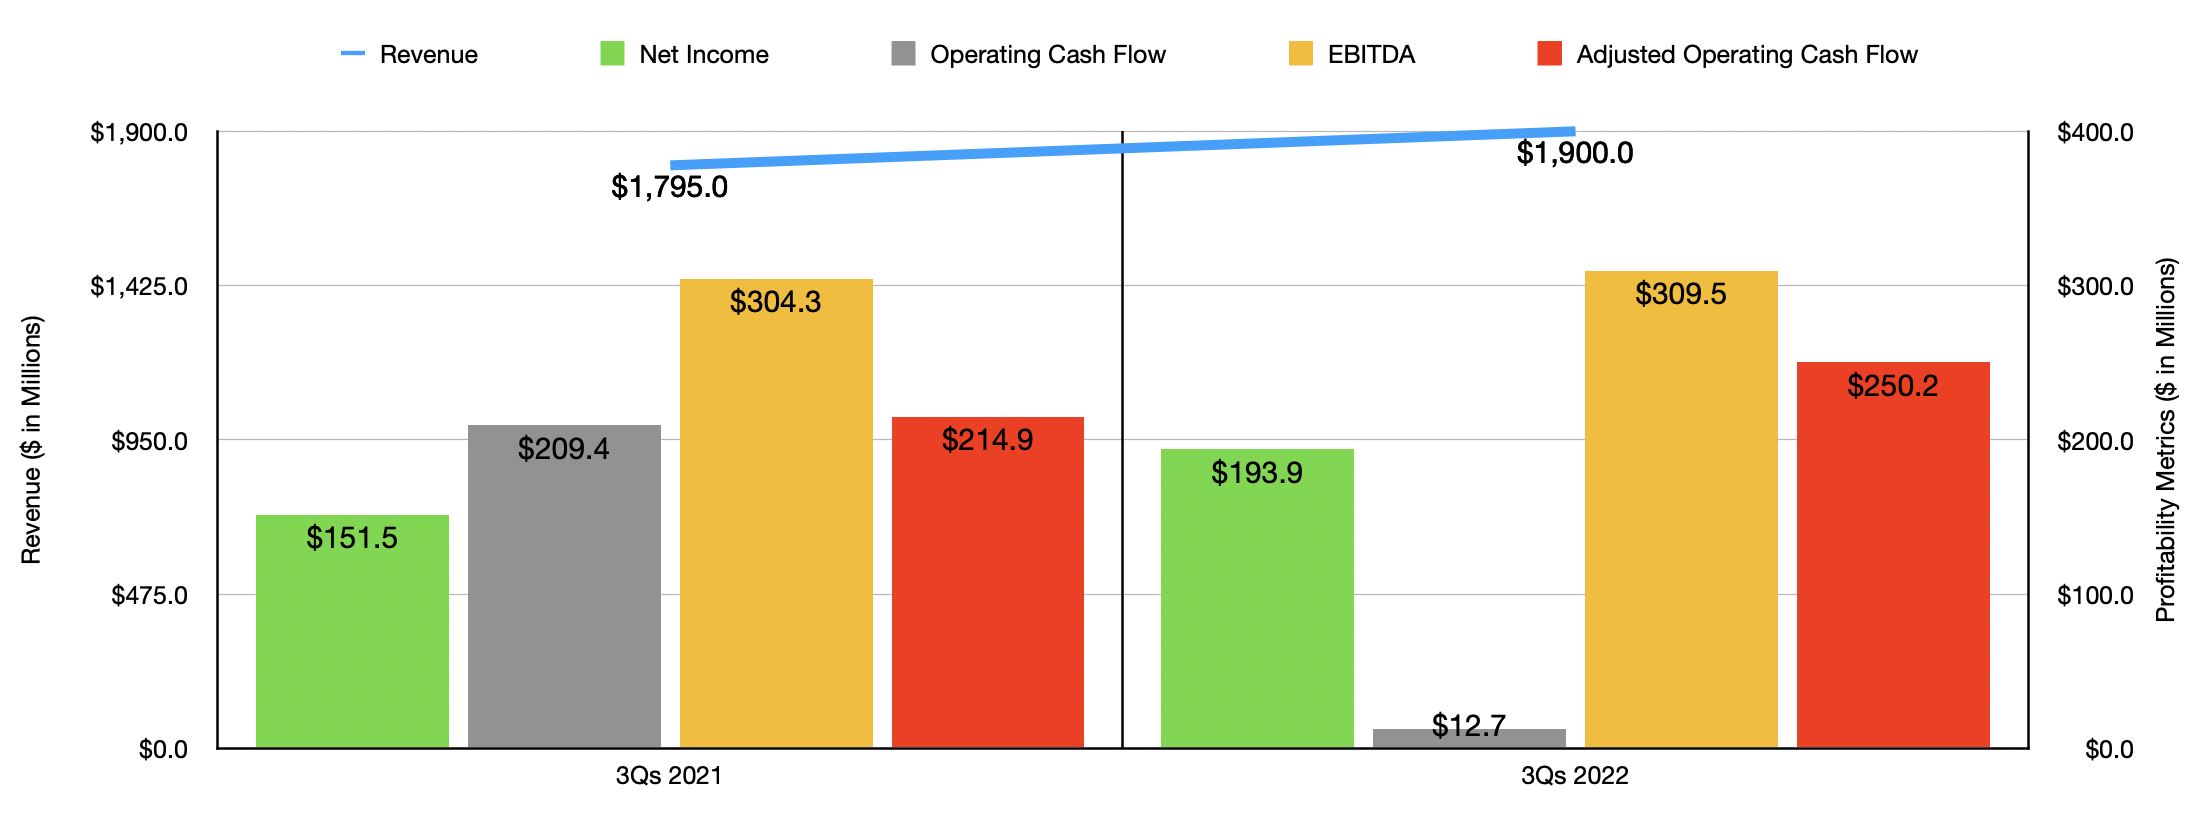
Despite the pain the company experienced in the third quarter, results for the first three quarters of the year as a whole do still look better than they did last year. Revenue of $1.90 billion beats out the $1.80 billion reported the same time last year. Even on the bottom line, results are higher year over year, with net income of $193.9 million exceeding the $151.5 million reported in the first nine months of the company’s 2021 fiscal year. Operating cash flow is still down, having plunged from $209.4 million to $12.7 million. But if we adjust for changes in working capital, it would have risen from $214.9 million to $250.2 million. And over that same window of time, we also saw EBITDA improve modestly, inching up from $304.3 million to $309.5 million.
In response to the weak third quarter, management has revised expectations for the 2022 fiscal year in its entirety. They now think that revenue should rise by around 4% year over year. That compares to a 6% increase previously anticipated. It is worth noting that half of this revision should be due to foreign currency fluctuations. Meanwhile, earnings per share should be between $4.35 and $4.40. That’s down from the $4.40 to $4.50 range previously anticipated. At the midpoint, this would translate to net income of $249.4 million. If we annualize the company’s other profitability metrics, we should anticipate adjusted operating cash flow of $288.4 million and EBITDA of $450.3 million.
Author – SEC EDGAR Data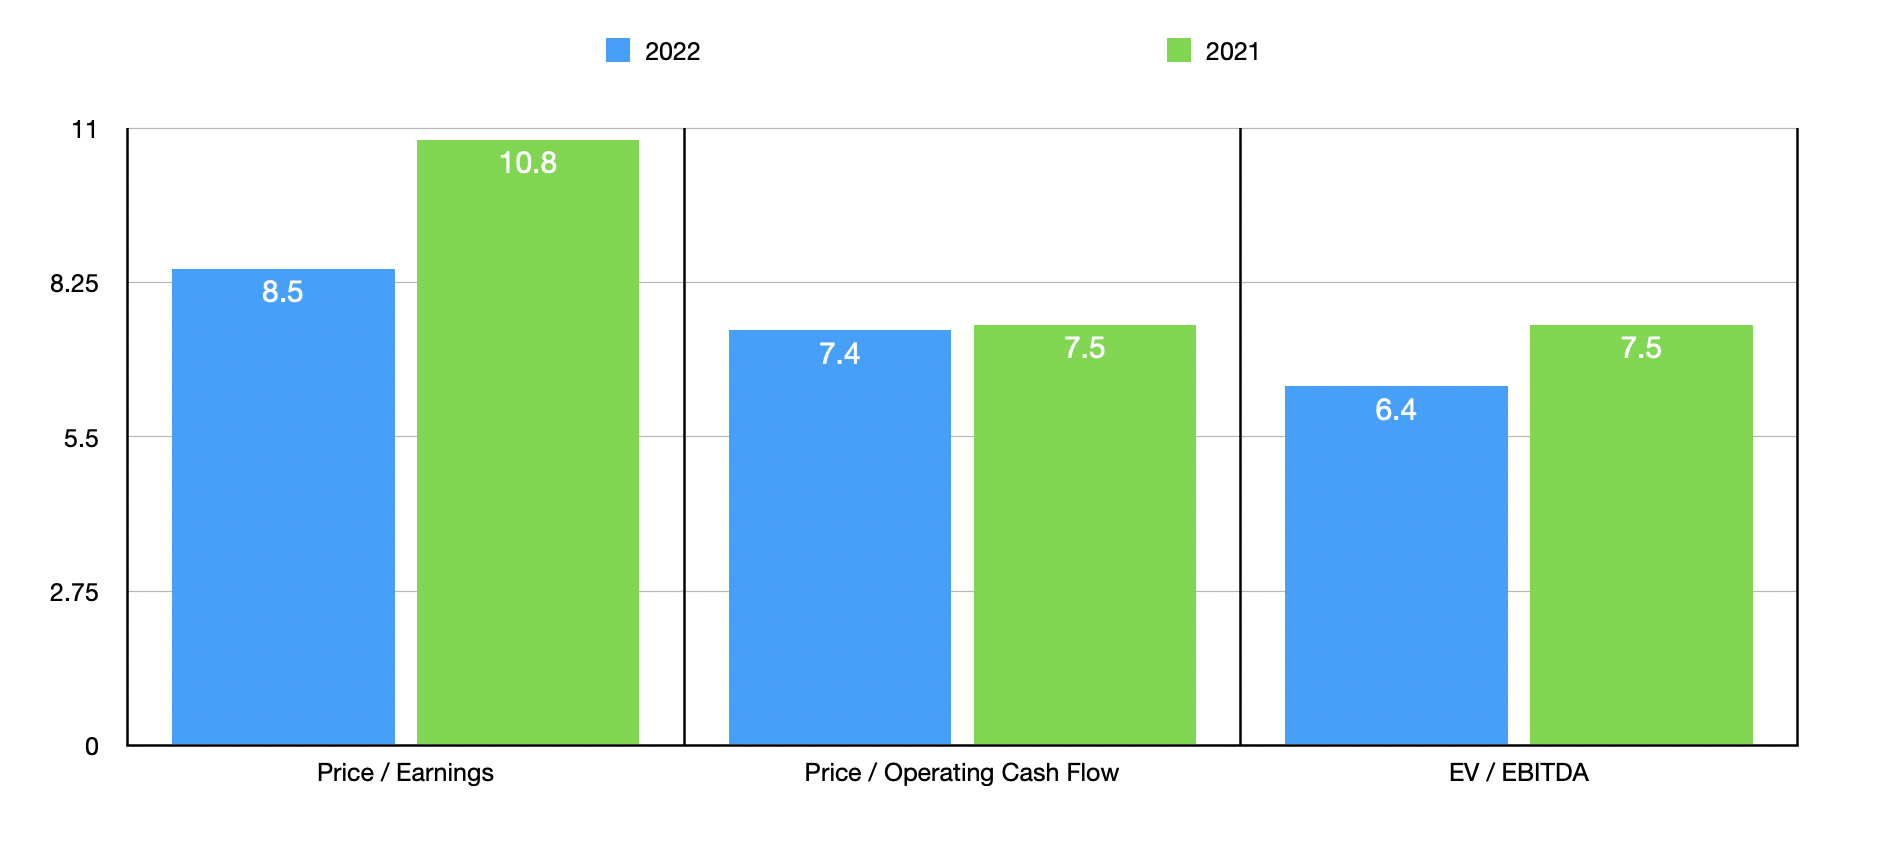
Based on these figures, the company is trading at a forward price-to-earnings multiple of 8.5. The forward price to adjusted operating cash flow multiple is 7.4. And the EV to EBITDA multiple should come in at 6.4. If, instead, we were to rely on the data from 2021, these multiples would be 10.8, 7.5, and 7.5, respectively. As part of my analysis, I also compared the company to five similar businesses. On a price-to-earnings basis, these firms should range from a low of 4.6 to a high of 31. And using the price to operating cash flow approach, the range is between 7.3 and 67.1. In both cases, only one of the five companies was cheaper than Kontoor Brands. Meanwhile, using the EV to EBITDA approach, the range is between 3.8 and 12.7. In this scenario, only two of the five companies is cheaper than our target.
| Company | Price / Earnings | Price / Operating Cash Flow | EV / EBITDA |
| Kontoor Brands | 8.5 | 7.4 | 6.4 |
| Canada Goose Holdings (GOOS) | 31.0 | 22.9 | 12.7 |
| Capri Holdings Limited (CPRI) | 9.5 | 22.5 | 6.9 |
| Oxford Industries (OXM) | 10.6 | 12.7 | 5.9 |
| Carter’s (CRI) | 11.1 | 67.1 | 7.4 |
| G-III Apparel Group (GIII) | 4.6 | 7.3 | 3.8 |
Takeaway
The data we have available to us today tells me that while Kontoor Brands has shown some signs of weakness, the company is, on the whole, really robust. It is possible that financial performance could weaken in the near term. But for those focused on the long haul, shares look attractively priced, both on an absolute basis and relative to similar firms. Add on top of this the fact that it owns two leading brands in a market that should continue to fare well for the long haul, and I believe that the ‘buy’ rating that I have on it remains appropriate.
Be the first to comment