


1001Love/iStock via Getty Images
Investment thesis
Kohl’s Corporation (NYSE:KSS) has been massively sold off and is seemingly forming a base, a situation that reminds the circumstances seen during the pandemic. Despite some fundamental headwinds and major macroeconomic risks, in this article, I want to focus on the technical aspects that could hint at an actionable trading setup. The stock is hovering at historically low levels, only seen during major declines such as the financial crisis in 2008, and the more recent COVID-pandemic. KSS has shown in the past the ability to build up significant relative strength and be resilient after major pullbacks. By considering appropriate stop-loss levels and actively managing their risk exposure, investors could size their entry positions and take advantage of the actual technical setup.
A quick look at the big picture
The consumer cyclical sector in the US has been among the worst performers in the past year, reporting an even higher loss than the heavily affected technology sector, and is still struggling to reverse, as shown in the past 3 months. Despite this, some industries in the sectors are performing quite well in the last few months, with department stores and apparel retailers leading far ahead in the group, while apparel manufacturers and companies in the leisure and gambling industries are among the longer-term laggards.
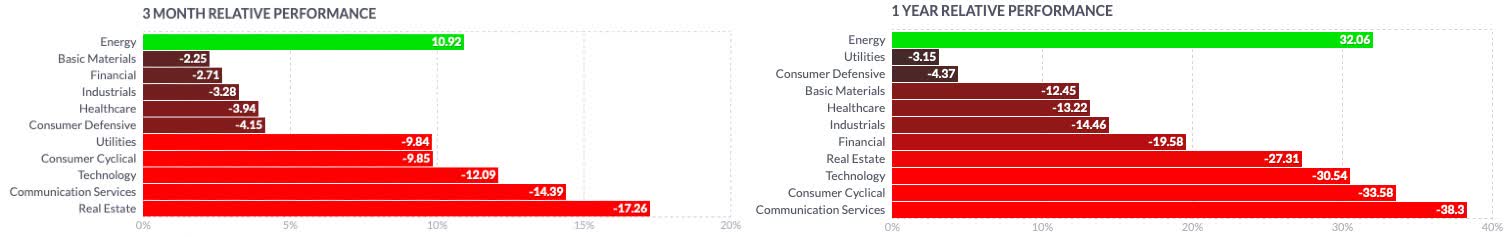
finviz
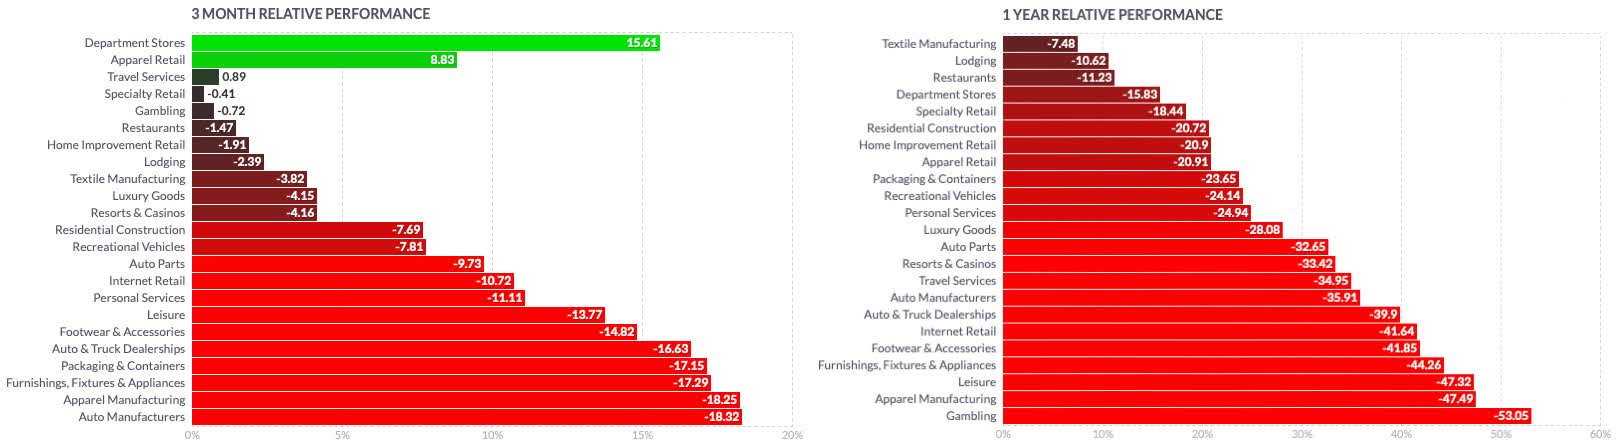
finviz
Considering more specific groups of the industry, the S&P 500 Consumer Discretionary Index (S5COND) which marked its All-Time-High (ATH) on November 22, 2022, has entered a long-term downtrend by the beginning of January 2022 and is experiencing its steepest correction on record, losing about 39% until bottoming on June 16, 2022, where it reverted and broke out over its EMA50 on a weekly timeframe while it has since retraced its gains, and is now hovering under its EMA200, reporting consistent relative weakness, when compared to its main reference index.
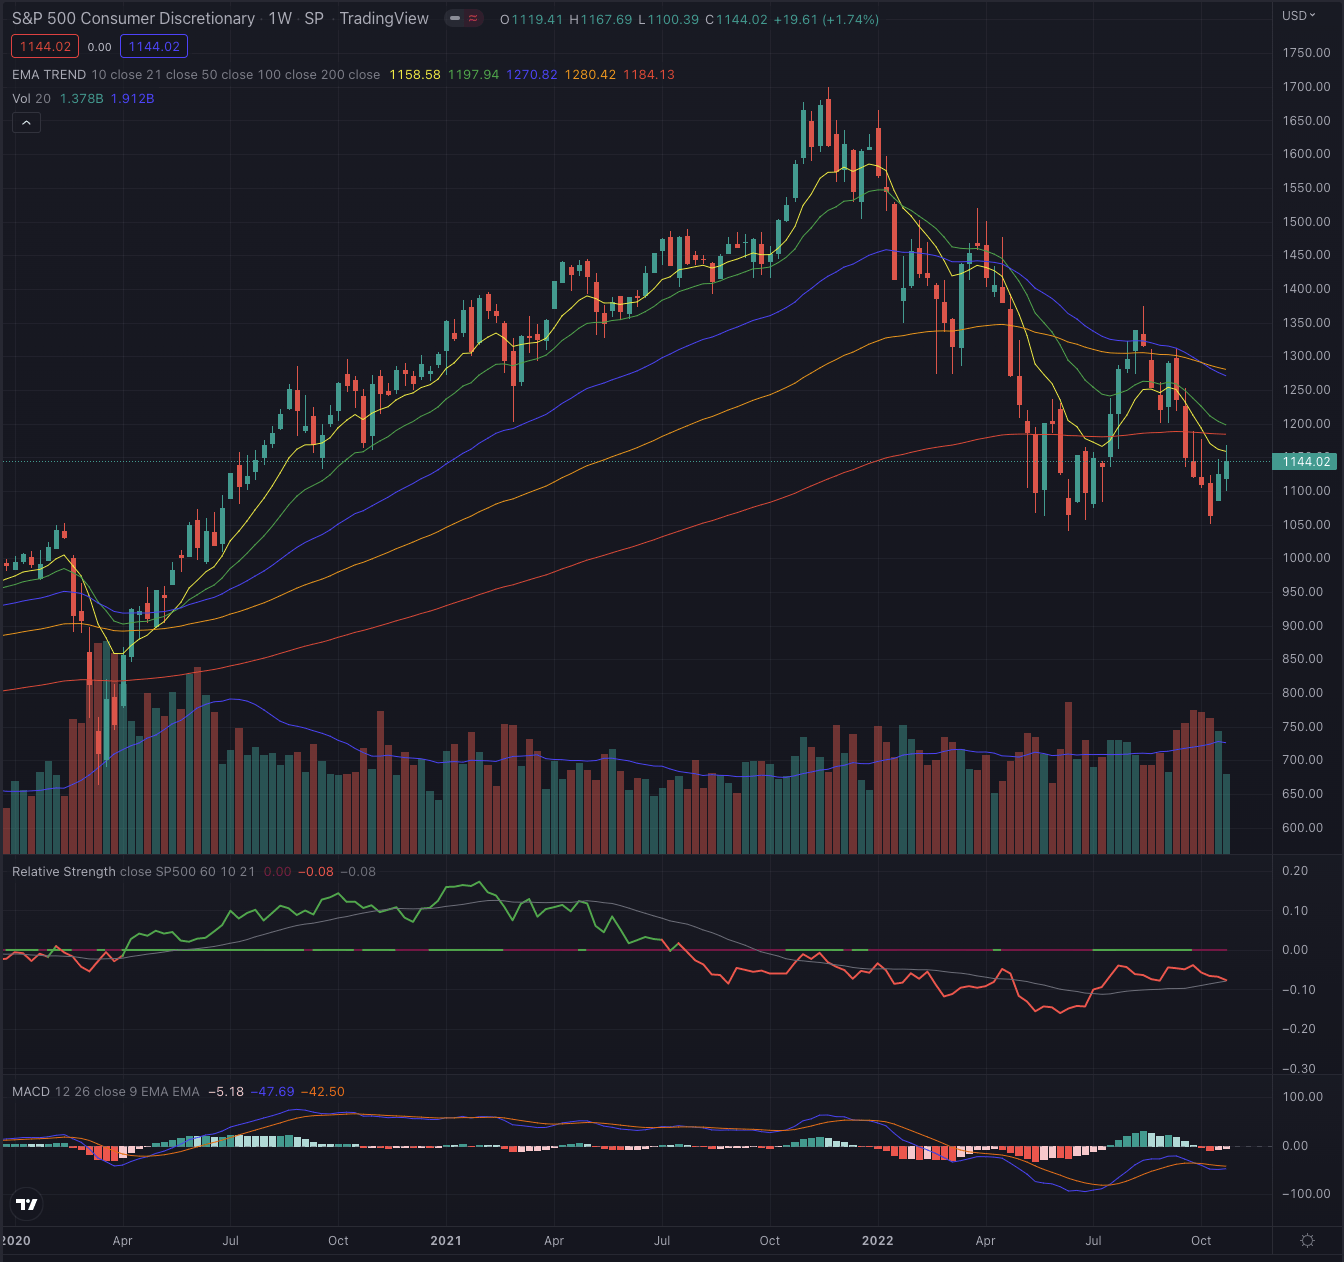
Author, using TradingView
By analyzing the historical stock performance, we notice that KSS had a mixed performance when compared to most of its main references since the crash during the pandemic, resulting in a loss of 29.10% over the past 5 years. Despite the overall poor performance, the stock could report some significant relative strength during 2018-2019 and has been quite resilient when compared to peers such as Nordstrom (NYSE:JWN) and Macy’s (NYSE:M) when coming out of the pandemic lows. All mentioned peers underperformed the S&P 500 (SP500), the broader iShares Russell 2000 ETF (IWM), and the more specific industry reference SPDR S&P Retail ETF (XRT), the latter reporting the best overall performance during the analyzed time.
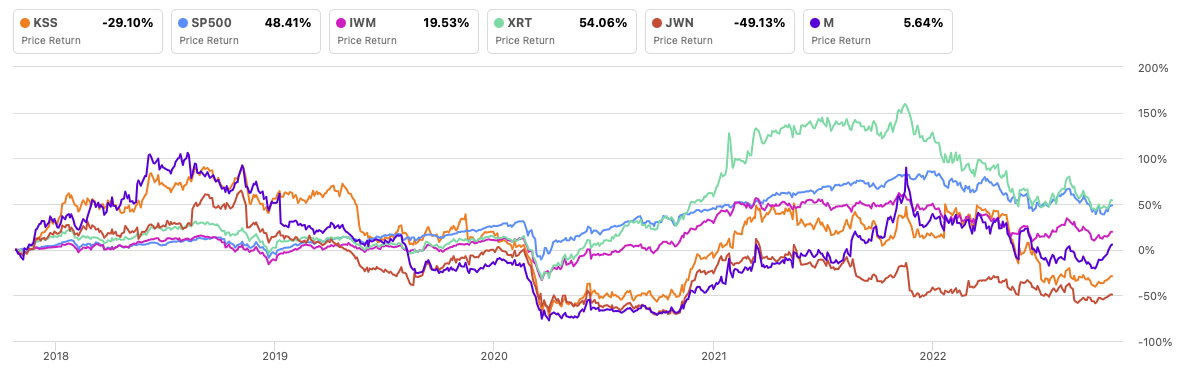
Author, using SeekingAlpha.com
Where are we now?
Kohl’s reached its ATH on November 12, 2018, and has since performed rather poorly, bottoming on April 3, 2020, where the stock began to form a stage 1 lasting more than 7 months. Although the stock had shown significant strength during the following months, once it reached its ATH, it was unable to overcome that price level, getting rejected at each attempt, and finally broke down into the ongoing long-term downtrend. As shown in the following weekly chart, the stock is seemingly trying to form a base, with falling volume and stabilizing relative strength, as its MACD indicator could hint to a possible positive momentum buildup. While it is still early to call for it, as seen in the former bottoming process during the pandemic, it looks like the stock’s stage 1 is progressing and its downtrend stabilizing, while the stock looks still significantly extended.
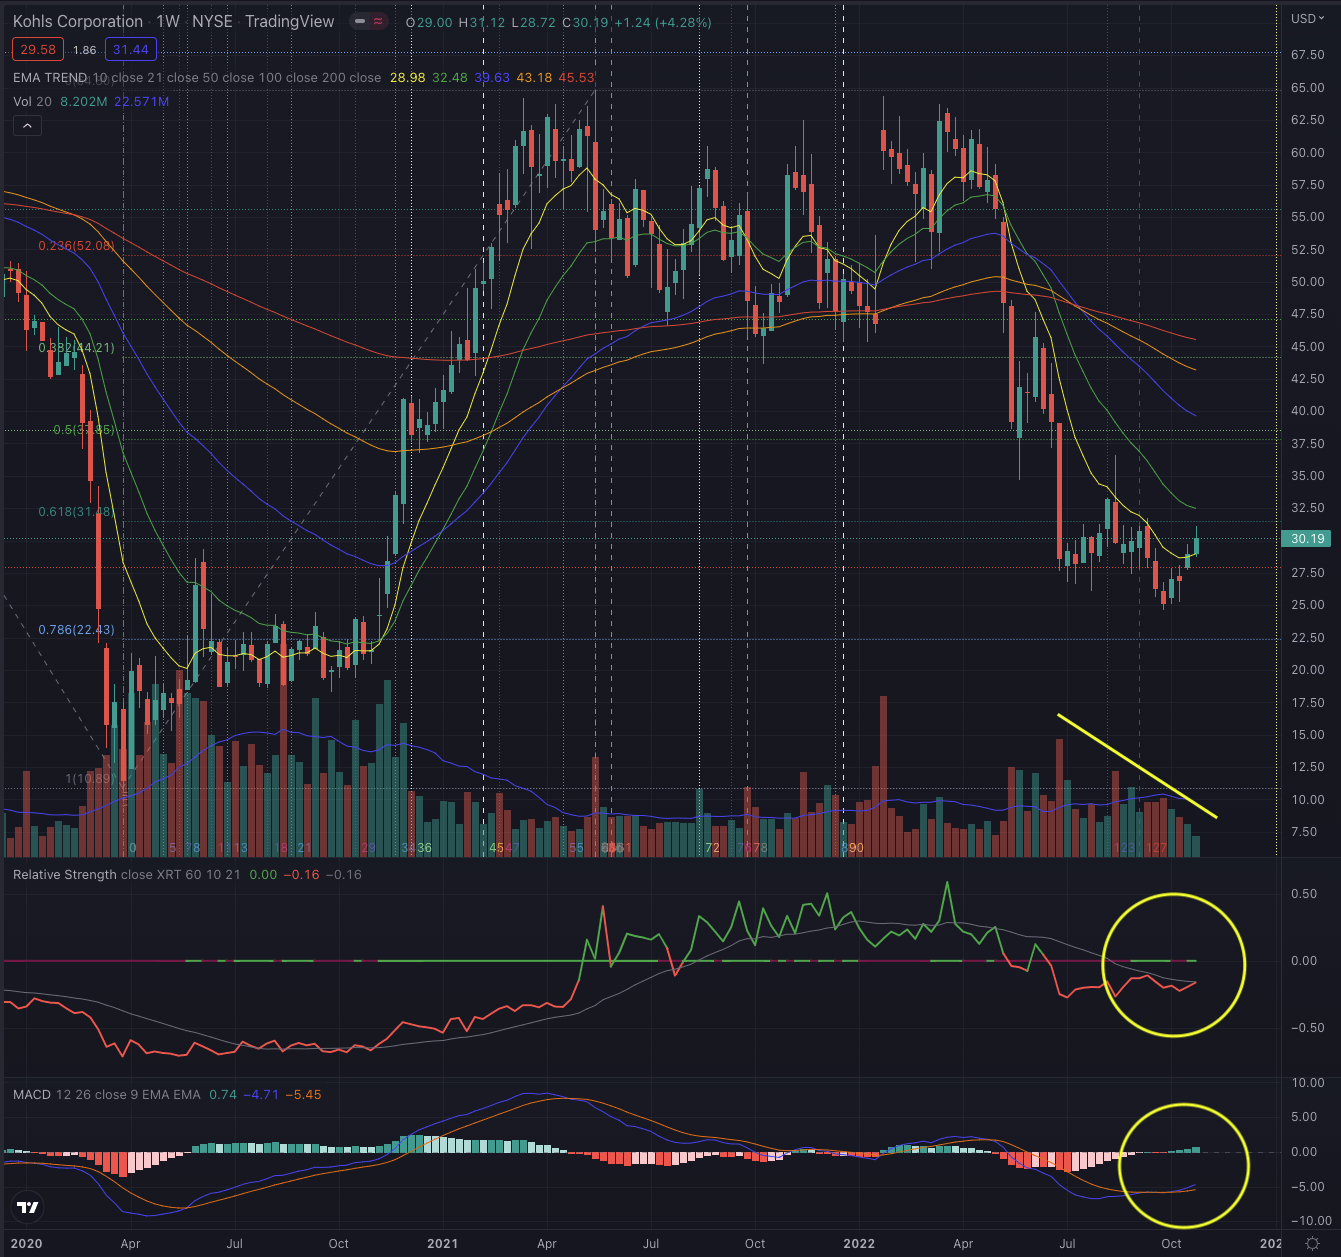
Author, using TradingView
I normally begin to consider stocks in a late stage 1 and preferably when breaking out into their stage 2. While KSS isn’t for the moment qualified as such, a few elements have attracted my attention.
What is coming next?
On a daily time frame, it’s interesting to observe how the stock is building up relative strength when compared to the broader SPDR S&P Retail ETF (XRT), which we have seen has been a major outperformer in the past few years. The stock has also just overcome its EMA50, a price level I closely observe as one of the most important indicators when taking an investment decision, while positive momentum is seemingly further building up. While this is not a rule of thumb, a meaningful contraction in volume is likely followed by a major movement, and the volume has been declining significantly under its average in the past few weeks. Kohl’s short interest has been falling as well from the peak seen during August, although this metric is reportedly still on a relatively higher level at 13.12%.
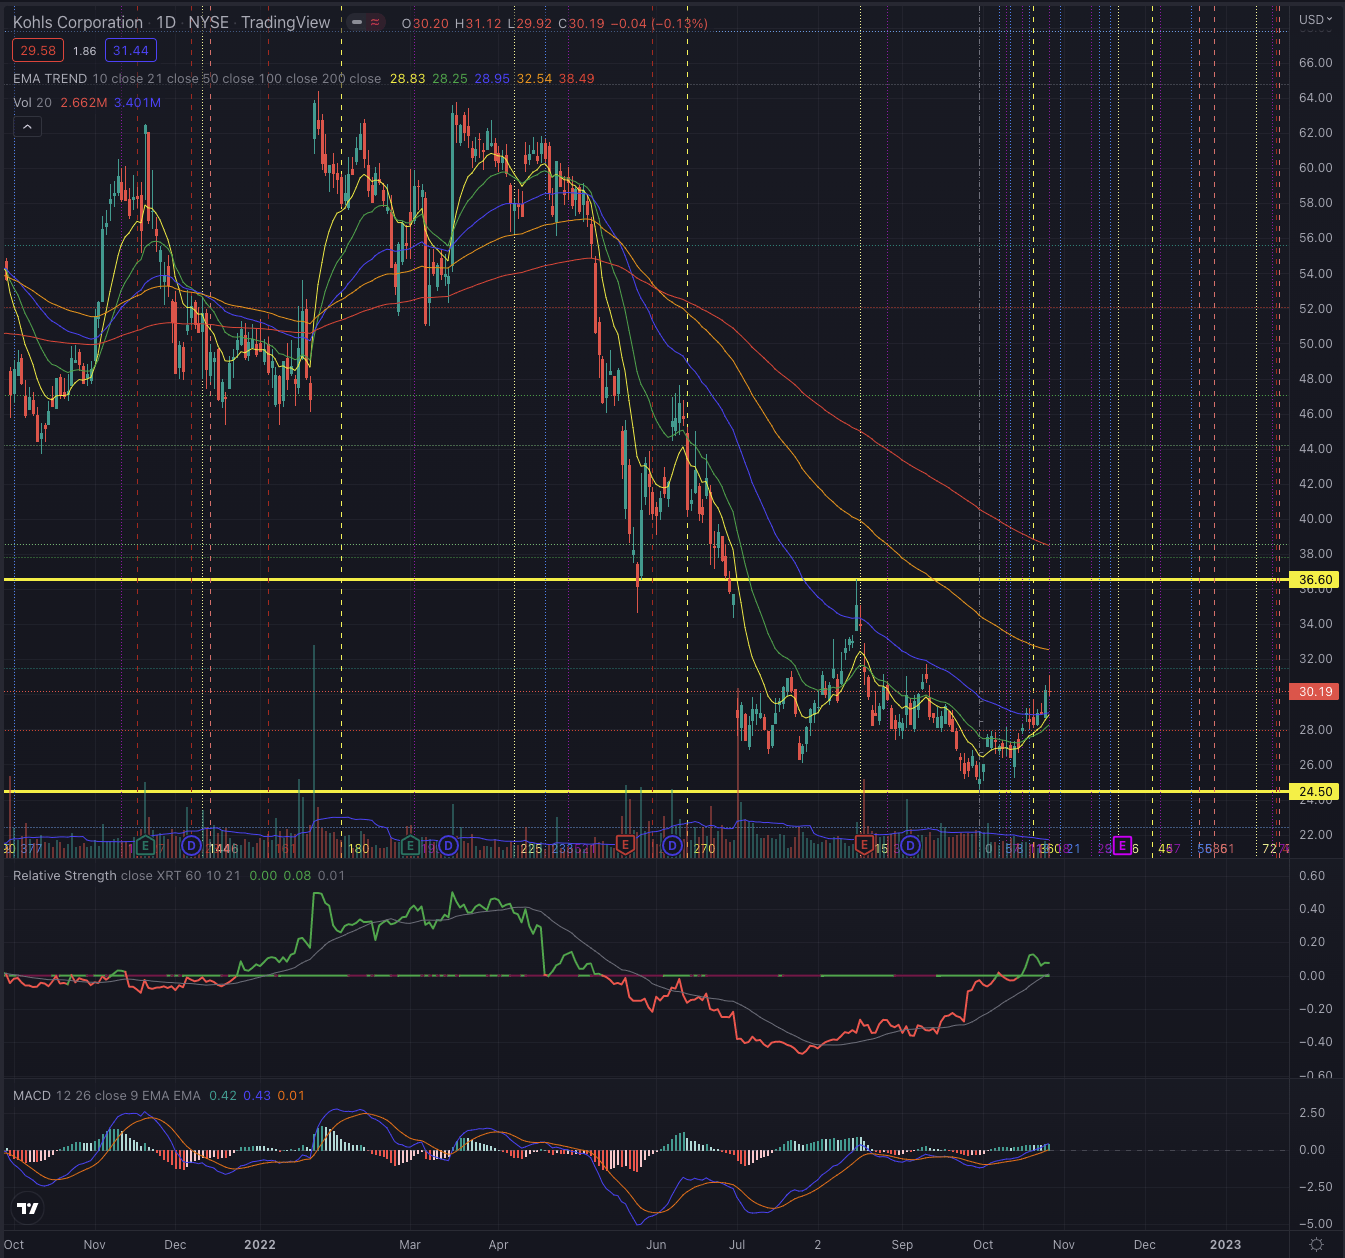
Author, using TradingView
I expect the stock to continue performing positively in the short term, as it may continue to rise in its positive momentum and build relative strength. Despite at this stage, I would certainly be very cautious, this stock may offer an interesting entry point for more risk-tolerant investors. The stock is now greatly extended, and could attempt to retrace part of its losses, trying to overcome its next resistance at $31.50, reaching its EMA100 as its next target and if enough strength has built up, even reaching its next most important resistance level, seen at $36.60, leading to a short-term 20% upside potential. While considering the still significant odds of seeing lower lows, I would size my position accordingly, by entering a first small position and limiting my downside to the EMA50 or at the very lowest toward the recent low at $24.50. Should the stock continue in its retracement, further positions could be added and investors could consider the stock’s EMA21 as a trailing stop, or increase their stop according to their risk tolerance while considering that the stock would likely test again its supports and would require a higher tolerance in volatility.
Long-term-oriented investors who believe in this company could consider sizing their entry points according to the stock’s strength in case of a consistent reversal in its price action. I would not consider any major position until the stock has not formed a sound base and completed its first stage while showing a significant breakout of its long-term downtrend over its EMA200.
The department stores industry has recently shown some relative strength, likely supported by a retracement of the dropping consumer sentiment in the US, but the macroeconomic outlook is still quite gloomy, and with the personal saving rate at a minimum, while consumer credit exposure has exploded since the pandemic, and interest rates are significantly rising, consumer discretionary spending could be at risk in the foreseeable future. Another good reason to set up strict risk management when investing in this industry.
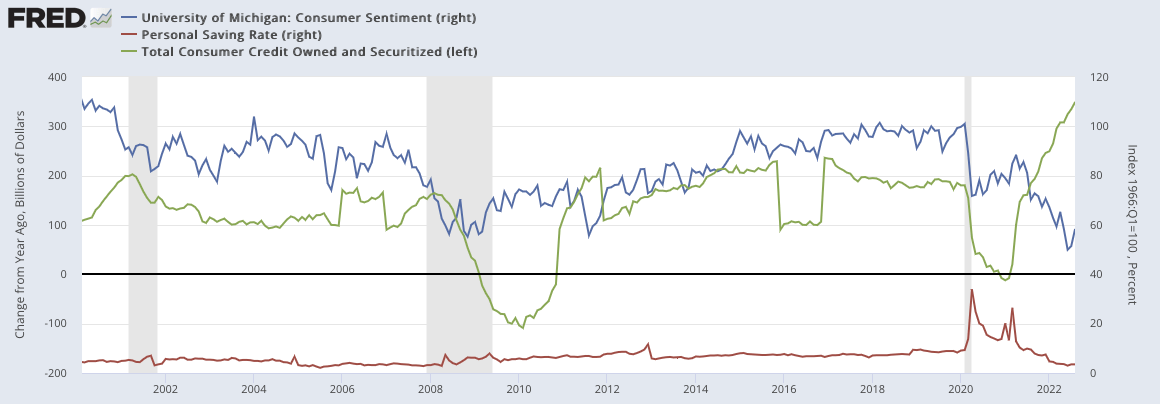
Author, using FRED
The bottom line
Technical analysis is not an absolute instrument, but a way to increase investors’ success probabilities and a tool allowing them to be oriented in whatever security. One would not drive towards an unknown destination without consulting a map or using a GPS. I believe the same should be true when making investment decisions. I consider techniques based on the Elliott Wave Theory, as well as likely outcomes based on Fibonacci’s principles, by confirming the likelihood of an outcome contingent on time-based probabilities. The purpose of my technical analysis is to confirm or reject an entry point in the stock, by observing its sector and industry, and most of all its price action. I then analyze the situation of that stock and calculate likely outcomes based on the mentioned theories.
Despite still bearing a major risk not only intrinsically, but also from exogenous macroeconomic factors, KSS has an interesting technical setup that leads me to give my opinion on possible entry points. More risk-tolerant investors could take advantage of these price levels not seen since the pandemic lows, by considering the mentioned elements that hint at a possible early reversal. While the bottom-building process could take more time, no one can predict that with certainty, but investors with systematic risk management and an appropriate position-sizing strategy, combined with a strictly executed contingency plan, can minimize their risk while taking advantage of a possible reversal.
Be the first to comment