

Moussa81
In the aftermath of the real estate market meltdown of 2008, the Fed implemented a policy known as quantitative easing (QE), wherein the central bank bought government bonds which had the effect of increasing the money supply in the economy. This allowed banks more money to lend out at lower interest rates.
From the beginning, it seemed the risk of QE was creating a scenario wherein too many dollars competed for goods and services that were not keeping pace with the money supply. When inflation hit the global markets in 2021 the Fed assumed it was simply due to the aftermath of the COVID pandemic. However, as consumer prices continued to accelerate in 2022, the Fed reversed course on QE.
Now the Fed’s goal is to bring the inflation rate (currently 7.75%) below the federal funds rate (currently 3.75%) in an action known as quantitative tightening (QT). The Fed does this by allowing the government bonds they have bought to expire without replacing them. This process drains trillions of dollars from the economy. When you consider the current numbers, the Fed has a ways to go before inflation falls below the federal funds rate.
How QE shaped the current economic environment
The Fed chart below shows that the US Monetary Base (M0)—the total amount of money in circulation and in bank deposits—is now five times higher in 2022 than it was in September 2008 before the Fed enacted its policy of quantitative easing. That’s a lot of money sloshing around in the market place.
Fig. 1
US Monetary Base from 1960 to 2022 (St. Louis Fed)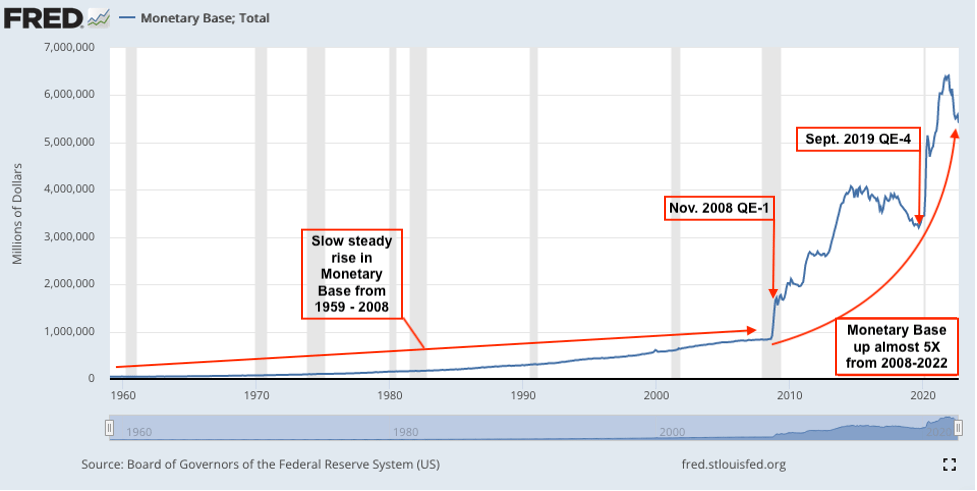
Fig. 2
Author created chart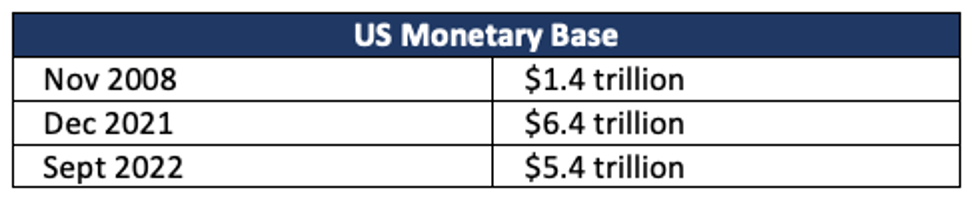
The S&P Chart below shows the dramatic effect four rounds of QE had on the stock market. When you compare the recovery of the 2000 recession to the recovery of the 2008 recession, you can see a significant difference. The S&P 500 had barely reached its previous high from 2000 once it topped again in 2007. But with the aid of QE, the S&P shot past its 2007 high in 2013 and continued to rise until reaching a market top three times higher than its previous top.
Fig. 3
Finance/Yahoo.com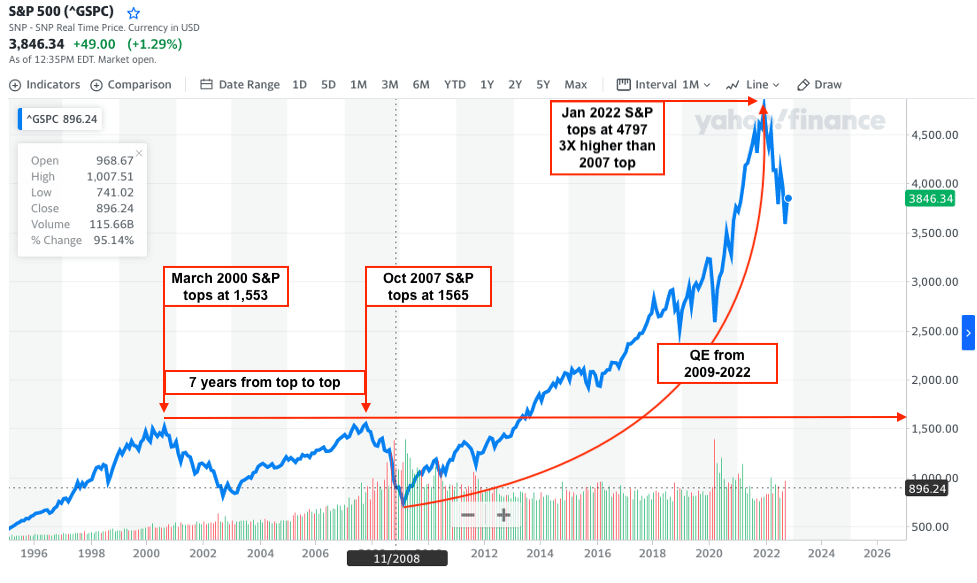
The above S&P 500 chart could be painting a picture of what’s in store for the stock market. Considering much of the rise since 2009 may have been due to Fed stimulation, there is a possibility the markets could fall quite a bit further than they already have. When the markets collapsed in 2008-09, they went slightly below the bottom reached after the tech bubble popped in 2000. Even if the S&P 500 were to drop to the previous 2007 S&P 500 high of 1,565, that is a precipitous drop of 67% from its recent high in January this year. That’s not to say the S&P 500 will drop that low. But since the Fed has recently signaled that rate hikes will continue for the time being, such a drop could be within the realm of possibilities.
Fig. 4
Consumer Price Index 2002-2022 (www.bls.gov)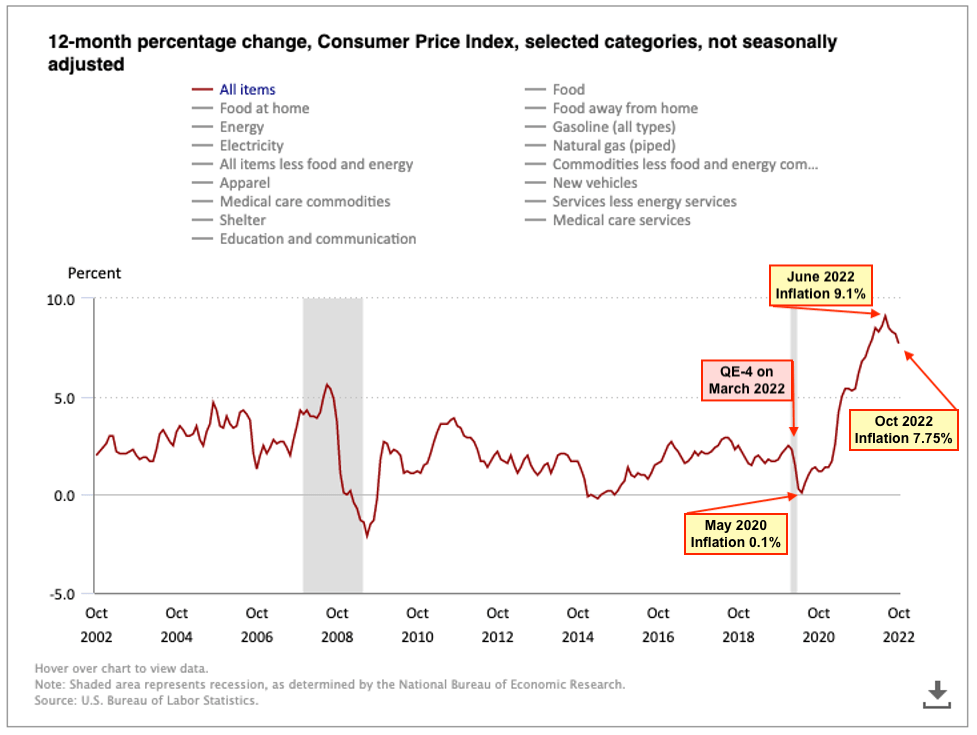
Interest rate on US Treasuries soaring
As the fiscal tightening continues, there’s a looming possibility that an increasing number of corporations will not be able to roll over their corporate bonds at these higher interest rates. Such a scenario could possibly set off a domino effect of forced bankruptcies and insurance payouts, much like we saw in 2008. Except the Fed would not be able to apply QE without the risk of devaluing the US dollar which could send inflation soaring. Global markets just witnessed this effect when the British government initiated another round of QE.
Fig. 5
Finance/Yahoo.com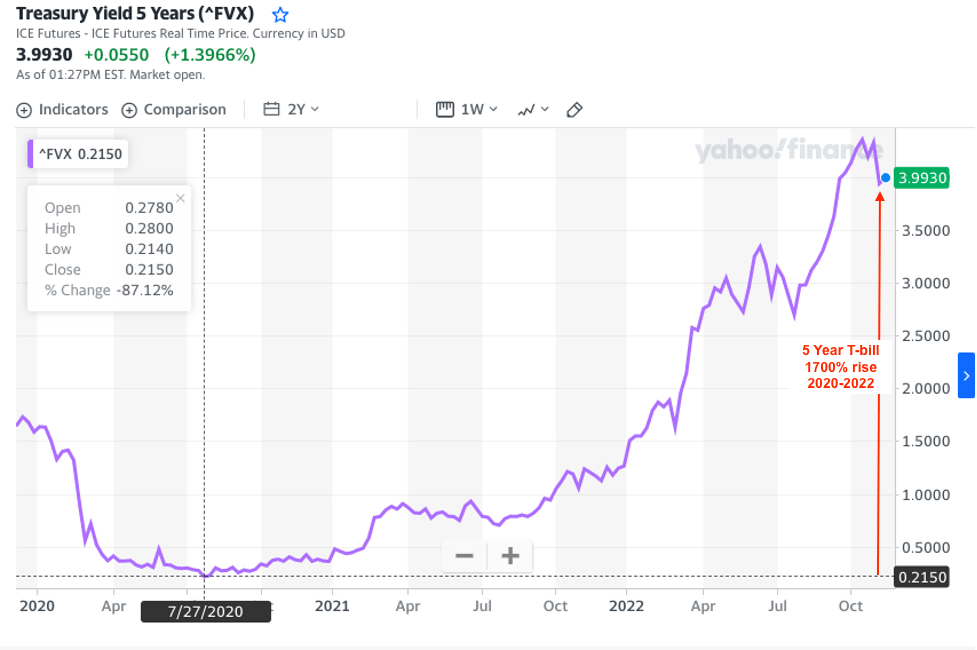
Global food and fuel shortages presage higher inflation in 2023
While many Wall Street investors are celebrating the recent down tick in the inflation rate, a quick snapshot of macroeconomics indicates that inflation could rise again over the winter. Due in part to sanctions on Russian grain and fuel, experts predict global shortages in both food and gas, particularly diesel fuel in the US, over the coming year. If you look at the Consumer Price Index chart above, it’s clear that inflation does not go either up or down in a straight line. It jigs and jags quite a bit. When you consider the larger picture, the recent down-tick in inflation is likely temporary.
While some may take this perspective as bad news, there is a silver lining in this cloud. Going into cash now–at least until the Fed has stopped raising the interest rates–could give investors the opportunity to recoup their losses by jumping back in once the markets form a bottom.
How to spot a market bottom
The only way to spot a market bottom that I know of is in the rearview mirror, but there are techniques you can use to catch it quickly enough to recoup your losses on the way back up. Look for an upside-down head and shoulders that coincides with a break above the 50-day moving average (MA) as shown in the chart below (set the chart to a one-week interval). Even though you will be getting in at a point slightly above the bottom, you will still be in an excellent position to profit from the ensuing bull market.
Fig. 6
Finance/Yahoo.com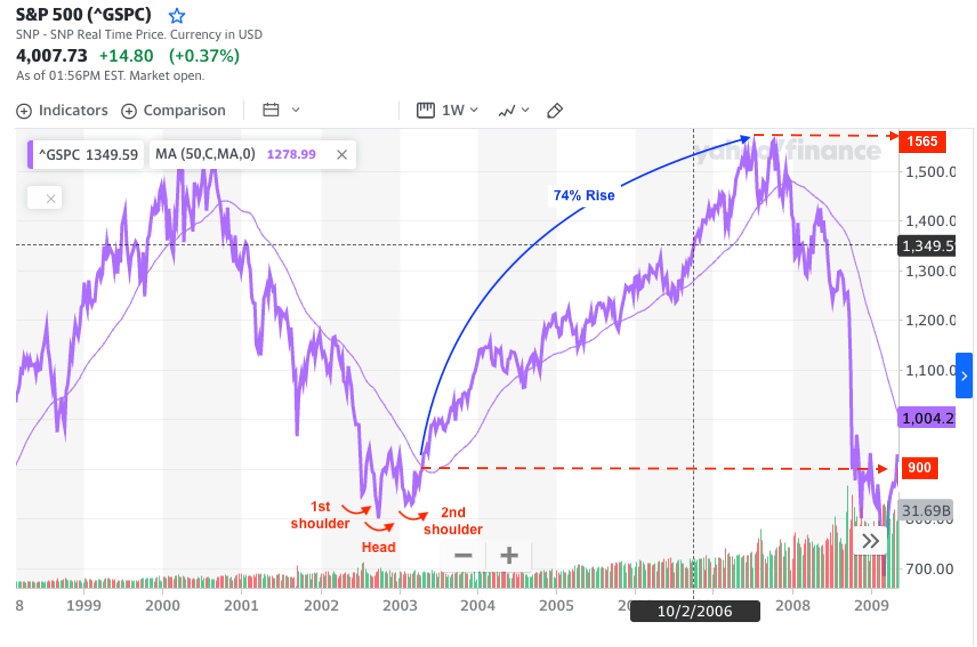
Fig. 7
Finance/Yahoo.com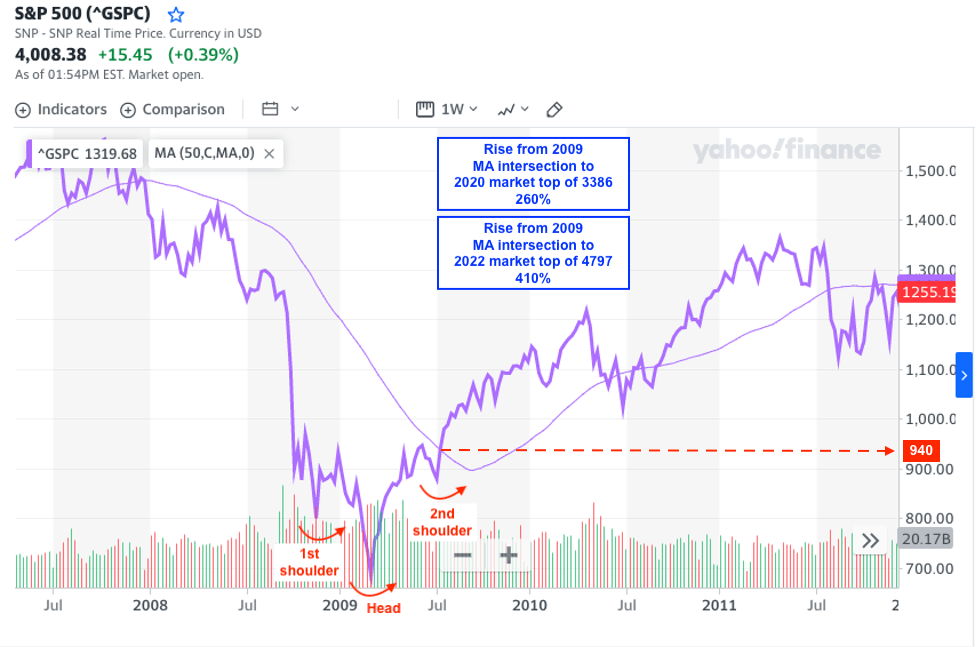
Summary
According to the Fed’s Monetary Base chart (Fig. 1) four rounds of QE starting in 2009 has quintupled the US’s money supply. Most central banks around the world were similarly applying QE to their economy and now inflation is persistent around the globe. Many central banks are applying QT in an effort to combat inflation.
Meanwhile, predicted food and fuel shortages indicate inflation could get worse in 2023. The Fed has made clear it will persist in raising interest rates for the time being. While Vice-chair Lael Brainard has announced the Fed will likely continue at a slower pace, the fact it continues at all means markets probably have further to fall. The recent rise in the stock market provides a good opportunity to increase the cash in your portfolio. Using the technique above to spot a market bottom is a good way to know when it’s time to shop for bargains on Wall Street.
Be the first to comment