

SusanneB
This article is part of a series that provides an ongoing analysis of the changes made to Kenneth Fisher’s 13F stock portfolio on a quarterly basis. It is based on Fisher Asset Management’s regulatory 13F Form filed on 8/9/2022. Please visit our Tracking Kenneth Fisher’s Fisher Asset Management Holdings article for an idea on his investment style and philosophy and our previous update highlighting the fund’s moves in Q1 2022.
This quarter, Fisher’s 13F portfolio value decreased ~14% from ~$165B to ~$141B. The number of holdings decreased from 1087 to 1066. Significantly large positions decreased from 70 to 66. The five largest individual stock positions are Apple, Microsoft, Amazon.com, Alphabet, and Visa. Together, they account for ~21% of the 13F stock portfolio.
Note: Fisher manages ~100,000 client accounts with a total AUM of ~$197B. Each such portfolio is personalized to client requirements and beating the S&P is not the focus for many of them. “13F Portfolio performance” which would be the performance of the sum total of all such monies in 13F securities is an unknown.
To know more about Ken Fisher, check out his Research Papers (most notably in Behavioral Finance) and investment books.
Stake Increases:
Apple Inc. (AAPL): AAPL is currently the top position at 6.35% of the portfolio. It was built in 2012 at prices between $15 and $18. The original stake was increased by ~60% in Q2 2013 at around the same price range. The position has since been increased substantially through incremental buying. The stock currently trades at ~$169.
Note: Apple stock split 4-for-1 in August 2020 and 7-for-1 in June 2014. The prices quoted above are adjusted.
Microsoft Corporation (MSFT): MSFT is a top-three 5.22% of the portfolio position. It is a very long-term stake that has been in the portfolio for well over a decade. The two years through Q2 2019 had seen a combined ~30% increase at prices between ~$69 and ~$137. Last three years have seen another ~38% increase at prices between ~$135 and ~$343. The stock is now at ~$289.
Amazon.com (AMZN): AMZN is a large (top three) 3.66% of the portfolio position. The stake is from 2011 at a cost-basis of ~$10. Q2 2016 saw a ~20% selling at prices between ~$29 and ~$36. There was another ~16% selling in Q2 2017 at prices between ~$44 and ~$51. The three quarters through Q1 2018 had seen a ~15% increase at prices between ~$47 and ~$80 while the following quarter saw a similar reduction at prices between ~$69 and ~$88. There was a ~22% stake increase over the last two quarters at prices between ~$136 and ~$185. The stock currently trades at ~$143. This quarter also saw a minor ~3% increase.
Note: the prices quoted above are adjusted for the 20-for-1 stock-split in June.
Alphabet Inc. (GOOG) (GOOGL): GOOG was a very small position that was built-up to a substantial 2% stake in 2011 at prices between ~$12 and ~$15. The position stands at 3.49% of the portfolio. Recent activity follows. Q3 2020 saw a ~8% selling at prices between ~$71 and ~$86 while next quarter there was a ~17% stake increase at prices between ~$73 and ~$92. Last six quarters also saw minor increases. The stock is now at ~$121.
Note: the prices quoted above are adjusted for the 20-for-1 stock-split last Month.
Visa Inc. (V): The Visa position was first purchased in 2012 at much lower prices compared to the current price of ~$212. The size of the stake had more than tripled in the following eight years through incremental purchases almost every quarter. Q3 2021 saw an about turn: ~45% selling over the last three quarters at prices between ~$190 and ~$251. The position is now at 1.90% of the portfolio. There was a minor ~3% increase this quarter.
Salesforce Inc. (CRM): The 1.83% CRM position saw a ~180% increase in Q4 2018 at prices between $121 and $160 and another ~55% increase next quarter at prices between $130 and $167. Q3 2019 also saw a ~30% stake increase at prices between $140 and $160. There was another ~50% stake increase in Q1 2020 at prices between $124 and $193. The stock is now at ~$189. Last nine quarters have also seen minor buying.
Home Depot (HD): HD is a 1.62% of the 13F portfolio position first purchased in 2012 at prices between $42 and $65. Q2 2017 saw a ~38% selling at prices between $146 and $159 and that was followed with another ~28% reduction in Q4 2017 at prices between $150 and $190. There was a reversal next quarter: ~14% stake increase at prices between $172 and $207. Q3 2019 saw a ~25% stake increase at prices between $202 and $234 while next quarter there was minor trimming. The stock is now at ~$312. Last ten quarters have seen minor increases.
ASML Holding (ASML): ASML became a significant part of the portfolio in Q1 2018 when there was a ~10% stake increase at prices between ~$175 and ~$215. Next major activity was in Q1 2020 when there was a roughly one-third stake increase at prices between ~$214 and ~$318. The stock currently trades at ~$566 and the stake is now at 1.55% of the portfolio. Last nine quarters have seen a one-third further increase. They are continuing to build the position.
Taiwan Semiconductor (TSM): TSM is a very long-term 1.52% of the 13F portfolio position. A large block was purchased in 2012 at prices between $12.50 and $16.50. The stake has wavered. Recent activity follows: The ten quarters through Q4 2018 saw periodic buying while the next seven quarters saw minor selling. The stock currently trades at ~$89. Last seven quarters have seen only minor adjustments.
Advanced Micro Devices (AMD): The 1.36% of the portfolio stake in AMD saw a ~25% stake increase in Q4 2021 at prices between ~$100 and ~$162. That was followed with a ~22% increase last quarter at prices between ~$103 and ~$150. This quarter also saw a minor ~3% increase. The stock currently trades at ~$99. The original position is from Q1 2020 purchased at prices between $40 and $57.
Note: they built this position while dropping Intel (INTC). The bulk of that selling happened during the last two quarters.
Meta Platforms (META), previously Facebook: The META stake was built in Q1 2020 at prices between ~$150 and ~$222. Q3 2021 saw a ~50% stake increase at prices between ~$337 and ~$382. That was followed with a ~25% stake increase next quarter at prices between ~$307 and ~$348. Last quarter also saw a ~17% increase at prices between ~$187 and ~$339. This quarter also saw a minor ~3% increase. The stock is now at ~$178 and the stake is at 1.32% of the portfolio.
Tencent Holdings ADR (OTCPK:TCEHY): The majority of the original TCEHY stake was purchased in Q2 2017. The quarter saw a 13.5M share purchase at prices between $29 and $37. The next two years had also seen incremental purchases. There was a ~23% stake increase in Q3 2019 at prices between $40.50 and $47.50. Q1 2020 also saw a ~23% stake increase at prices between $42 and $54. The current position is at ~39.87M shares. The stock is now at $38.25, and the stake is at 1.27% of the portfolio. Last several quarters have seen only minor adjustments.
Alibaba Group Holding (BABA): BABA is a 1.16% of the portfolio stake. The original position was from Q2 2015 at prices between $81 and $93. Q1 2017 saw a two-thirds increase at prices between $88 and $110. That was followed with a ~90% increase next quarter at prices between $107 and $144. There was a ~35% stake increase over the three years through 2020 at prices between ~$132 and ~$317. The stock currently trades at $92.43. Last six quarters have seen only minor adjustments.
PayPal Holdings (PYPL): The 0.86% PYPL stake was built in H1 2020 at prices between ~$85 and ~$174. The stock currently trades near the low end of that range at ~$99. Q4 2021 saw a ~20% stake increase at prices between ~$179 and ~$272. That was followed with a ~16% increase last quarter at prices between ~$94 and ~$195. This quarter also saw a minor ~3% increase.
Netflix (NFLX): The 0.81% NFLX stake saw a ~50% stake increase in Q1 2020 at prices between ~$299 and ~$388. Q4 2021 saw a ~30% stake increase at prices between ~$587 and ~$692. That was followed with a ~17% increase last quarter at prices between ~$331 and ~$597. The stock currently trades well below their purchase price-ranges at ~$244. This quarter saw a minor ~3% further increase.
3M Corp (MMM), Abbott Labs (ABT), AstraZeneca PLC (AZN), BHP (BHP), Broadcom (AVGO), Capital One Financial (COF), Caterpillar (CAT), Chevron Corp. (CVX), Costco Wholesale (COST), Danaher Corp. (DHR), Edwards Lifesciences (EW), Freeport-McMoRan (FCX), Goldman Sachs (GS), GSK plc (GSK), Intuit (INTU), Intuitive Surgical (ISRG), Invesco QQQ (QQQ), iShares 7-10 Yr. Treasury Bond (IEF), JPMorgan Chase (JPM), Johnson & Johnson (JNJ), Lam Research (LRCX), Morgan Stanley (MS), Mastercard Inc. (MA), Merck (MRK), NextEra Energy (NEE), NIKE, Inc. (NKE), NVIDIA Corp (NVDA), Novartis AG (NVS), Oracle Corporation (ORCL), Raytheon Technologies (RTX), Rio Tinto (RIO), SPDR Bloomberg BRCLYS LG TRS E, Shell plc (SHEL), Stryker Corp. (SYK), Thermo Fisher Scientific (TMO), TotalEnergies (TTE), Toyota Motor (TM), Uber Technologies (UBER), Union Pacific (UNP), Vanguard Intermediate-Term Corporate Bond ETF (VCIT), and Verizon Communications (VZ): These small (less than ~1.5% of the portfolio each) stakes were increased this quarter.
Stake Decreases:
Adobe Inc. (ADBE): ADBE is a 1.60% portfolio stake that saw a ~300% increase in Q4 2018 at prices between $205 and $275 and another ~75% increase next quarter at prices between $216 and $272. Q3 2019 also saw a ~30% stake increase at prices between $272 and $311. Q1 2020 saw another ~25% stake increase at prices between $285 and $383. The stock is now at ~$438. The seven quarters through Q4 2021 had seen minor buying while in the last two quarters there was a ~8% trimming.
American Express (AXP): AXP has been in the portfolio since 2012. The original position was around 9M shares purchased at an average cost in the 50s and the current stake is 15.36M shares. The two years through Q2 2020 had seen a combined ~40% stake increase at prices between $74 and $138. The stock is now at ~$162 and the stake is at 1.51% of the portfolio. Last two years have seen only minor adjustments.
Eli Lilly (LLY), iShares iBoxx (LQD), LVMH Moet Hennessy ADR (OTCPK:LVMUY), L’Oreal S.A. ADR (OTCPK:LRLCY), Novo Nordisk AS ADR (NVO), SAP SE ADR (SAP), and Sanofi ADR (SNY): These small (less than ~1.5% of the portfolio each) stakes were decreased this quarter.
Below are positions sized in the 0.1% to 0.5% range in the portfolio: ABB Ltd (ABB), Alcoa (AA), Align Technology (ALGN), American Tower (AMT), Anheuser-Busch InBev (BUD), Applied Materials (AMAT), Autodesk (ADSK), Banco Bilbao Vizcaya (BBVA), Banco Santander SA (SAN), Block Inc. (SQ) previously Square, BNP Paribas (OTCQX:BNPQF), BP plc (BP), Chart Industries (GTLS), Cleveland-Cliffs (CLF), Compagnie Financière Richemont (OTCPK:CFRUY), ConocoPhillips (COP), Crown Castle (CCI), CSX Corp. (CSX), Deere (DE), Devon Energy Corp. (DVN), DocuSign (DOCU), Domino’s Pizza (DPZ), Exxon Mobil (XOM), Fanuc Corp. (OTCPK:FANUF), Globant SA (GLOB), Halliburton Company (HAL), HDFC Bank (HDB), Hess Corp. (HES), Honda Motor (HMC), Infosys (INFY), ING Groep (ING), Intesa Sanpaolo SpA ADR (OTCPK:ISNPY), JD.com (JD), Kering SA (OTCPK:PPRUY), Marathon Oil (MRO), Medtronic plc (MDT), MercadoLibre Inc. (MELI), Murata Mfg. (OTCPK:MRAAY), Nestle (OTCPK:NSRGY), NetEase (NTES), Norfolk Southern (NSC), NXP Semi (NXPI), Petroleo Brasileiro (PBR), Pinduoduo (PDD), Roche Holding (OTCQX:RHHBY), Sandvik AB (OTCPK:SDVKY), Schlumberger (SLB), Schneider Electric (OTCPK:SBGSY), ServiceNow (NOW), SMC Corp Japan (OTCPK:SMCAY), Southern Copper (SCCO), SVB Financial (SIVB), Tokyo Electron (OTCPK:TOELY), Trip.com (TCOM), Unilever PLC (UL), Vale SA (VALE), Vinci SA (OTCPK:VCISY), and Zoom Video (ZM).
The spreadsheet below highlights changes to Fisher’s 13F stock holdings (only positions that are over 0.5% of the 13F portfolio each are individually listed) in Q2 2022:
Ken Fisher – Fisher Asset Management’s Q2 2022 13F Report Q/Q Comparison (John Vincent (author))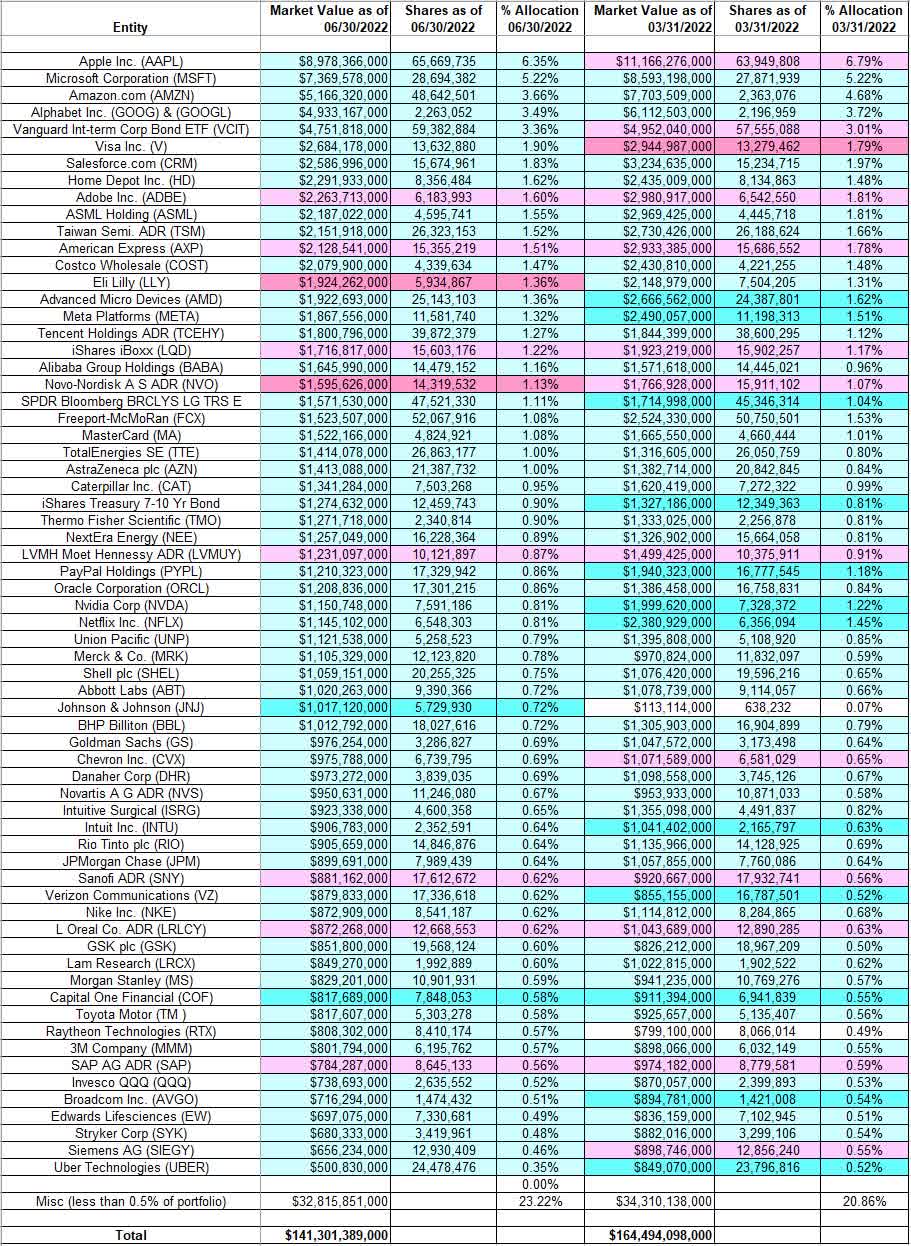
Be the first to comment