

Natee127/iStock via Getty Images
Price to Free Cash Flow Ratio
One of the most popular methods for valuing a business is the discounted cash flow model. This is a forward looking valuation technique that forecasts future cash flow, then discounts it back to the present day and presents the user with a fair price to pay for the business. Another method for valuing stocks is by the use of multiples, the most popular multiple is the price to earnings ratio. This ratio tells investors how many dollars they have to pay today for each dollar a company is earning, hence the name “multiples”. I believe that using the price to free cash flow ratio is superior to the price to earnings ratio. It is very similar to the price to earnings ratio but instead tells investors how many dollars they have to pay today for each dollar of free cash flow the underlying business generates.
I believe the superiority of P/FCF lies in the fact that free cash flow is a better indicator of financial health than earnings. Earnings can be more easily manipulated and don’t necessarily measure the true growth of a business. Free cash flow is more difficult to inflate and therefore is a more accurate representation of growth. The exception here is with Financial stocks that see cash from operating activities vary from year to year. Let me show you just how well a simple P/FCF strategy has worked out historically.
Historical Results
I came across a 60 year study measuring the power of the price to free cash flow ratio applied to the DJIA universe of stocks. Here is a link to the original study if you’d like to see the full results. The author of the study tested how well investing in members of the DJIA between 1950 and 2009 worked out, selecting only companies that were trading for a P/FCF multiple around 15x, and holding the position from January 1st to December 31st. The same process was repeated each year. During this 60 year period of time the DJIA had an average gain of 6.77% per year. The stocks selected using the P/FCF multiple had an average gain of 21.08% per year. This is a remarkable long term rate of return; however, the true impact is better visualized when applying these hypothetical returns to a monetary investment. Based on the authors finding a $10K investment in the DJIA in 1950 would increase to about $511K by the end of 2009. The same $10K investment into the P/FCF selections would grow to $965 million by the end of 2009.
I attempted to duplicate the author’s original results and came up with slightly different, but similar, average returns and hypothetical portfolio valuations. In my test the DJIA had an average rate of return of 8.07% (6.77% in the original study) and a final value of about $516K for a $10K investment. Whereas the P/FCF strategy’s average rate of return was 22.88% with a final value exceeding $1 billion for a $10K investment. We can chalk up the differences to the quality of data available and measurement techniques. Regardless of which results are more accurate, the P/FCF ratio achieved remarkable results during this 60 year period of time.
Additionally I wanted to test this ratio with more recent data, so I performed the same analysis between 2018 and May 2022. During this roughly 4.5 year period the DJIA had a compounded annual rate of return of 8.91% while the P/FCF selections grew at a compounded annual rate of 10.7%. While these results are not as remarkable they too generated alpha over the popular index. A case can be made against using the 15x multiple as a threshold for fair valuation, perhaps this ratio was fitting decades ago however today the stock market typically trades for higher multiples. Using the average P/FCF ratio for all DJIA members between 2017 and 2021 as a fair value threshold led to slightly better results with a compounded annual rate of return of 11.49%. Taking this thought process one step further, evaluating each of the 30 DJIA stocks individually using a trailing average P/FCF multiple once more improved the rate of return to 15.11%.
Let me now show you 8 dividend growth stocks that are currently trading for attractive price to free cash flow multiples.
Applied Materials (AMAT)
The first company on the list is Applied Materials that provides manufacturing equipment, services, and software to the semiconductor, display, and related industries. Based on its trailing twelve month financials the stock currently trades for a P/FCF ratio of 15.49. Its 5 year trailing P/FCF ratio is 18.03, and it has a long term 10 year trailing P/FCF ratio of 19.58. Comparing the current P/FCF ratio to the trailing averages implies a potential 14% undervaluation, using the 5 year multiple, and a higher 21% undervaluation based on the 10 year multiple.
Free cash flow was measured as cash from operations less Capex. Diluted shares outstanding were used to compute free cash flow per share. And to compute the P/FCF ratio I used the average month end price for all 12 months in a given calendar year.
During the last 10 years free cash flow increased at an average rate of 20.85% per year. Diluted shares outstanding decreased at an average rate of 2.94% per year.
Using the long term trailing average P/FCF ratios the fair price for the stock is in the range of $104 to $113. The stock had a price of $89.59 at market close on Thursday June 16th.
Here is a chart showing the P/FCF ratio (blue line) and the trailing 3 (green line) and 5 (gray line) year average.
Created by Author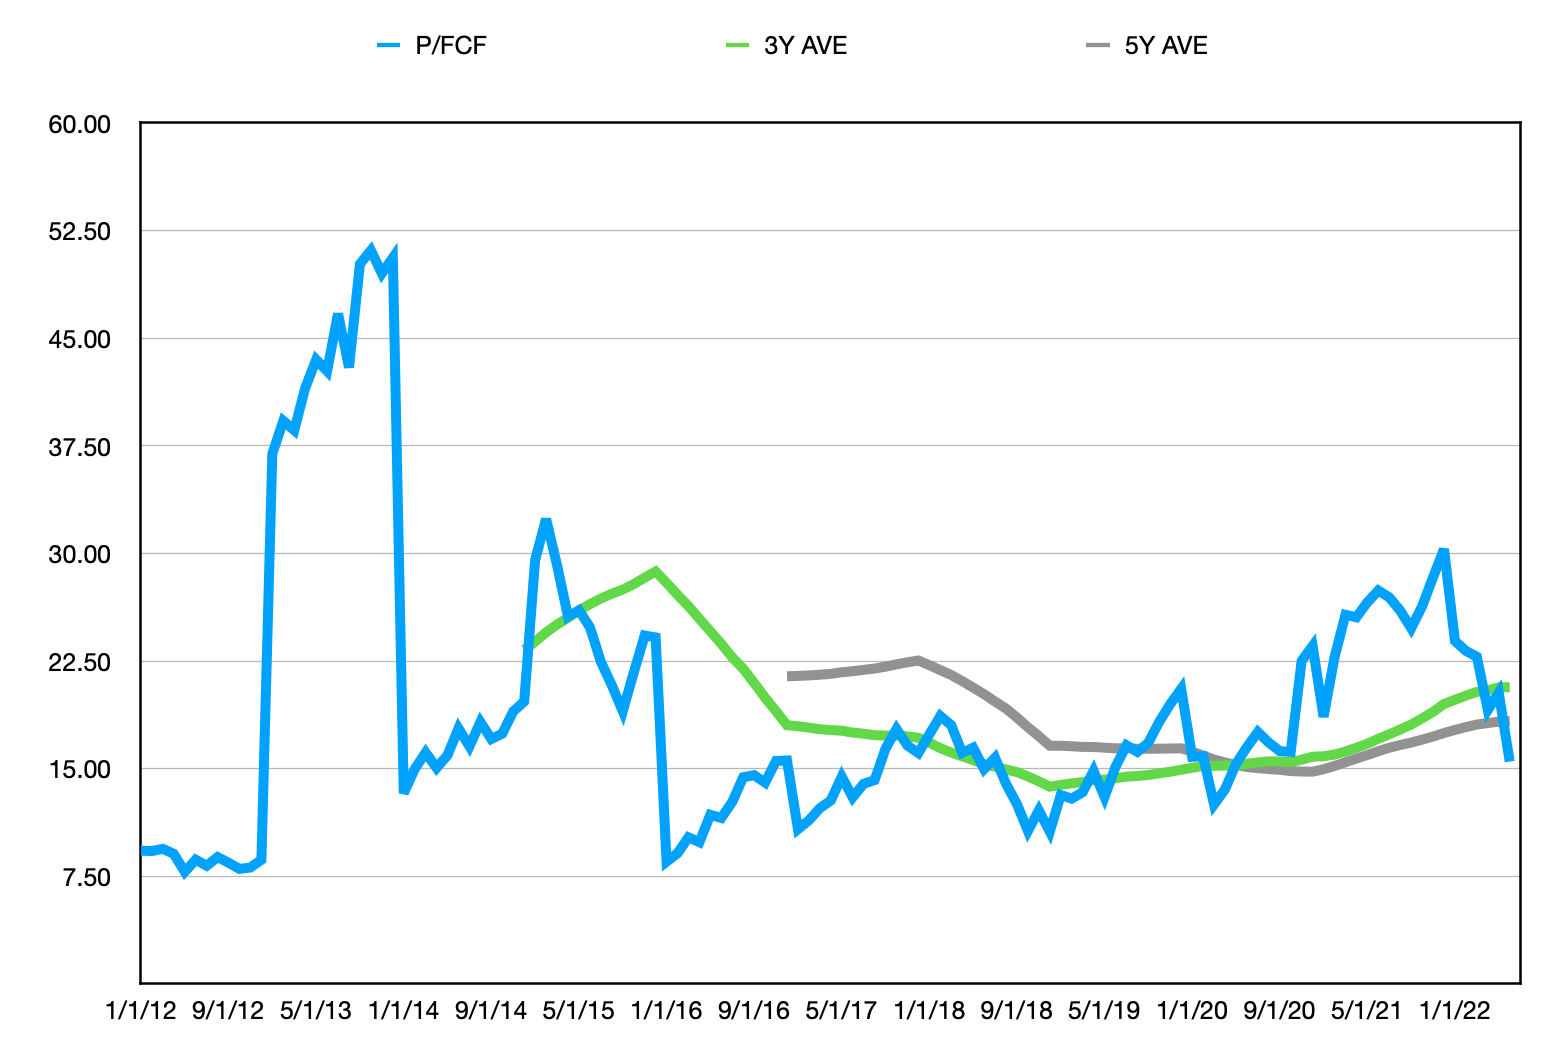
Expeditors International of Washington (EXPD)
Expeditors International of Washington, Inc. provides logistics services in the Americas, North Asia, South Asia, Europe, the Middle East, Africa, and India. Based on its trailing twelve month financials the stock currently trades for a P/FCF ratio of 18.59. Its 5 year trailing P/FCF ratio is 22.52, and it has a long term 10 year trailing P/FCF ratio of 22.24. Comparing the current P/FCF ratio to the trailing averages implies a potential 17% undervaluation, using the 5 year multiple, and a 16% undervaluation based on the 10 year multiple.
During the last 10 years free cash flow increased at an average rate of 17.42% per year. Diluted shares outstanding decreased at an average rate of 1.94% per year.
Using the long term trailing average P/FCF ratios the fair price for the stock is in the range of $115 to $116. The stock had a price of $96.30 at market close on Thursday June 16th.
Here is a chart showing the P/FCF ratio (blue line) and the trailing 3 (green line) and 5 (gray line) year average.
Created by Author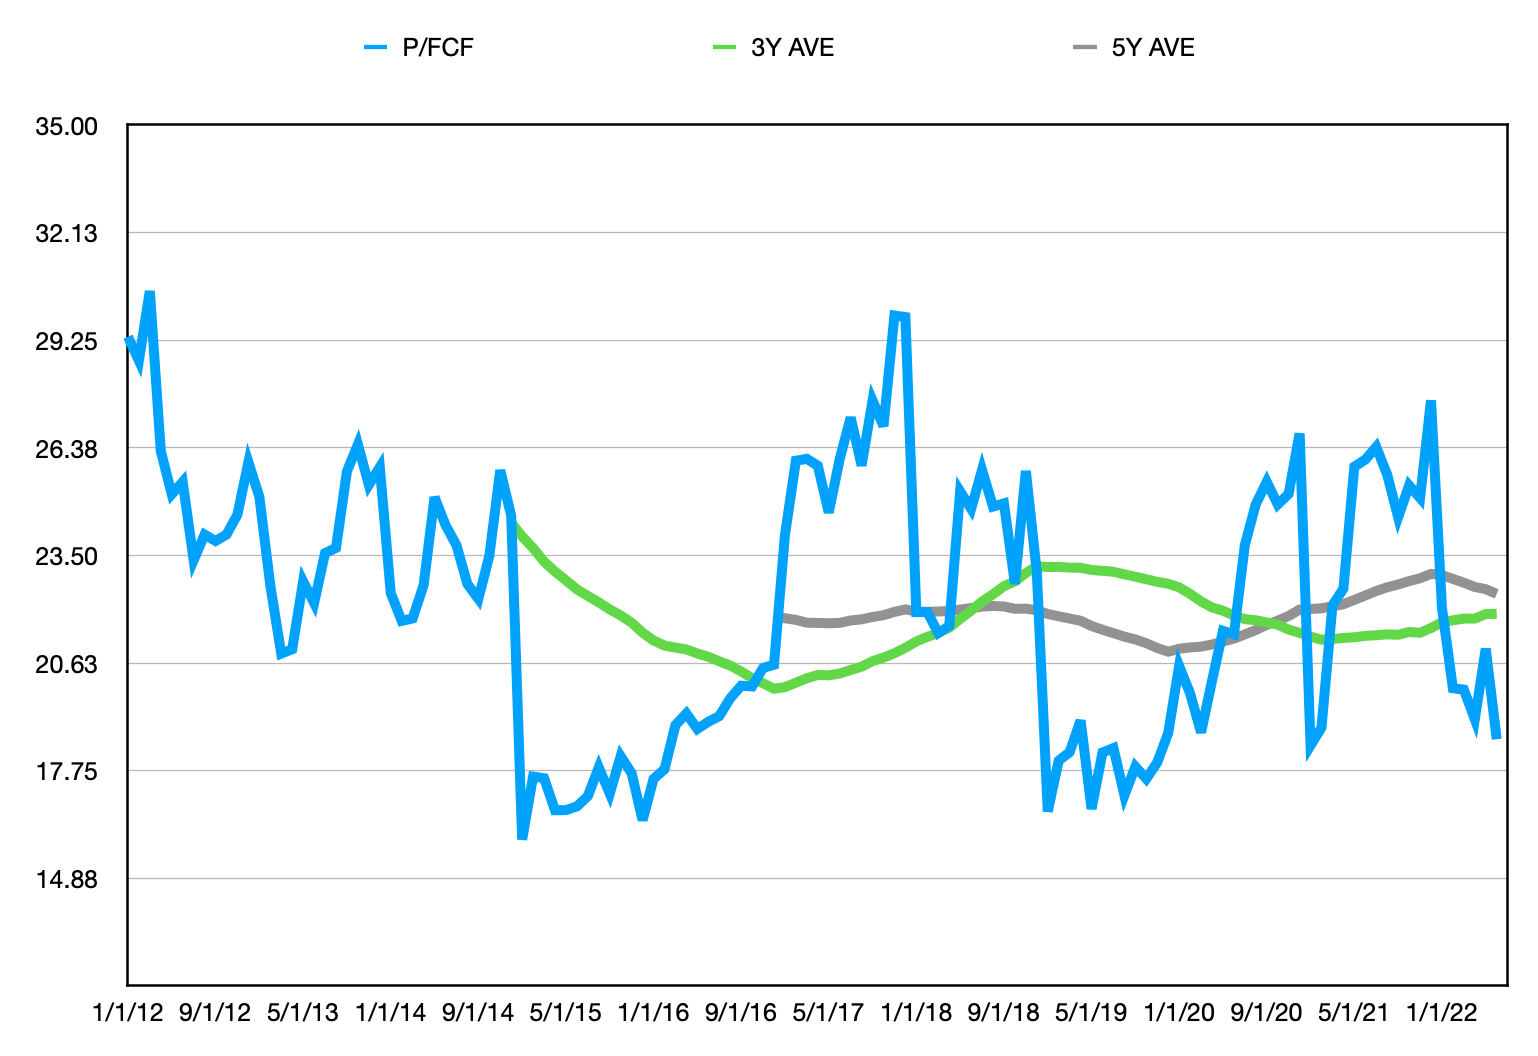
Intercontinental Exchange (ICE)
Intercontinental Exchange, Inc., together with its subsidiaries, operates regulated exchanges, clearing houses, and listings venues for commodity, financial, fixed income, and equity markets in the United States, the United Kingdom, the European Union, Singapore, Israel, and Canada. Based on its trailing twelve month financials the stock currently trades for a P/FCF ratio of 18.04. Its 5 year trailing P/FCF ratio is 20.55, and it has a long term 10 year trailing P/FCF ratio of 19.79. Comparing the current P/FCF ratio to the trailing averages implies a potential 12% undervaluation, using the 5 year multiple, and a 9% undervaluation based on the 10 year multiple.
During the last 10 years free cash flow increased at an average rate of 32.37% per year. Diluted shares outstanding increased at an average rate of 5.47% per year.
Using the long term trailing average P/FCF ratios the fair price for the stock is in the range of $104 to $108. The stock had a price of $94.85 at market close on Thursday June 16th.
Here is a chart showing the P/FCF ratio (blue line) and the trailing 3 (green line) and 5 (gray line) year average.
Created by Author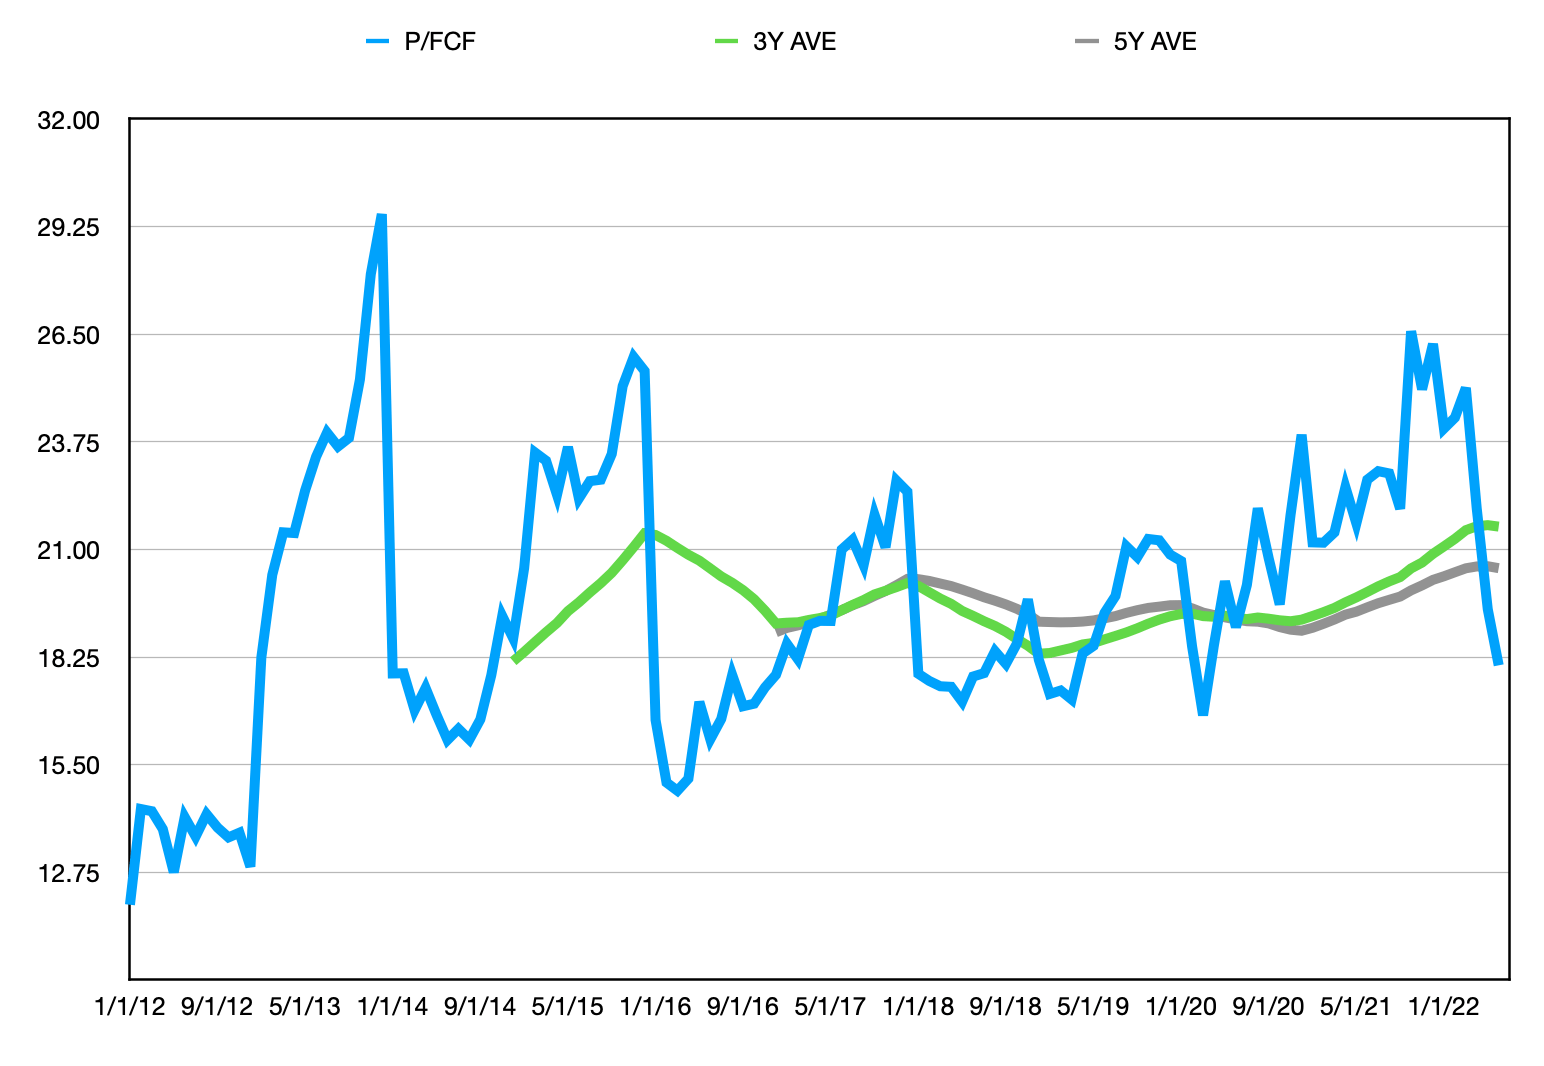
Starbucks (SBUX)
Starbucks Corporation, together with its subsidiaries, operates as a roaster, marketer, and retailer of specialty coffee worldwide. Based on its trailing twelve month financials the stock currently trades for a P/FCF ratio of 23.13. Its 5 year trailing P/FCF ratio is 25.31, and it has a long term 10 year trailing P/FCF ratio of 28.85. Comparing the current P/FCF ratio to the trailing averages implies a potential 8% undervaluation, using the 5 year multiple, and a 20% undervaluation based on the 10 year multiple.
During the last 10 years free cash flow increased at an average rate of 30.36% per year. Diluted shares outstanding decreased at an average rate of 2.39% per year.
Using the long term trailing average P/FCF ratios the fair price for the stock is in the range of $77 to $88. The stock had a price of $70.95 at market close on Thursday June 16th.
Here is a chart showing the P/FCF ratio (blue line) and the trailing 3 (green line) and 5 (gray line) year average.
Created by Author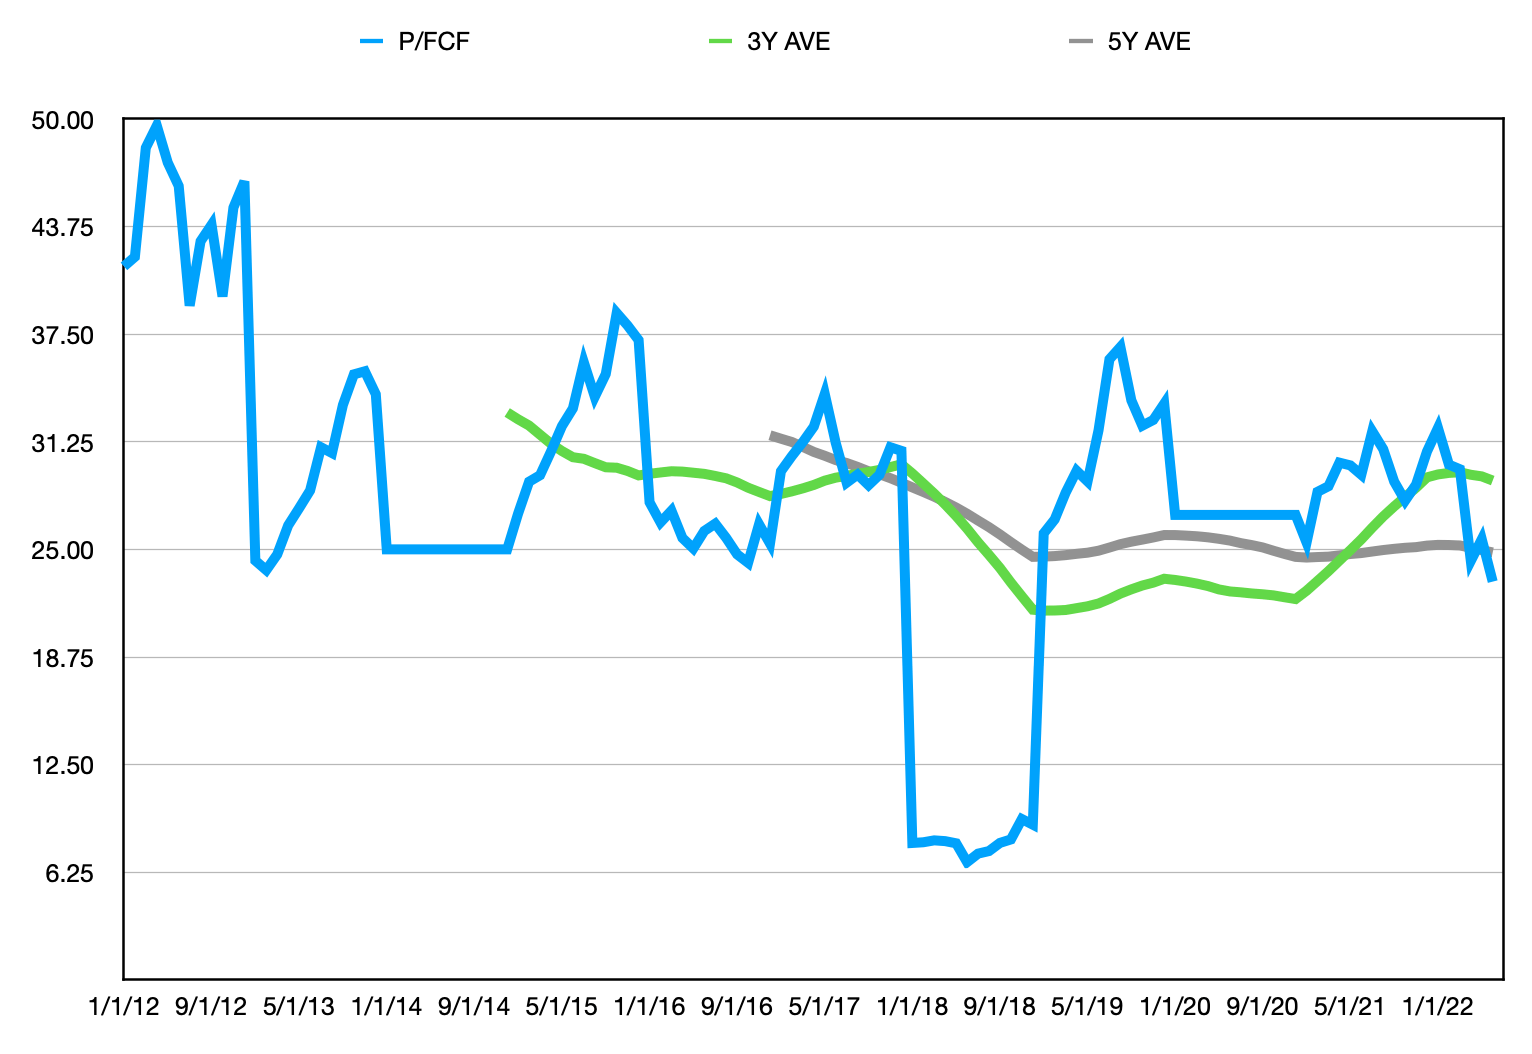
SS&C Technologies (SSNC)
SS&C Technologies Holdings, Inc., together with its subsidiaries, provides software products and software-enabled services to financial services and healthcare industries. Based on its trailing twelve month financials the stock currently trades for a P/FCF ratio of 10.74. Its 5 year trailing P/FCF ratio is 15.39, and it has a long term 10 year trailing P/FCF ratio of 16.80. Comparing the current P/FCF ratio to the trailing averages implies a potential 30% undervaluation, using the 5 year multiple, and a 36% undervaluation based on the 10 year multiple.
During the last 10 years free cash flow increased at an average rate of 107.22% per year. Diluted shares outstanding increased at an average rate of 6.12% per year.
Using the long term trailing average P/FCF ratios the fair price for the stock is in the range of $79 to $86. The stock had a price of $55.22 at market close on Thursday June 16th.
Here is a chart showing the P/FCF ratio (blue line) and the trailing 3 (green line) and 5 (gray line) year average.
Created by Author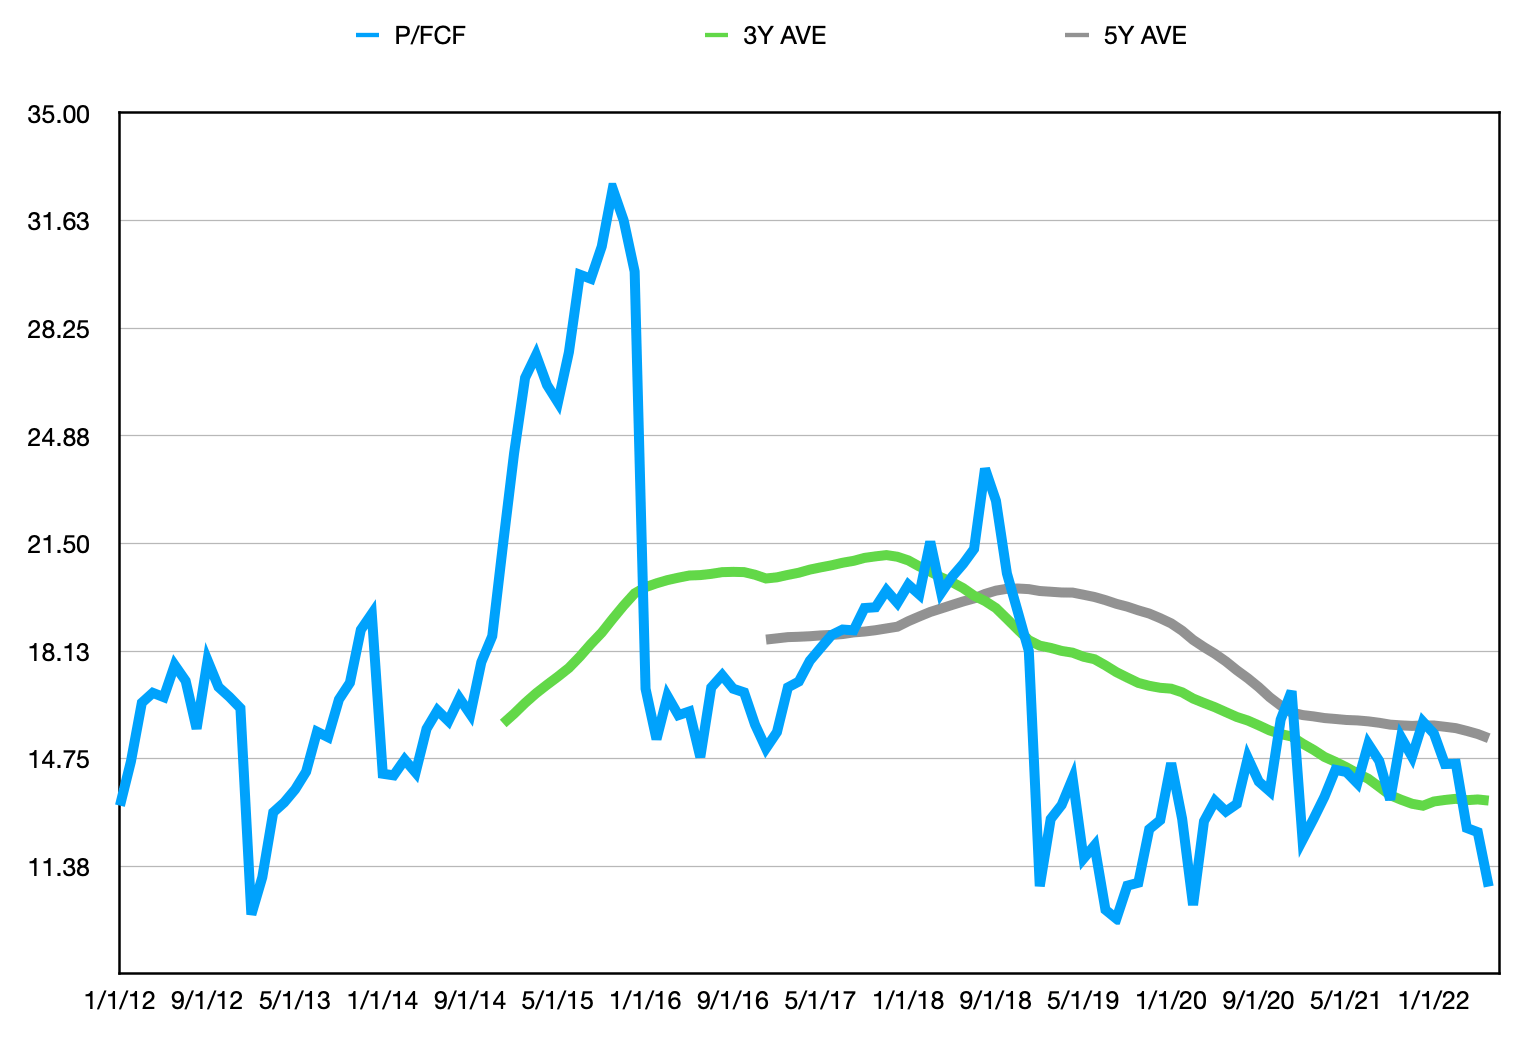
Skyworks Solutions (SWKS)
Skyworks Solutions, Inc., together with its subsidiaries, designs, develops, manufactures, and markets proprietary semiconductor products, including intellectual property in the United States, China, South Korea, Taiwan, Europe, the Middle East, Africa, and rest of Asia-Pacific. Based on its trailing twelve month financials the stock currently trades for a P/FCF ratio of 14.28. Its 5 year trailing P/FCF ratio is 20.53, and it has a long term 10 year trailing P/FCF ratio of 20.44. Comparing the current P/FCF ratio to the trailing averages implies a potential 30% undervaluation, using both the 5 year and 10 year multiple.
During the last 10 years free cash flow increased at an average rate of 44.69% per year. Diluted shares outstanding decreased at an average rate of 1.33% per year.
Using the long term trailing average P/FCF ratios the fair price for the stock is in the range of $128 to $129. The stock had a price of $89.75 at market close on Thursday June 16th.
Here is a chart showing the P/FCF ratio (blue line) and the trailing 3 (green line) and 5 (gray line) year average.
Created by Author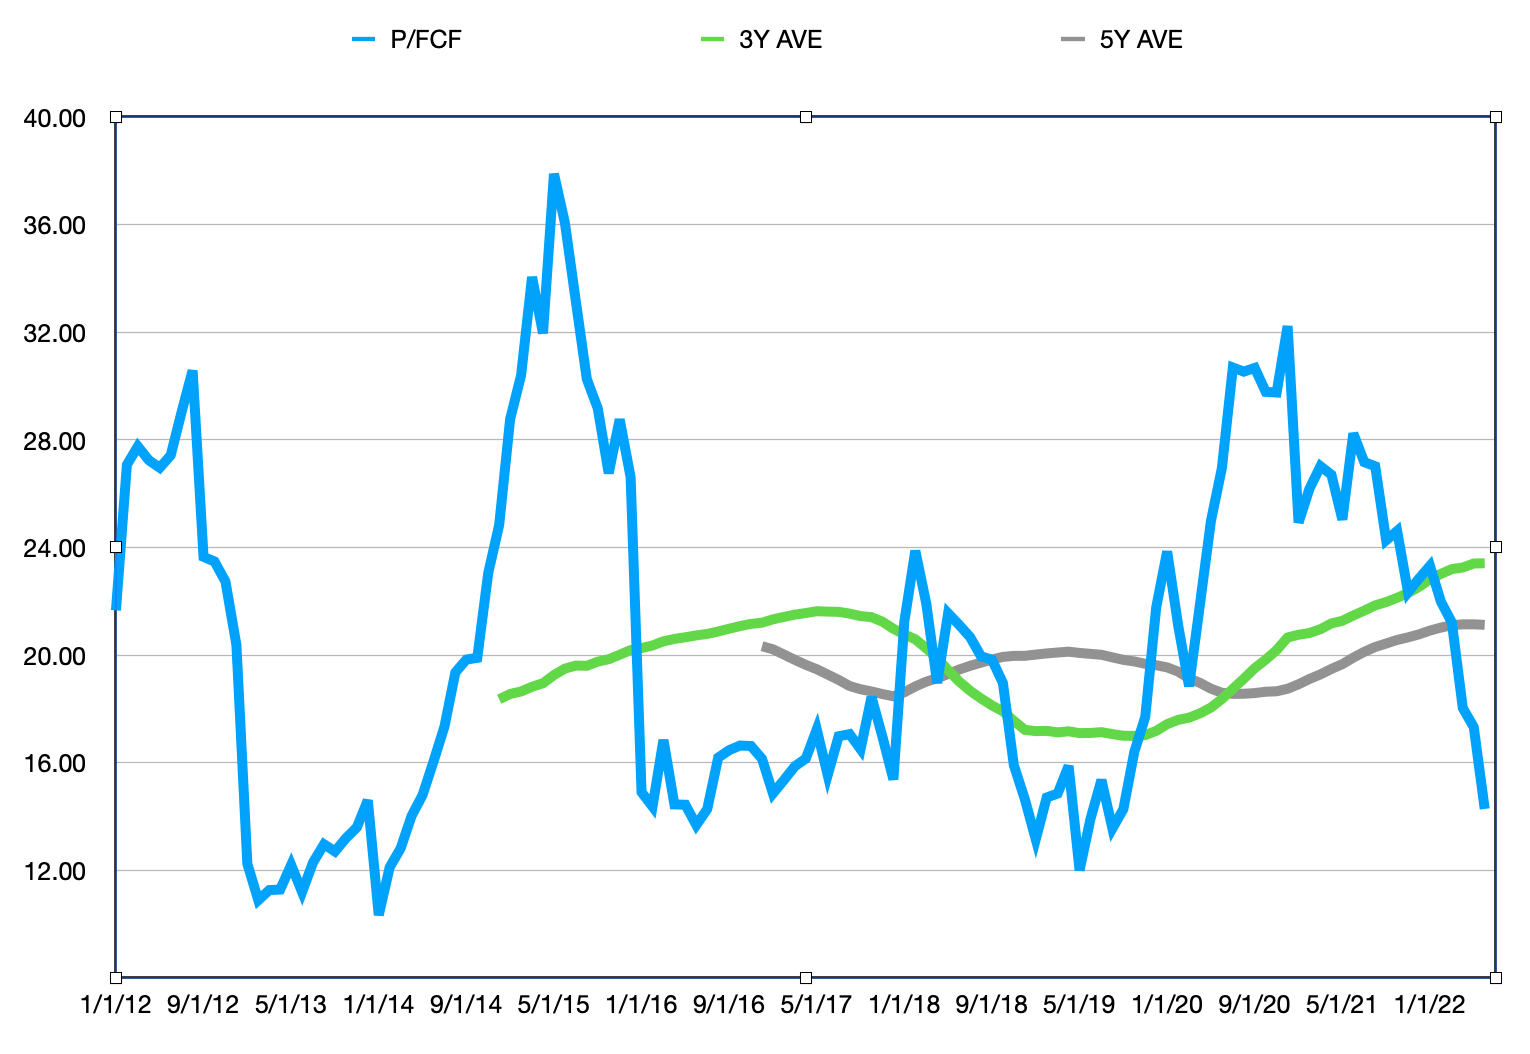
T. Rowe Price Group (TROW)
T. Rowe Price Group, Inc. is a publicly owned investment manager. The firm provides its services to individuals, institutional investors, retirement plans, financial intermediaries, and institutions. Based on its trailing twelve month financials the stock currently trades for a P/FCF ratio of 7.30. Its 5 year trailing P/FCF ratio is 15.74, and it has a long term 10 year trailing P/FCF ratio of 16.50. Comparing the current P/FCF ratio to the trailing averages implies a potential 54% undervaluation, using the 5 year multiple, and a 56% undervaluation based on the 10 year multiple.
During the last 10 years free cash flow increased at an average rate of 30.27% per year. Diluted shares outstanding decreased at an average rate of 1.23% per year.
Using the long term trailing average P/FCF ratios the fair price for the stock is in the range of $229 to $239. The stock had a price of $106.09 at market close on Thursday June 16th.
Here is a chart showing the P/FCF ratio (blue line) and the trailing 3 (green line) and 5 (gray line) year average.
Created by Author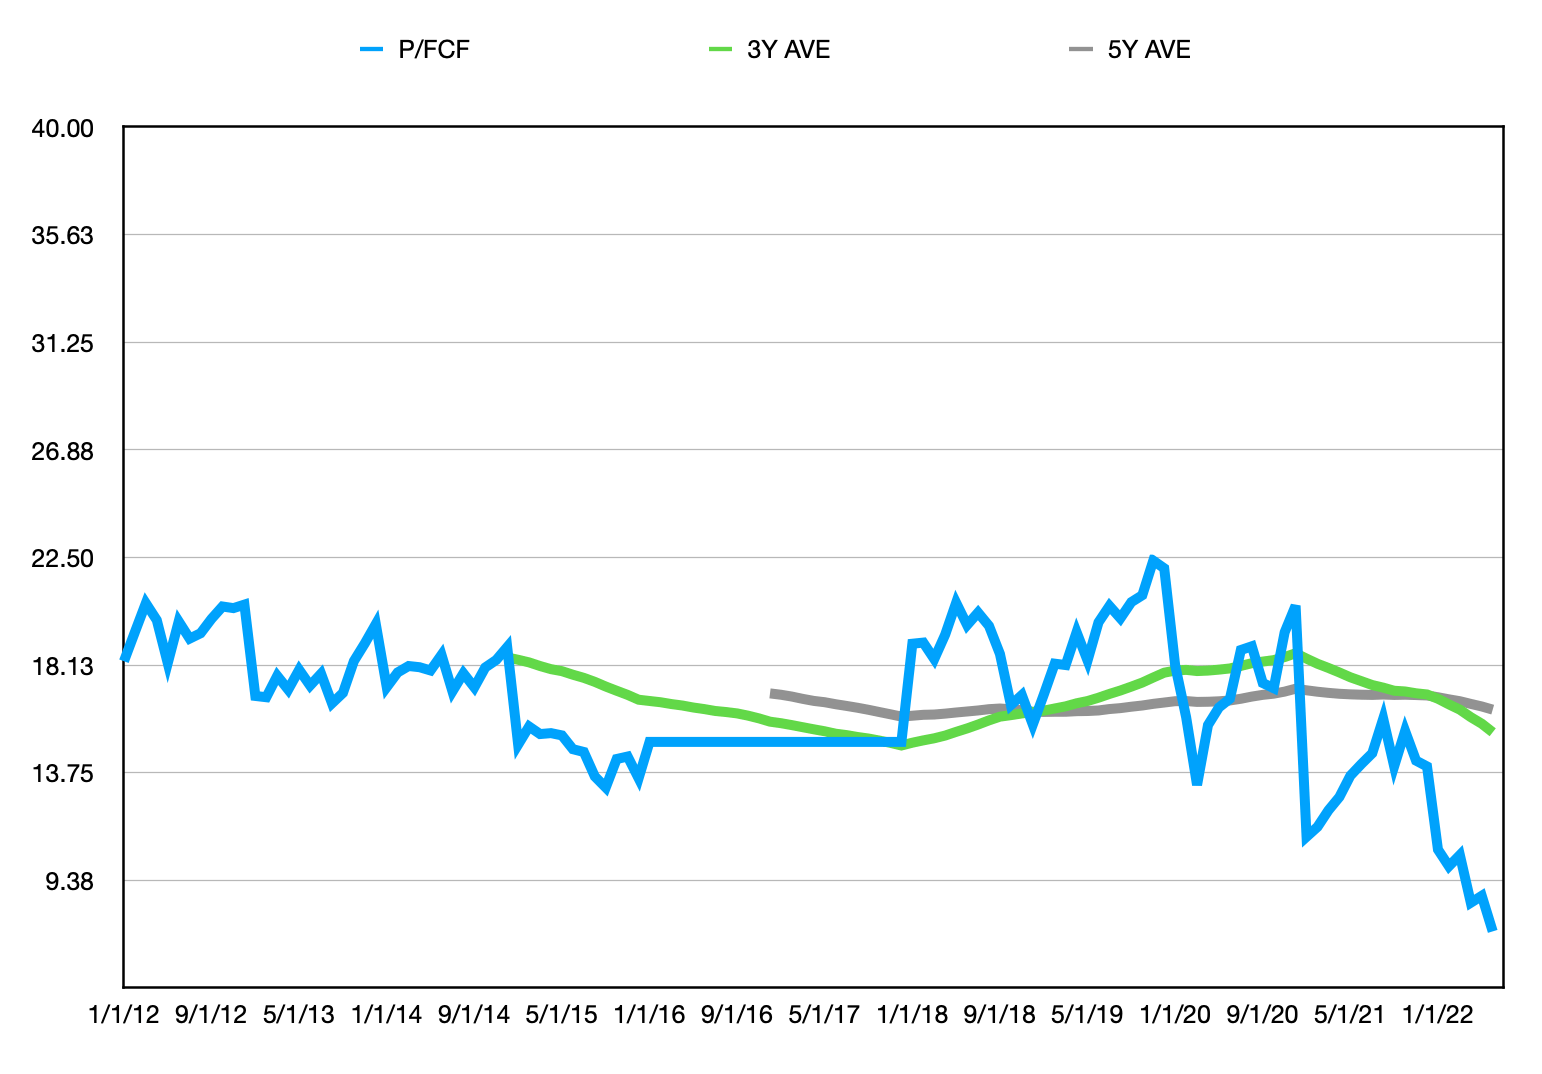
Visa (V)
Visa Inc. operates as a payments technology company worldwide. The company facilitates digital payments among consumers, merchants, financial institutions, businesses, strategic partners, and government entities. Based on its trailing twelve month financials the stock currently trades for a P/FCF ratio of 26.79. Its 5 year trailing P/FCF ratio is 32.05, and it has a long term 10 year trailing P/FCF ratio of 31.27. Comparing the current P/FCF ratio to the trailing averages implies a potential 16% undervaluation, using the 5 year multiple, and a 14% undervaluation based on the 10 year multiple.
During the last 10 years free cash flow increased at an average rate of 22.98% per year. Diluted shares outstanding decreased at an average rate of 1.88% per year.
Using the long term trailing average P/FCF ratios the fair price for the stock is in the range of $221 to $226. The stock had a price of $189.05 at market close on Thursday June 16th.
Here is a chart showing the P/FCF ratio (blue line) and the trailing 3 (green line) and 5 (gray line) year average.
Created by Author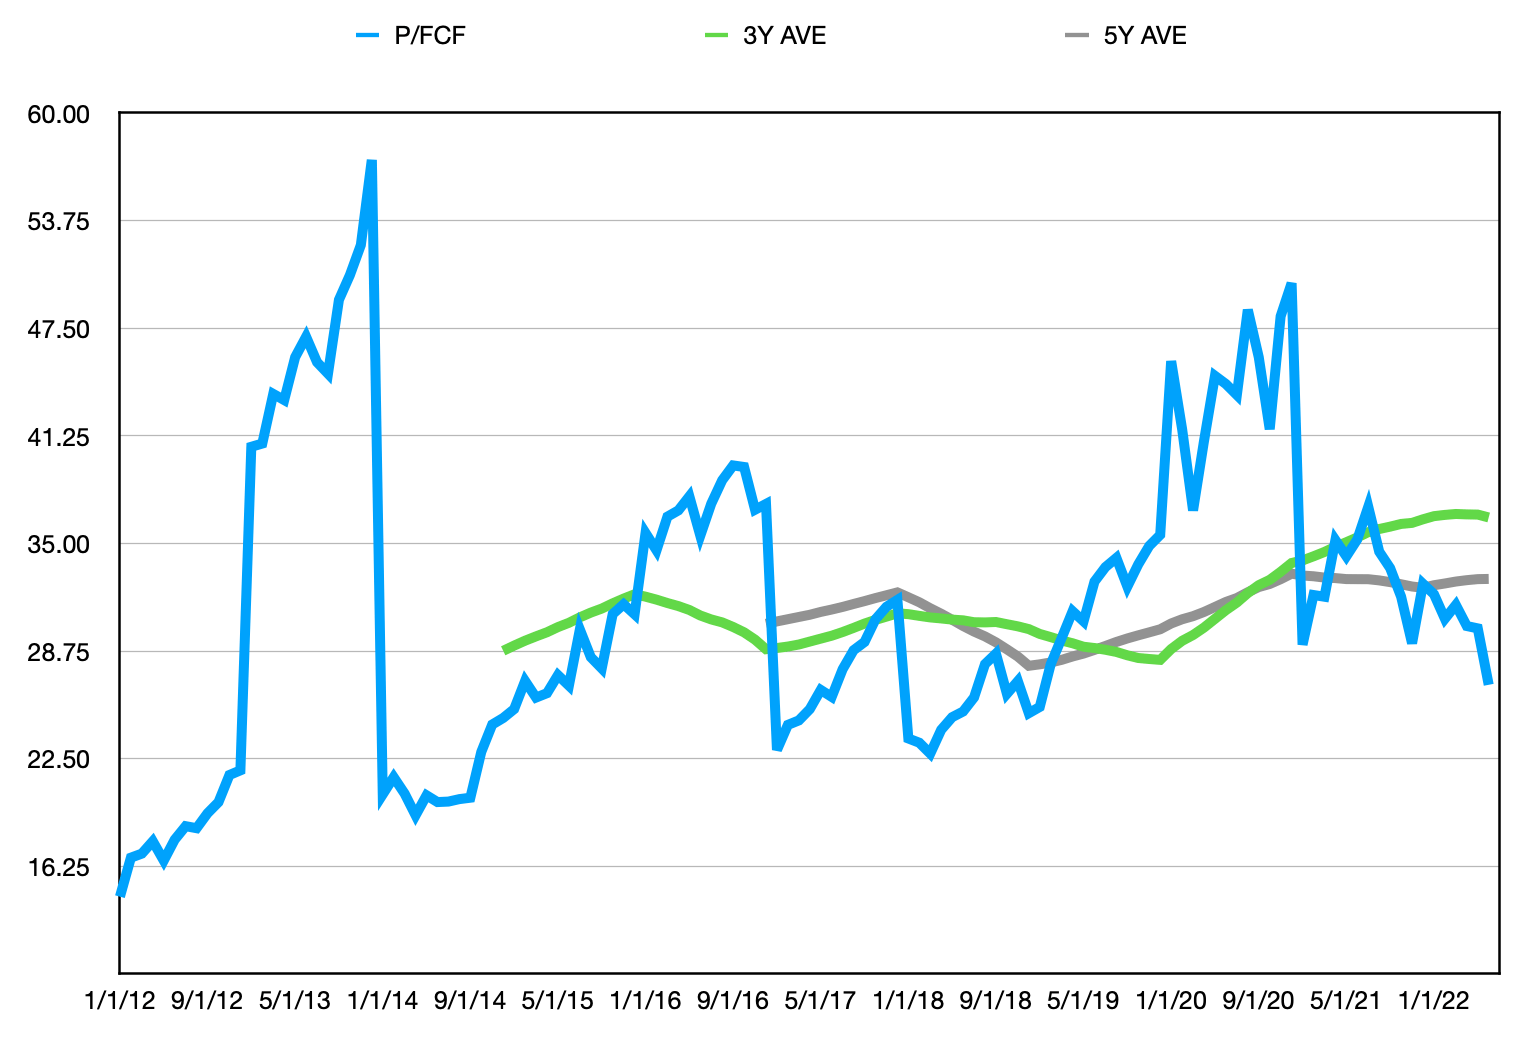
Summary
To sum up, past performance is not indicative of future returns, therefore I encourage everyone to perform further due diligence on all 8 companies presented in this article. I believe they are all high quality businesses that are currently trading for attractive prices. I own shares in each of these companies and have been dollar cost averaging during the current market weakness.
Be the first to comment