


mi-viri
Investment Summary
The profitable end of US med-tech has continued to deliver outsized alpha on a risk-adjusted basis in 2022. These stocks sit at the long end of the equity curve and have exhibited minimal drawdown this YTD. Case in point is STAAR Surgical Company (NASDAQ:STAA), the low-beta, high quality offering long ours that I advocated to buy back in July [see here]. Since then, we’ve captured 12.05% of the planned upside target set in that report to $98 [alpha vs. S&P500 = 10.96%] and with a recent pull back in the STAA share price this lends me an ideal opportunity to revisit the name and reinstate the buy thesis for the stock. Net-net, I rate STAA a buy on a $98 price target.
Exhibit 1. STAA 6-month price action
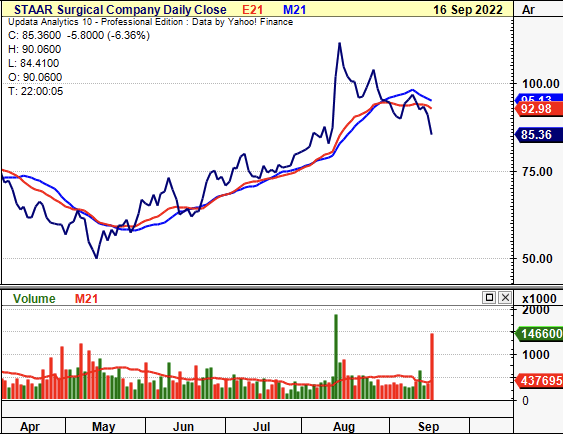
Data: Updata
Market Factors
The stock continues to gain in strength relative to the US medical devices and health care equipment index, as seen below. Whilst this has levelled off in September, recent returns are most certainly idiosyncratic in nature given the down-shift in covariance structure relative to the index. This is a point I’d highlighted in the previous update on STAA and I’d note today the market is continuing to reward low-beta, high quality names that display robust bottom-line fundamentals. In fact, it’s pleasing to see the stock still catch such a strong bid whilst gaining against the sector in relative performance.
Exhibit 2. Recent returns have been idiosyncratic in nature and aren’t just beta-related
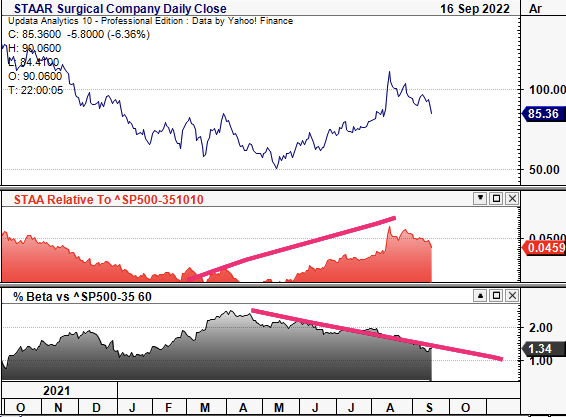
Data: Updata
I’d like to see this kind of chart continue in its pattern whereby the STAA share price continues to deviate from the med-tech/health care indices whilst rewarding shareholders in price distribution.
STAA Q2 earnings supportive of further upside
STAA came in with another strong set of numbers both on GAAP and non-GAAP terms. Net sales climbed 30% YoY to $81.1 million (“mm”) and were up 28% sequentially. Driving the upside was a 42% increase in ICL unit volume, with particular strengths seen across all geographies [domestically, and internationally]. The ICL division continues to contribute roughly 96% of total turnover, with the remainder split to other product revenue.
Geographically, growth was exhibited across numerous markets, including a 45% YoY growth in China, 36% YoY U.S. growth and 41% gain in its Japan segment. Sales into India and other APAC also spiked 181% and 66%, respectively. In particular, U.S. sales benefitted from the domestic launch of the EVO Visian ICL myopia lenses during the quarter, curiously, partnering with Joe Jonas [of the modern-day pop band, The Jonas Brothers] in addressing his distance vision using the company’s EVO lenses.
This point creates a meaningful tailwind that investors should continue to factor in looking ahead. The company has embarked on an advertising campaign using Jonas and other paid brand ambassadors and the coupling of EVO to various celebrities’ sight has potential to extend reach and add validity to the procedure as well. Despite this, management is projecting a pullback in top-line growth in Q3, calling for $74–$75mm in revenue for the period [~-750bps QoQ] secondary to Forex headwinds that were also recognized last quarter as well.
Moving down the P&L quickly, gross margin saw a ~10bps headwind YoY but climbed ~100bps QoQ due to the more favourable geographic mix, with another c.100bps of margin decompression forecast for FY22 full-year guidance. OPEX pulled into ~$47mm as it saw some pressures at the G&A line due to increased facility costs and compensation expense. Meanwhile, R&D expenditure stretched up by ~$700,000 YoY due to the same. STAA printed quarterly operating income of $17mm on a 21% margin, up from 17.1% this time last year. It brought this down to $13mm at the bottom line or $0.26 in GAAP EPS for the period.
Cash flow and ROIC trends continue to satisfy
As seen in Exhibit 3, STAA has continued to recognize steady quarterly FCF yield since FY16. FCF yield rests at ~50bps at Q2 FY22 and looks to be working its way north from FY20 lows. In particular, FCF has remained healthy on a cyclical basis and each reinvestment of FCF back into operations has yielded a corresponding gain on investment. Hence, whilst FCF conversion has tightened in recent periods this is well supported by an uptick in return on the invested capital it has been allocated to, as seen in Exhibit 4.
Exhibit 3. FCF trends continue to remain resilient, cyclical, with corresponding gain on FCF reinvestment back into operations
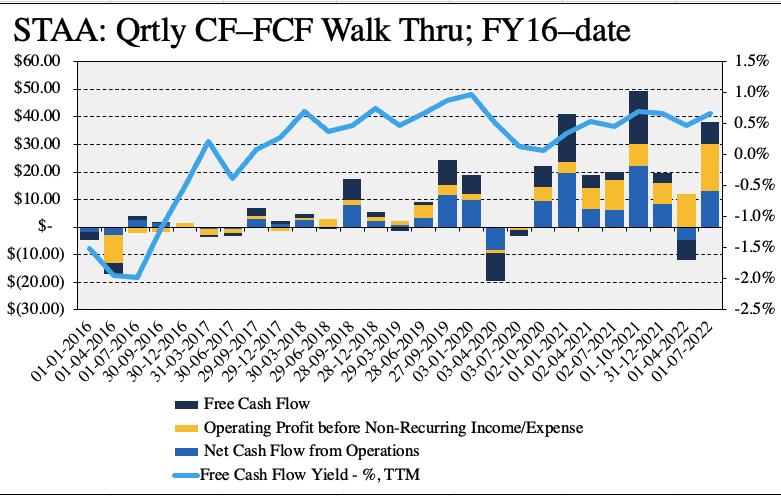
Note: All figures are in $mm or [ % ]. Operating income excludes non-recurring income items. Free cash flow calculated as [NOPAT – investments]. FCF yield calculated as a function of enterprise value. All calculations are using GAAP figures with no reconciliations. (Data: HB Insights, STAA SEC Filings)
As seen below, the capital budgeting of the FCF surplus has been well allocated by estimate. Whilst FCF trends have narrowed since FY21, the TTM return on invested capital (“ROIC”) has bifurcated to the upside and came in at 12.6% last quarter, comfortably ahead of the WACC hurdle of 8.14% by 1.5 turns. These trends are consistent with previous findings as well, and in terms of its existing investments/asset base, it generated a c.8% TTM return with an asset turnover of 0.78, meaning it generated $0.78 for every $1 invested over the TTM.
Exhibit 4.
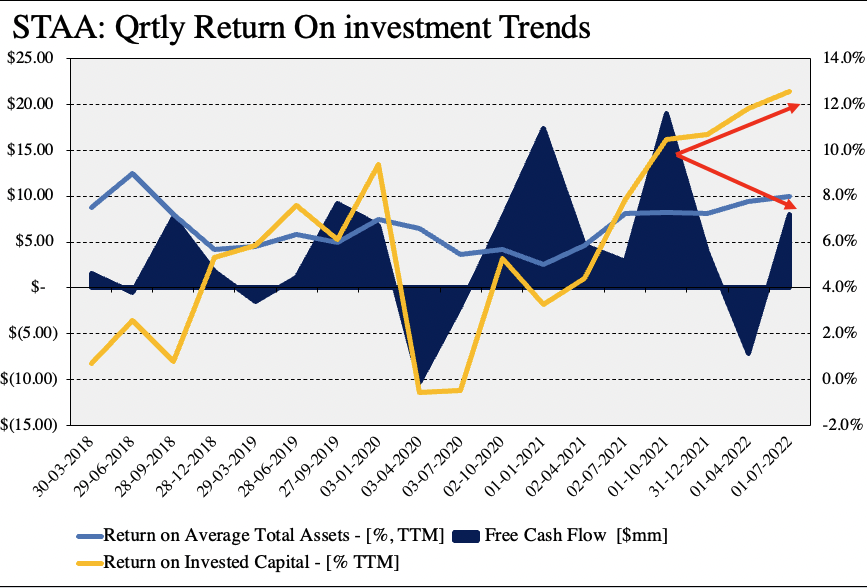
Note: All figures are in $mm or [%]. All figures are calculated using GAAP earnings with no reconciliations or capitalized expenditures. (Data: HB Insights, STAA SEC filings )
Valuation and conclusion
Management has pulled back Q3 revenue forecasts secondary to estimated FOREX impacts, now calling for $75mm at the upper end. It also projects $295mm in full-year turnover. We’re aligned with this in FY22 for STAA, as seen in Exhibit 4, calling for FCF conversion of $23.2mm and EPS of $0.70, stretching up to $45mm and $1.10 by FY23, respectively.
Exhibit 4. STAA forward estimates
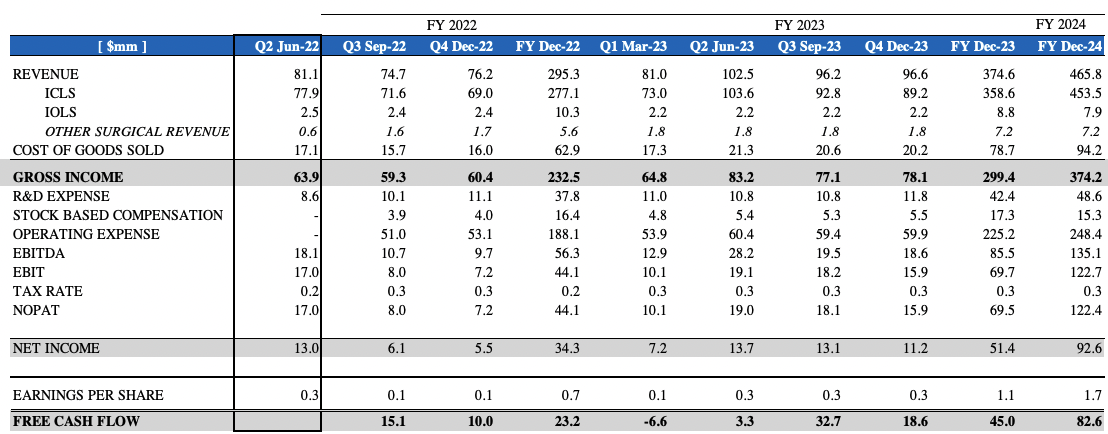
(Data: HB Insights Estimates)
Shares still trade at a substantial premium to GICS Industry peers, consistent with previous analyses. Since that report, price action has seen the valuation spread versus peers widen into the triple digits across all multiples tested in the analysis, as seen below.
Shares are trading at premium to peers at 15.8x book value and c.17.8x sales; however, the market has priced STAA at 77x forward earnings, suggesting it projects an above-sector result at the bottom line next for STAA next year. Based on the company’s Q2 earnings, its ROIC and factors discussed in previous analysis, I’ve made no change to the $98 price target prescribed earlier.
Exhibit 5. Multiples and comps
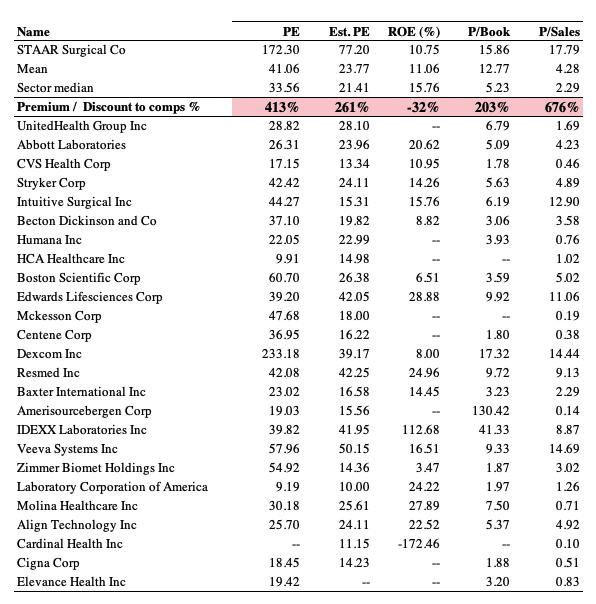
Data: HB Insights, Refinitiv Datastream
Net-net, I believe STAA is still a buy and that current longs can still nibble at the current multiples and receive another 15% upside to my price target of $98. I’ve made no change to this valuation from previous analyses and is firm on the posture that STAA commands a premium to its peers. With the culmination of these points in mind, STAA is a buy.
Be the first to comment