


SolStock
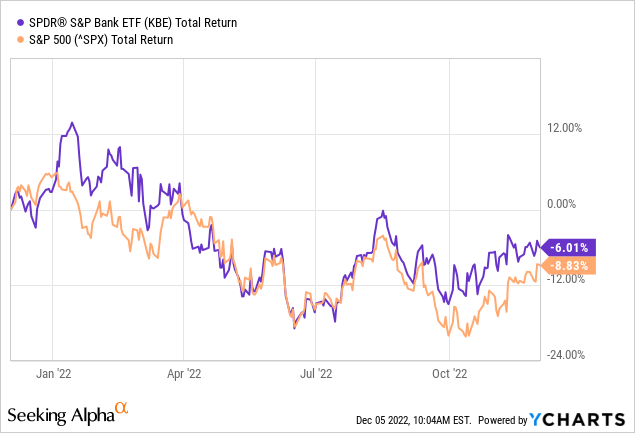
The State Street Global Advisors’ SPDR S&P Bank ETF (NYSEARCA:KBE) tracks the performance of the S&P Bank index, which includes asset management & custody banks, diversified banks, regional banks, diversified financial services, and thrifts and mortgage finance. As the year began, the banking sector was viewed as a primary beneficiary of the rising interest rate environment and the prospects for higher profits off the expanding net-interest margin (“NIM”). However, with total returns only 2.8% better than the S&P500 over the past year, the KBE ETF has been somewhat of a disappointment (see below). However, the KBE ETF is trading at a price-to-book of only 1.27x, has a forward P/E of only 7.6x, and has a TTM yield of 2.62%. That being the case, perhaps the KBE ETF appears to represent a compelling valuation for investors moving forward. Let’s take a closer look.
Investment Thesis
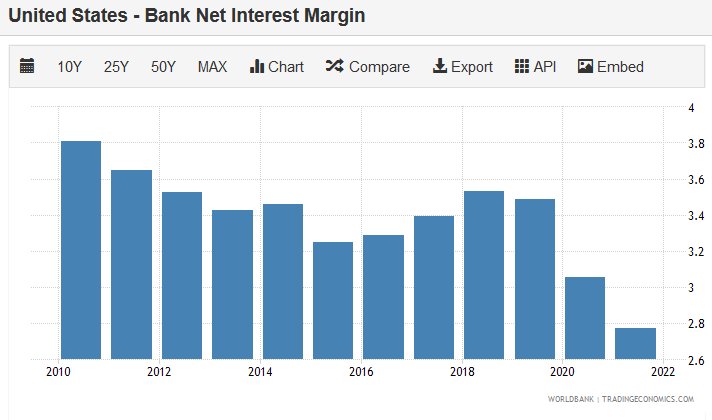
As mentioned previously, the rising interest rate environment was thought to be a generally bullish catalyst for the banking sector this year. It was assumed that the on-going recovery from COVID-19, combined with rising rates and strong consumer demand, would lift the net-interest rate margin from very-low levels on an historic basis:
TradingEconomics.com
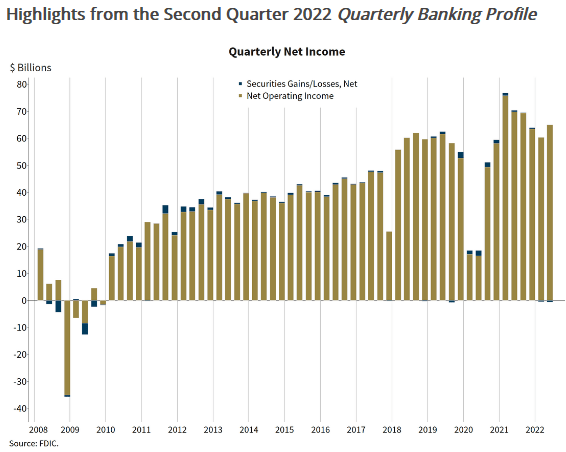
Indeed, that has been the case. The FDIC recently reported that the net-interest rate margin (“NIM”) improved to 2.80% in Q2FY22, an increase of 26 basis points from the previous quarter – the largest quarterly increase since 2010. Meanwhile, Q2 net profits for FDIC insured banks was $64.4 billion, relatively robust, but down on a yoy basis:
FDIC
Yet, as can be seen in the graphic above, and despite the yoy Q2 decrease, bank profits are arguably quite strong. That being the case, and considering the KBE ETF has returned a -6% over the past year, let’s take a closer look at KBE and see what is going on here.
Top-10 Holdings
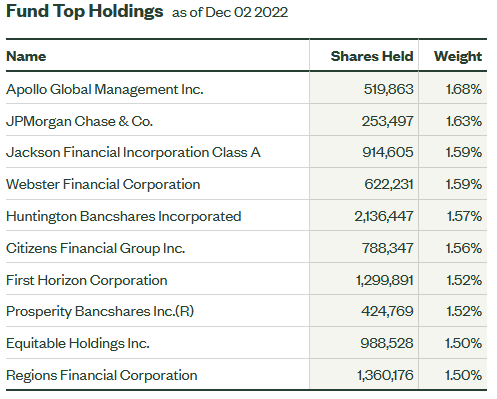
The top-10 holdings in the KBE are shown below and were taken directly from the KBE ETF homepage. The top-10 holdings equate to what I consider to be a relatively well-diversified 15.7% of the entire 99 company portfolio:
SSGA
The #1 holding is Apollo Global Management (APO) with a 1.7% weight. In early November APO delivered a strong quarterly report: Q3 non-GAAP EPS of $1.33/share was a 10-cent beat. Revenue of $2.98 billion was up a whopping +175.9% yoy. Total AUM of $523 billion was a new record, led by strong Asset Management and Retirement Services inflows of $34 billion. Yet APO stock is down 6.5% over the past year. APO currently yields 2.34%.
JPMorgan Chase (JPM) is the #2 holding with a 1.6% weight. JPM has been shellacked by the 2022 bear-market and is down 17.9% over the past 12 months. In October, JPM won a multi-year extension on its Disney (DIS) Visa Card program. Chase – which markets itself as the largest co-brand card issuer in the U.S. – said Disney and Visa (V) have worked together for almost 20 years on the card program. JPM also delivered a very strong Q3 earnings report: GAAP EPS of $3.12 beat by $0.23 while revenue of $32.72 billion (+10.4% Y/Y) beat by $840 million. However, gross investment banking revenue of $761 million was down 43% yoy while total AUM of $2.6 trillion was down 13%. JPM currently trades with a forward P/E of 11.7 and yields 3%.
Huntington Bancshares (HBAN) is the No. 5 holding with a 1.6% weight. HBAN provides commercial, consumer, and mortgage banking services. Its Consumer and Business Banking segment offers financial products and services: checking accounts, savings accounts, money market accounts, CDs, credit cards, and consumer and small business loans, as well as associated investment products. HBAN shares are relatively flat over the past year and yield an attractive 4% with a forward P/E of only 10.5x.
The No. 6 holding is Citizens Financial Group (CFG) with a 1.6% weight. CFG is down 16% this year and, as a result, is yielding 4% and has a forward P/E of only 8.7x. That despite a relatively strong Q3 EPS report – revenue of $2.17 billion was +31.5% yoy and was a $40 million top-line beat.
The top-10 holdings are rounded out by Regions Financial (RF). Region’s Q3 report was mixed – bottom line earnings came in $0.11/share below consensus estimates while revenue of $1.86 billion (+15.5% yoy) beat by $50 million. Perhaps more importantly, Regions reported NIM was strong – 3.53% – up 47 basis sequentially and 1.77% higher than Q3 of last year. However, non-GAAP adjusted items in Q3 included $179 million in professional, legal and regulatory fees associated with settlement with the Consumer Financial Protection Bureau regarding one type of overdraft fee the company discontinued in 2021. RF stock is flat over the past year and currently yields 3.45%.
Performance
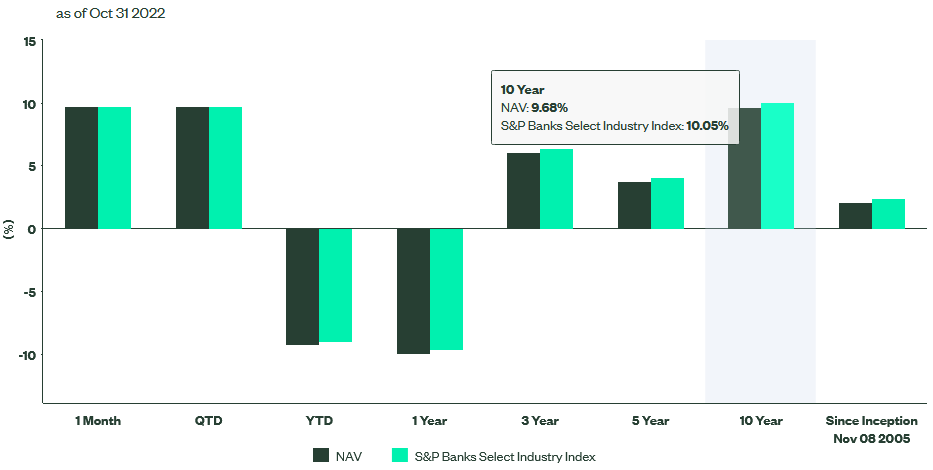
SSGA
As can be seen by the graphic above, while the near-term performance of the KBE ETF has been relatively poor, its 10-year average annual return of 9.7% is solid.
The graphic below compares the five-year total returns of the KBE ETF with some of its peers, including the First Trust Community Bank ETF (QABA), the SPDR Select Financial ETF (XLF), the SPRD S&P Regional Banking ETF (KRE), as well as the S&P 500:
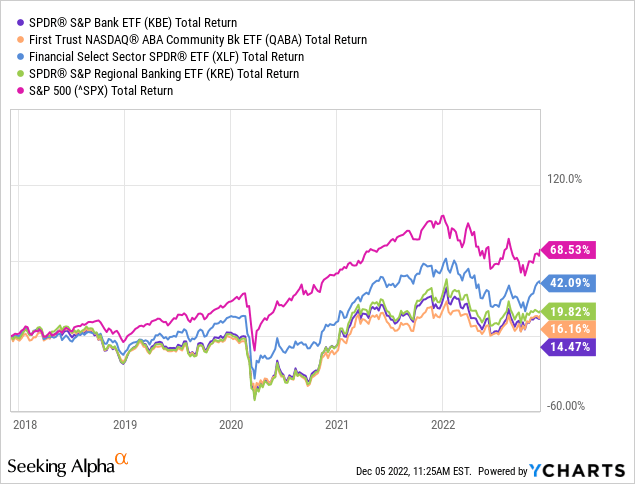
As you can see, the KBE ETF is the worst performer of the chosen group, significantly lagging not only the S&P500 but its banking peer-group as well. Specifically, the XLF ETF is the clear leader of the banking ETFs by a long-shot. Note the XLF ETF is over-weight larger financial institutions like:
| Berkshire Hathaway Inc. Class B | 14.42% |
| JPMorgan Chase & Co. | 10.10% |
| Bank of America Corp | 6.46% |
| Wells Fargo & Company | 4.50% |
Risks
The KBE ETF generally holds smaller and regional banking concerns as compared to the XLF ETF (for example). That being the case, investors might have the impression that these smaller banks will suffer a more out-sized impact from a potential 2023 recession and/or from loan delinquencies. However, that may be already priced in to a significant degree. I say that because the valuation level of the KBE looks quite attractive:
- Price-to-Book: 1.27x (S&P 500 P/B = 4.01x)
- TTM P/E Ratio: 9.76x (S&P 500 P/E = 20.95x).
- TTM Yield: 2.62% (S&P 500 Yield = 1.62%).
However you look at those comparisons, KBE is arguably trading at a significant discount to the broad S&P 500, perhaps much so than is rational given the recent EPS reports and significant rise in NIM that bodes well for the future.
In addition, the U.S. housing market it taken it on the chin in the rising interest rate environment: October existing home sales dropped to the lowest rate since December 2011 (with the exception of a brief fall at the beginning of the pandemic):
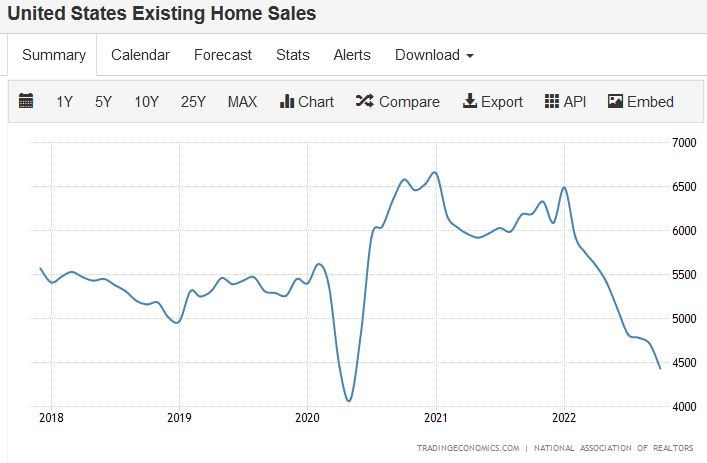
TradingEconomics.com
Summary And Conclusions
Given the valuation of the Financial Sector relative to the S&P 500, as well as the downside yield protection provided by the sector and the relatively strong and still rising NIM, the sector looks relatively attractive to me. That being the case, I’ll rate KBE a HOLD.
However, the KBE ETF is not the right way to play the rising interest rate trend and the present economic cycle. KBE’s expense ratio of 0.35% is way too high in my opinion, and compares poorly with the XLF ETF (only 0.10%). Not to mention that the XLF is running rings around KBE in terms of total returns to shareholders. In addition, I like the portfolio of XLF much better given the current macro-environment – especially its 14.4% weight in Berkshire Hathaway (BRK.B).
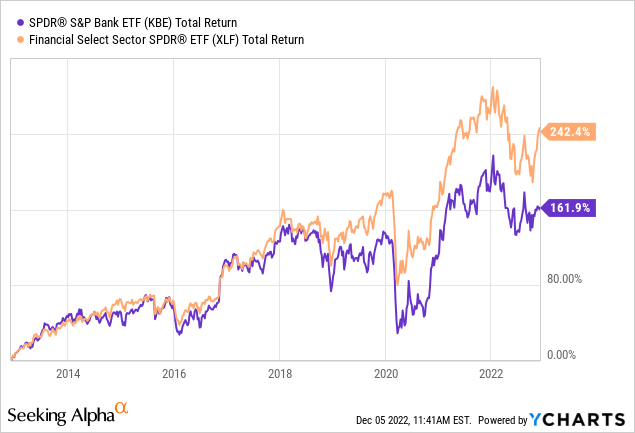
I’ll end with a 10-year total returns comparison of KBE vs. the XLF:
Be the first to comment