

Justin Sullivan
Investment thesis
The homebuilding sector is a cyclical sector with no growth in the long-term average Housing Starts over the past 65 years. While there could be pent-up demand, we should not ignore the 65 years of history.
The sector seems to be at its current peak and we should see a downtrend in Housing Starts in the near future. When this happens, I would see a downtrend in KB Home (NYSE:KBH) performance. This is because there is a 0.96 correlation between the Housing Starts and KBH revenue.
I estimated KBH cyclical EPS to be USD 1. This is much lower than its 2021 EPS of USD 6. Even KBH’s EPV at USD 16 per share does not provide any margin of safety. As such I do not see the current share price as sustainable. Together with its poor fundamentals over the cycle, this is a candidate for shorting.
Background
In June 2022, I carried out a fundamental analysis of 11 home builders to identify a trading pair. Refer to the SA article “Meritage Homes And KB Home: Fundamental Trading Opportunities“. The home building industry is cyclical and as such my analyses were based on the performance over the cycle.
I recommended shorting KBH as it was the one with the worst fundamentals and no margin of safety. I had valued KBH on an EPV of USD 16 per share compared to its price then of USD 28 per share (as of 23 Jun 2022).
One reader had a different view commenting:
…KBH will be earning more profit per share than my purchase price in 10 years… Not a chance in hell they aren’t making $20 a share in 2032, not a chance… Cyclical be damned with 15 years of underinvestment in housing…
This is my reply to the comment. I considered 3 questions:
- Will KBH’s performance decline in the near term? This will support my short recommendation.
- Does KBH have strong fundamentals over the cycle? My original analysis was based on comparing KBH with the 10 other panel companies. Would the picture be different in an absolute sense?
- Will you make money if you had gone in at USD 28 per share? I am looking at this from a value investor’s perspective.
Cyclical sector
The chart below shows the Housing Starts over the past 65 years. You can see that this is a cyclical sector with no growth in the long-term average annual Housing Starts of about 1.5 million units.
Chart 1: US Housing Starts (Trading Economics)
The current cycle seems to have started around 2005 and there is anecdotal evidence to suggest that we are at the peak of the current cycle.
“Existing home sales in the US declined by 3.4% to a seasonally adjusted annual rate of 5.41 million in May of 2022, the lowest since June of 2020… Sales went down for a fourth consecutive month… Further sales declines should be expected in the upcoming months given housing affordability challenges…” National Association of Realtors
“Economists polled by Reuters had forecast sales would decrease to a rate of 5.40 million units. They estimate that a housing market downturn would need sales to drop to between a rate of 4.0 million to 4.5 million.” Reuters
“The government’s report showed single-family housing starts declined 9.2% to an annualized 1.05 million rate, the slowest since 2020. Construction of multifamily dwellings plunged 23.7% to a 498,000 rate, the weakest since November.” June 2022 Bloomberg
Readers may cite pent-up demand and underinvestment to support continued growth in Housing Starts despite the above. But this is not the full story.
According to Investopedia, there are 4 main factors that drive the real estate market. These are demographics, interest rates, economic cycle, and government policies. However, the relationship between these factors and the real estate market is not so clear-cut.
Given these, I would not bet against the 65 years of Housing Starts’ history. While there may be short-term growth so that the Housing Starts overshoot the current level of about 1.5 million units, there will be an eventual downtrend. I do not expect any growth in the long-term average annual Housing Starts.
Housing Starts vs KBH Revenue
To illustrate the relationship between KBH revenue and Housing Starts, I computed the 2005 to 2021 indices for both metrics. I used the 2005 values as the base of 1.00. The values for the subsequent years were derived by dividing the value for the year by the respective 2005 values.
Chart 2 shows how KBH’s revenue index trended compared to the Housing Stars index from 2005 to 2021. There is a 0.96 correlation. What this implies is that as the Housing Starts begin to trend downwards, we can expect KBH revenue to do likewise.
Chart 2: Housing Starts vs KBH Revenue (Author)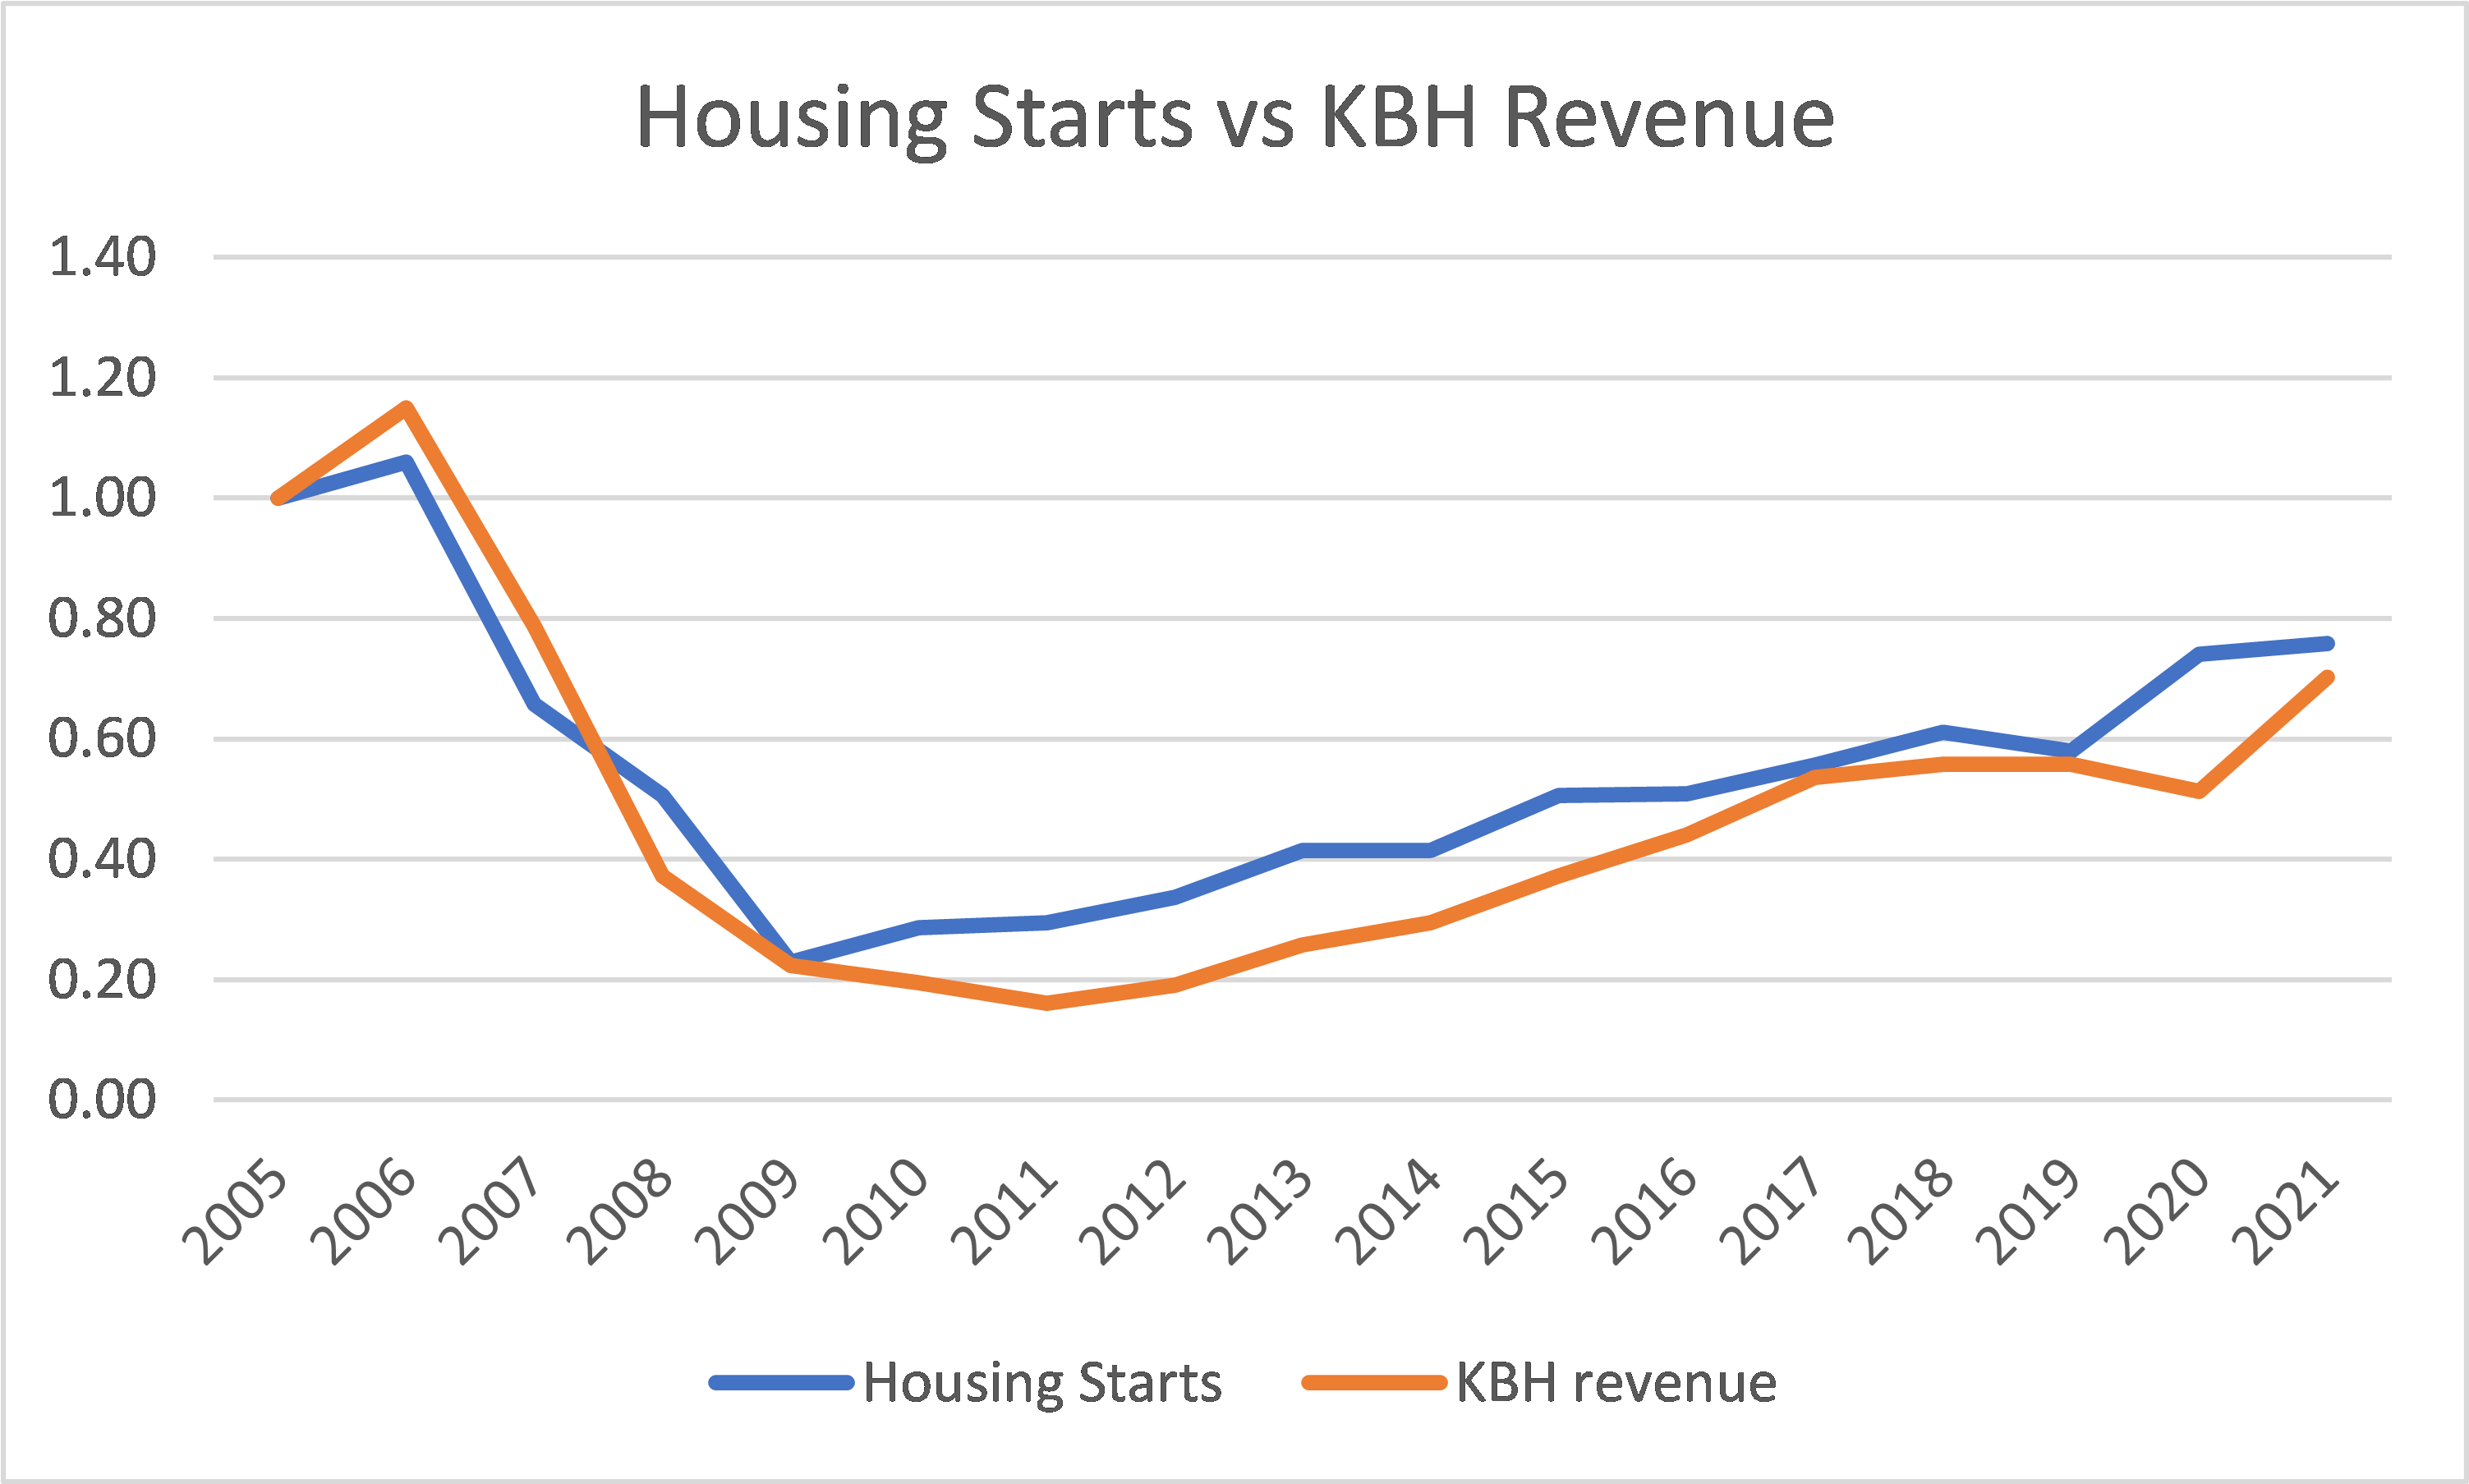
Looking at the chart, you can see that there is not much of a time lag between them, especially during the declining stage. In other words, if the Housing Starts have started to decline, we should see the impact on KBH’s revenue within less than a year.
KBH Performance
Chart 3 shows 3 key performance metrics for KBH over the current cycle. You can see that all 3 metrics generally have performed worse than their respective 2005 values.
- The spike in net income in 2014 was due to a USD 825 million reversal of tax asset valuation. Without this reversal, the 2014 net income would only be about 0.10 index level.
- The significant drop in net income in 2007 and 2008 was due to asset write-down. Without these, there would still be losses but around the -0.30 and -0.55 index levels respectively.
The chart illustrates clearly that KBH’s current performance is lower than that of 2005. In other words, there is no growth.
Chart 3: Performance Index (Author)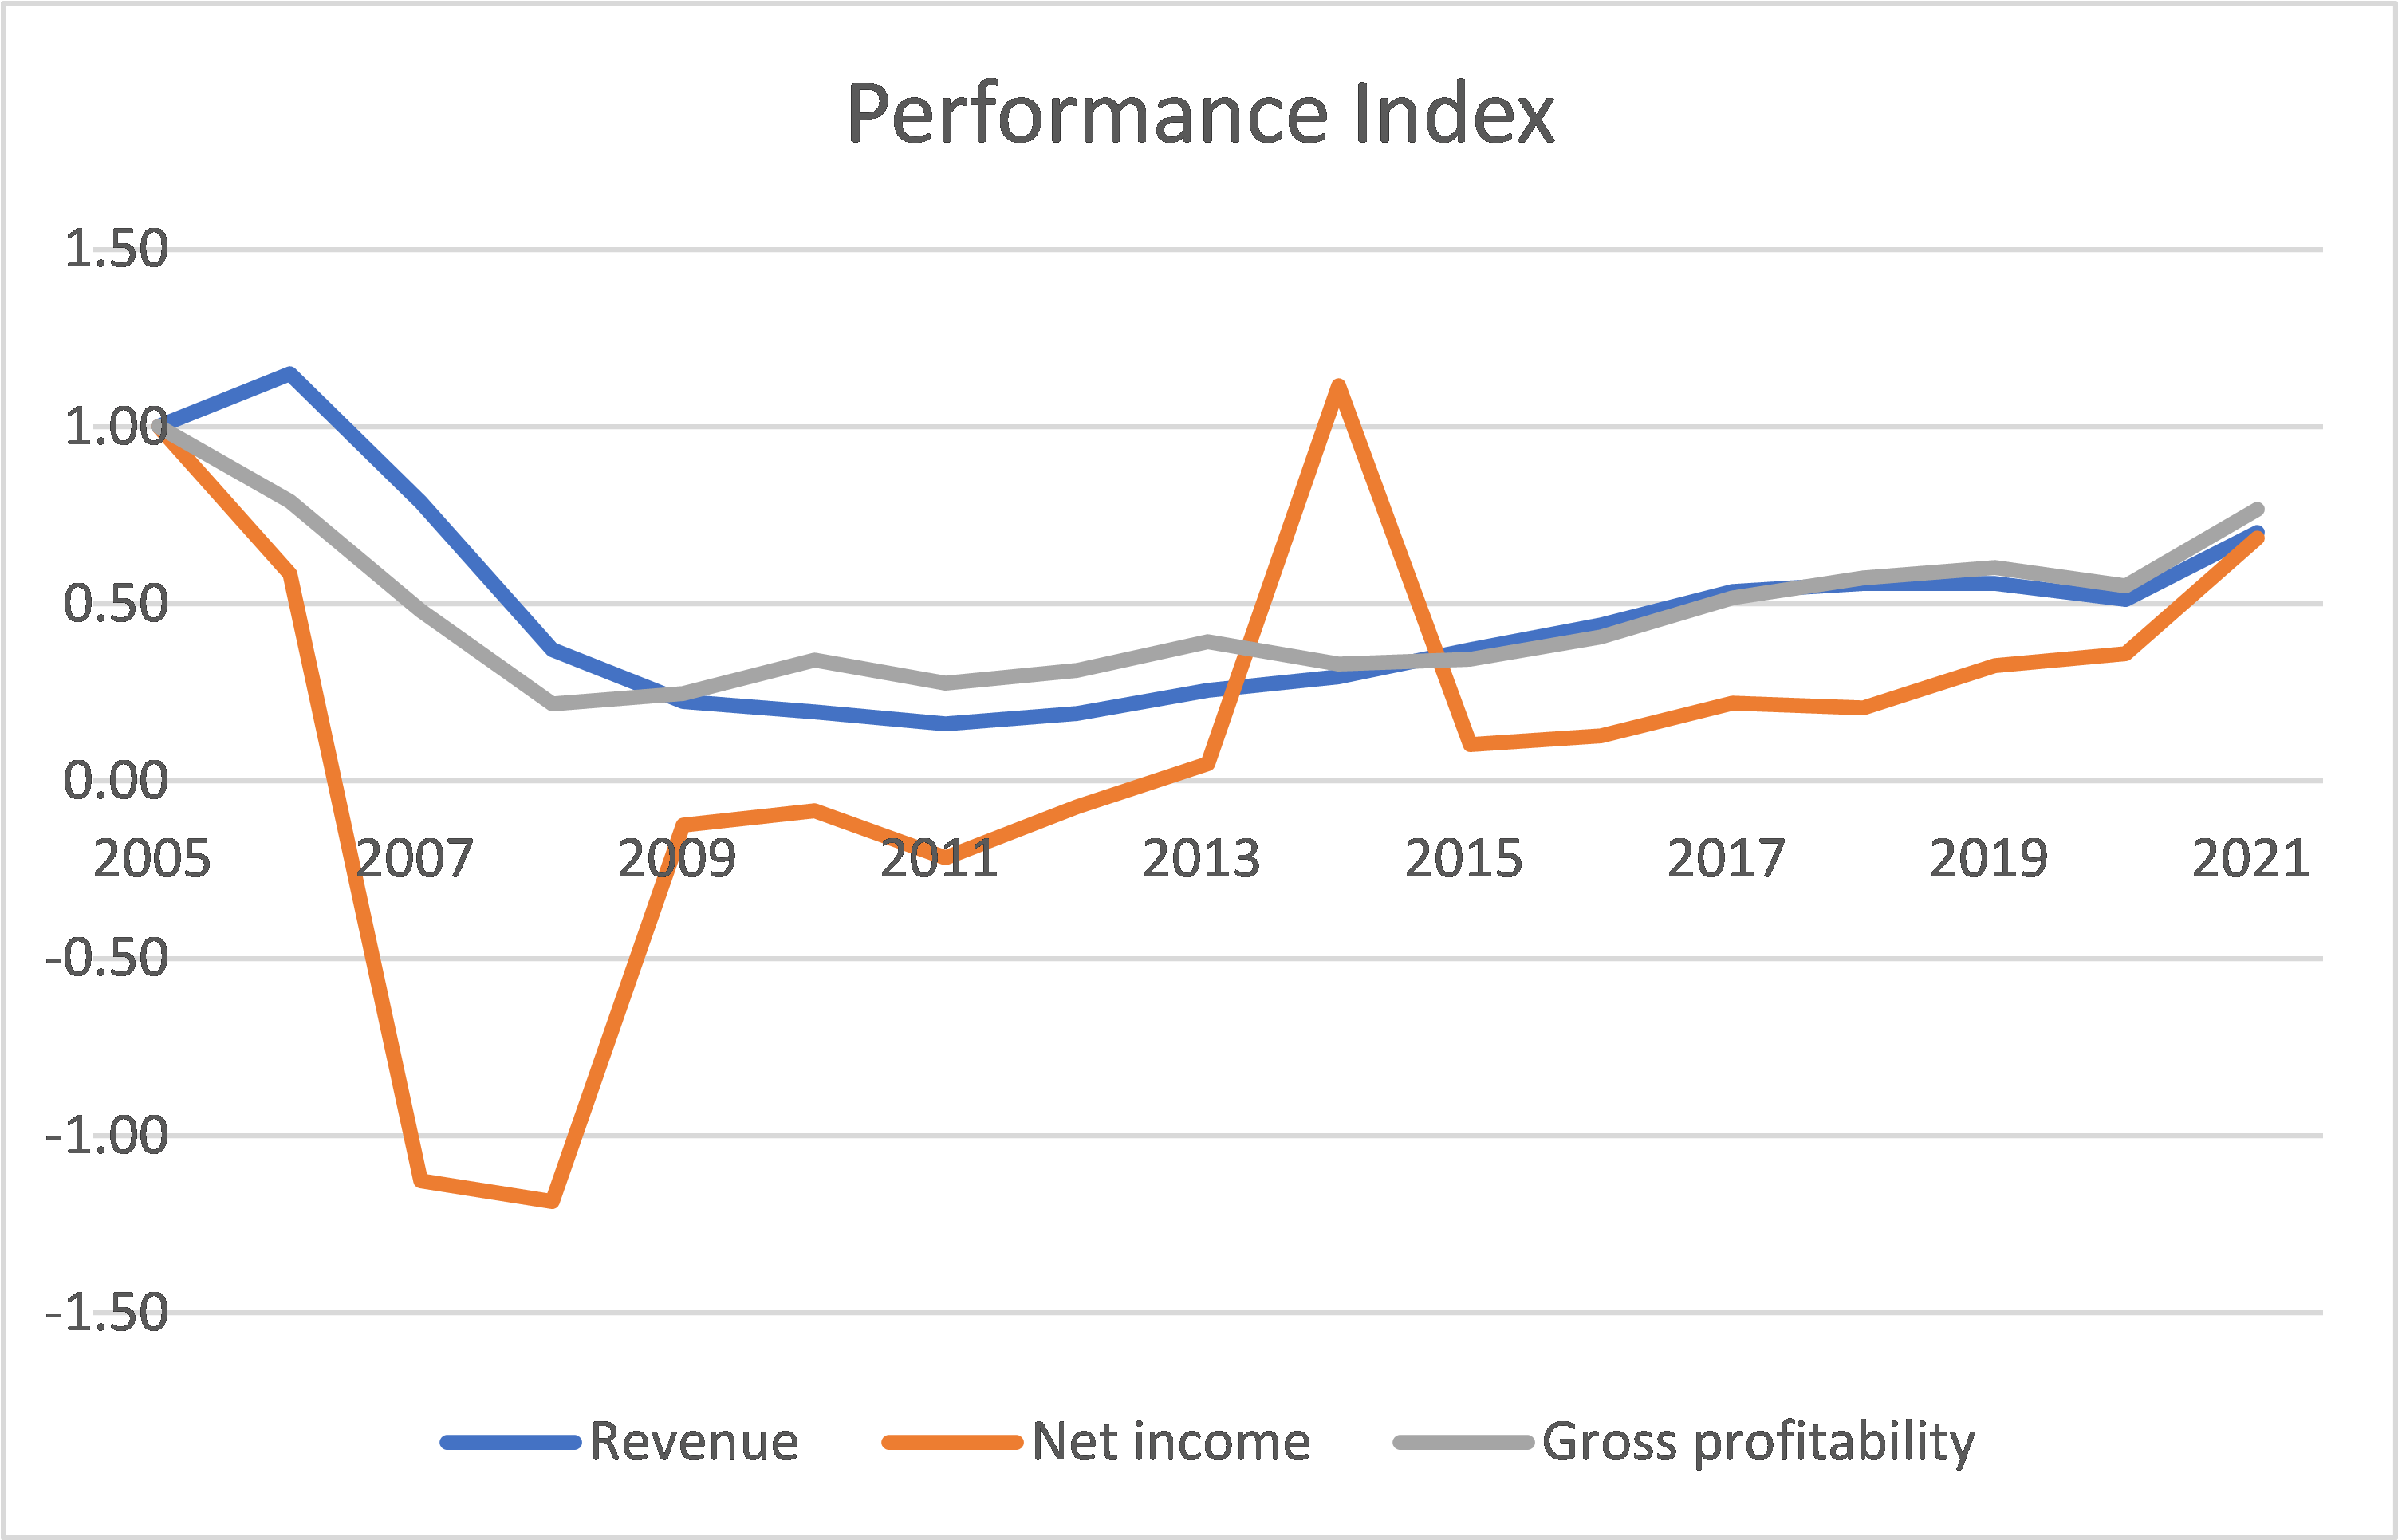
Notes to Chart 3
1) Gross profitability = gross profits/total assets. According to Professor Novy-Max, this has the same power as Price Book in explaining stock returns.
2) The indices were computed by dividing the values in each year by their respective values in 2005.
If you consider the average performance over the 2005 to 2021 cycle, we have the following picture:
- The average annual net income was USD 95 million. Given its average common equity of USD 1,657 million, this equals a 5.7 % return.
- The average ROE, based on the ROE of each year, was actually – 4%.
- KBH generated an average of USD 142 million per year of cash flow from operations. This is about an 8.6 % return on the average common equity.
No doubt these average performances were impacted by the asset write-downs. I would argue that these write-downs were due to the declining demand. Since I am looking at performances over the cycle, I would consider these as part and parcel of KBH operations.
I would not consider these strong fundamentals. I also carried out a DuPont analysis of the ROE trends as shown in Chart 4.
- The ROE for most of the period is lower than that achieved in 2005. The 2021 ROE is touching the 2005 level.
- You can see that the changes in the profit margins accounted for most of the changes in the ROE.
Chart 4: DuPont Analysis (Author)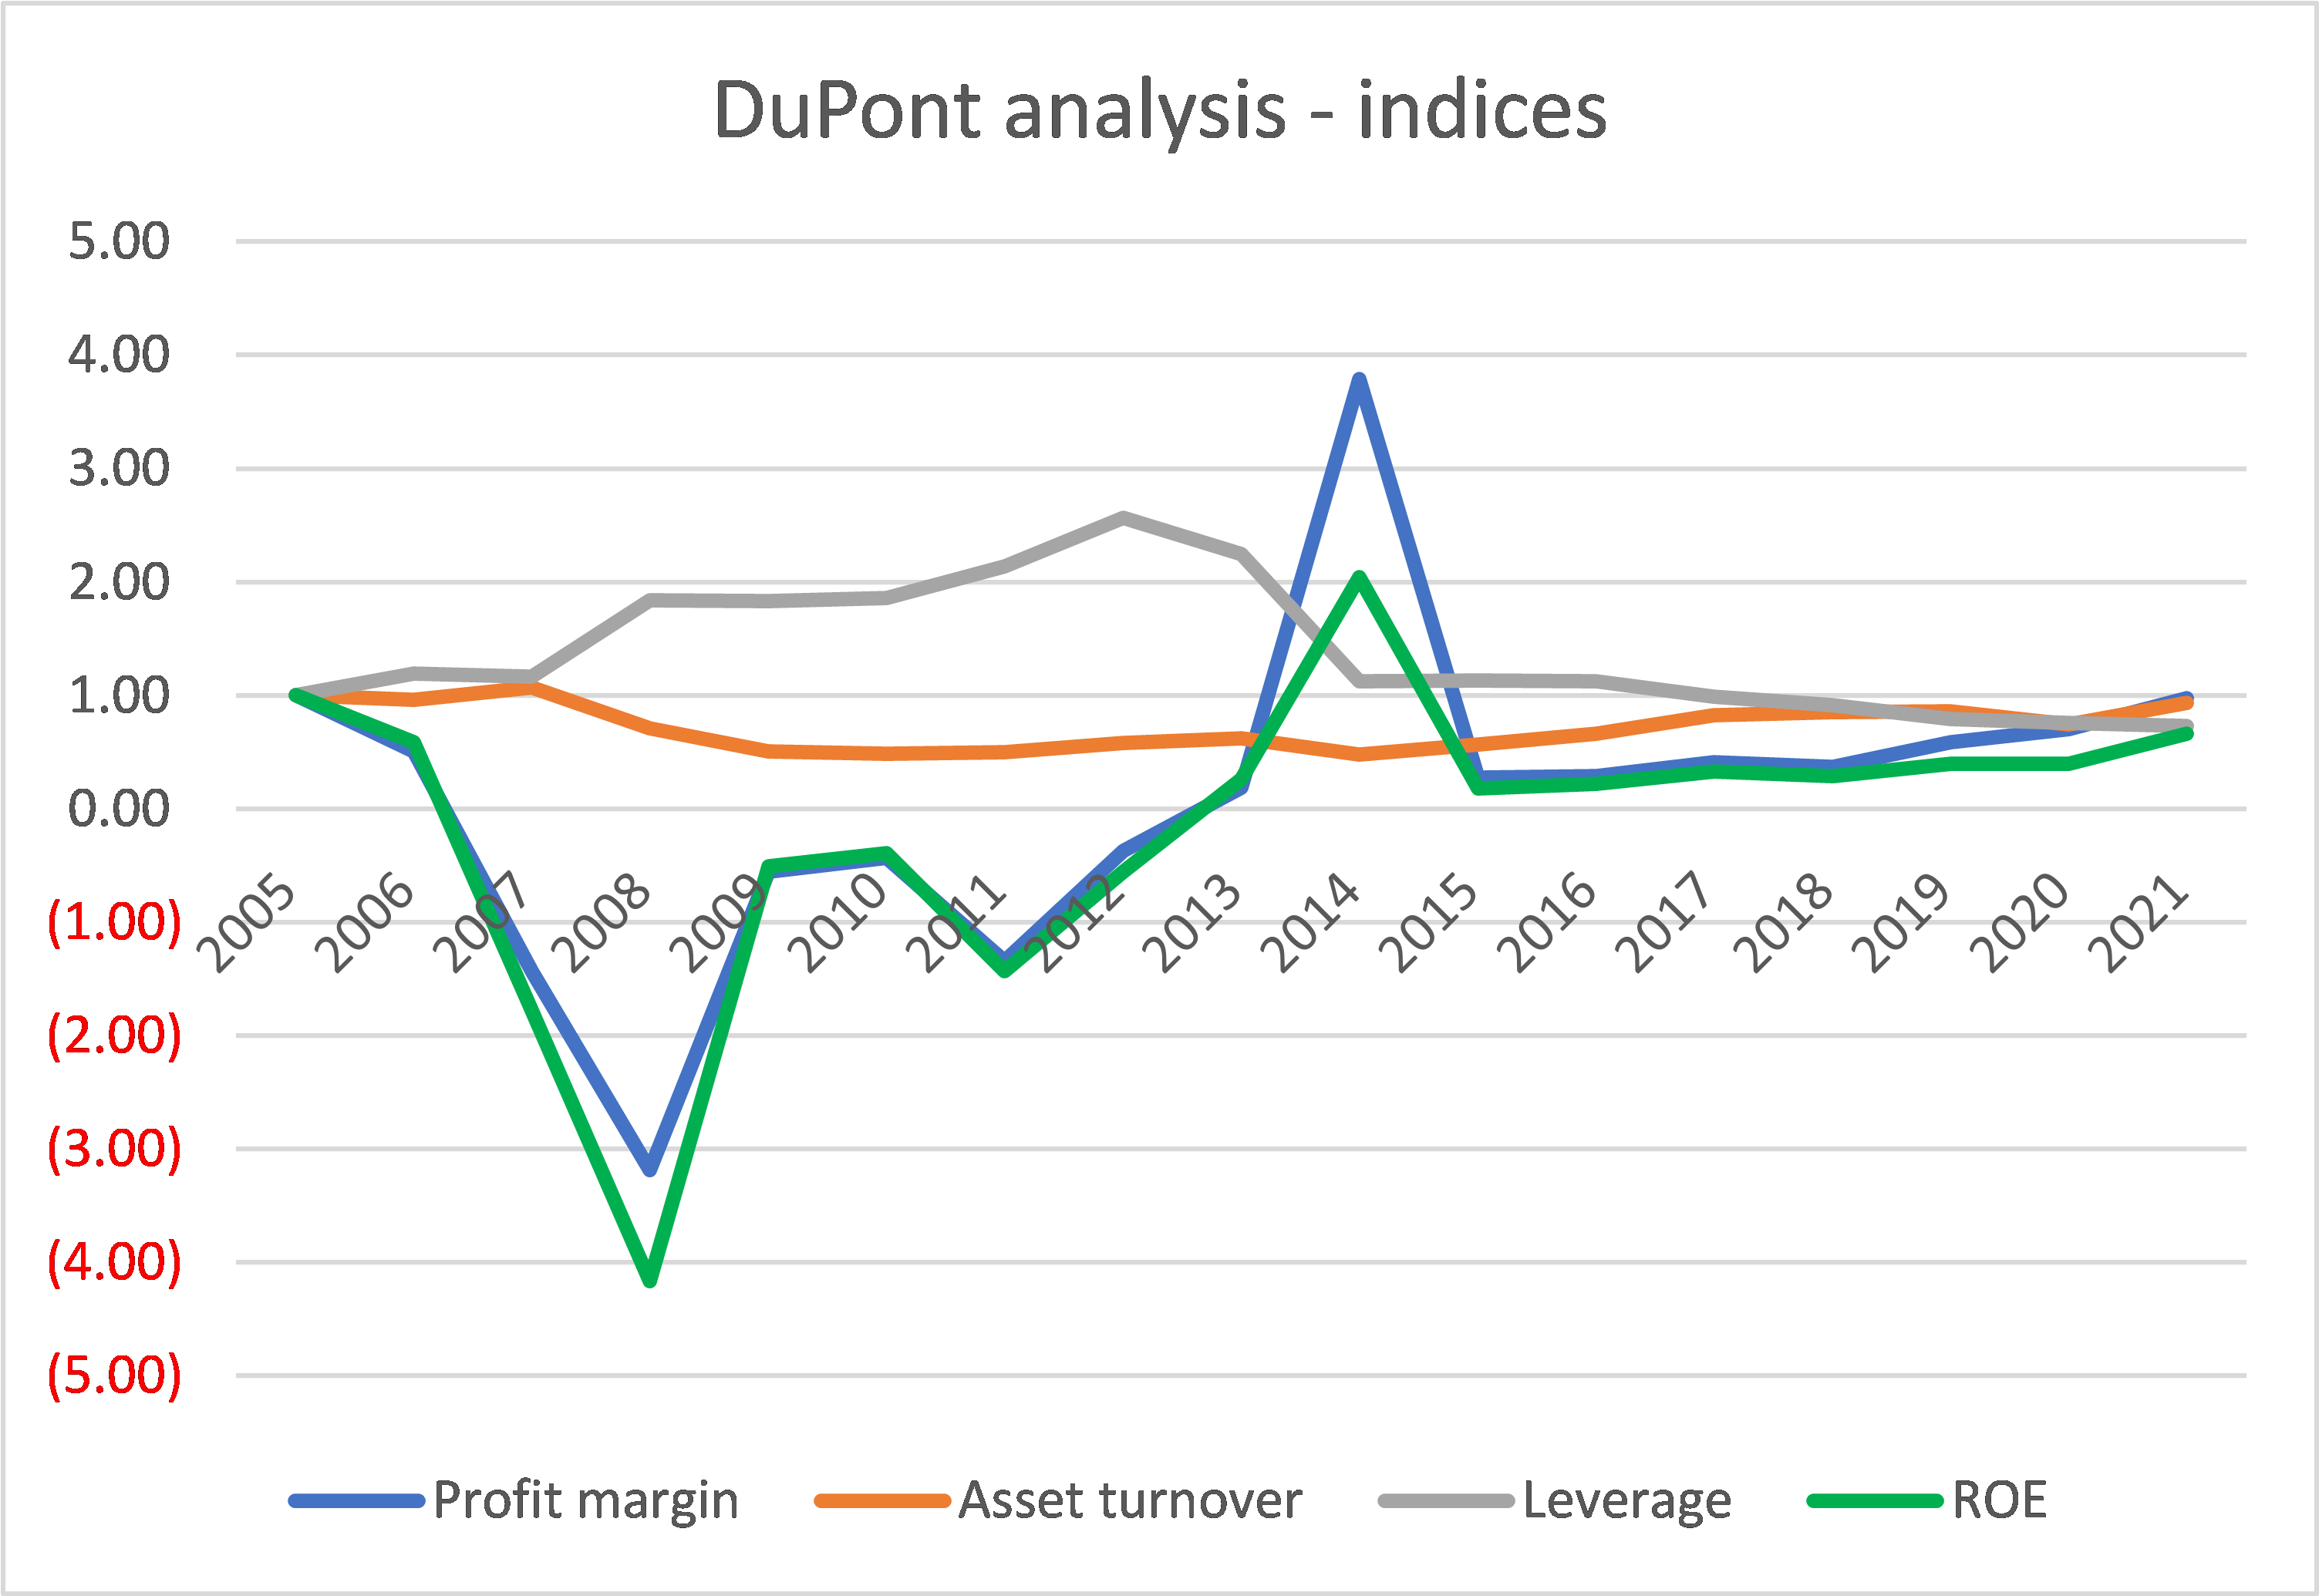
Over the current cycle, KBH has benefited from a number of tailwinds:
- The longer periods of growth in Housing Starts compared to the periods of declining Housing Starts.
- Increases in house prices at a rate faster than the increase in construction costs. This is illustrated in Chart 5 which shows that the Housing Price Index had remained above the Construction Cost Index.
Chart 5: Housing metrics (Author)
Notes to Chart 5:
Refer to the SA article “NVR: A Good Jockey On A Strong Horse Riding Into A High Inflation Environment” for details on the construction of the chart.
As can be seen from Chart 5, the Housing Starts began to decline in 2005/06. There were some time lags before we see corresponding declines in the Housing Price Index and Construction Cost Index. The time lag could cause problems for KBH’s profitability.
- The reduction in Housing Starts led to lower house prices.
- But construction costs were still increasing.
This may be one reason why KBH’s net income turned to net losses so quickly (in 2007) when the Housing Starts decline began. If history repeats itself, we can expect the current profits quickly turn to losses.
Are there any positives? Well, KBH has improved its debt position over the cycle as shown in Chart 6. But you can see the Debt-Equity levels building up when the Housing Starts started to decline in 2006. This build-up continued into the first few years of the Housing Starts rise. If history repeats itself, we could see another build-up of debt over the next few years.
Will you make money if you had gone in at USD 28 per share?
I had in my previous SA article estimated the EPV of KBH based on its performance over the cycle at USD 16 per share.
From a value investing perspective, if you had gone in at USD 28 per share, it is time to cut loss and get out.
You may argue that KBH achieved an EPS of USD 6 in 2021. Why can’t the market price be higher than USD 28 per share? I quote the following from Professor Damodaran.
Cyclical and commodity companies share a common feature, insofar as their value is often more dependent on the movement of a macro variable (the commodity price or the growth in the underlying economy) than it is on firm specific characteristics… Since both commodity prices and economies move in cycles, the biggest problem we face in valuing companies tied to either is that the earnings and cash flows reported in the most recent year are a function of where we are in the cycle, and extrapolating those numbers into the future can result in serious misvaluations.
I had earlier estimated the average net income over the cycle as USD 95 million. This is equal to a cyclical EPS of USD 1 per share. To make money from investing in KBH at USD 28 per share with this EPS, the market has to behave irrationally.
But this is getting into crowd behaviour and market sentiments. I will leave this to others who are better qualified to write about this.
My point is that from a fundamental analysis perspective, there is no margin of safety to go in at the current market price.
Conclusion
The core of my thesis is that the home building sector is cyclical. If you accept this, then from a fundamental perspective, you should be looking at KBH’s performance and valuation over the cycle.
- KBH’s performance over the cycle is nothing to shout about. Revenue, net income, and gross profitability today are lower than those in 2005. There was no growth.
- KBH is overpriced. There is no margin of safety based on the EPV. Based on a cyclical EPS of USD 1.00 per share, the current price is equal to a high PE multiple of 28.
The analysis supports my earlier pair-trading recommendation to short KBH. But this is not without its risks. I see the following 3 key risks.
It takes time for the declining performance due to the cyclical effects to be apparent. In mitigation, we have the following as short-term catalysts:
- High inflation that reduces disposal income.
- Rising interest rates leading to higher mortgages.
- News about a recession as short-term catalysts.
Secondly, for the price to decline, the number of investors who believe in the cyclical nature must outnumber those who think otherwise. Looking at the many comments to my various Seeking Alpha articles on home builders, I must admit the tipping point is not there yet.
Finally, the time lag between the decline in Housing Starts and the performance of KBH follows historical patterns. If history does not repeat itself, you may have to wait for a longer time for the short to play out. Do you have the holding power?
Be the first to comment