

Michael Nagle
Thesis
In this article, I will conduct a comparison among JPMorgan Chase & Co. (JPM), Bank of America Corporation (BAC), and Wells Fargo & Company (WFC). The valuation of the three largest U.S. banks reveals that JPMorgan is poised to outperform the other two, boasting a fair price per share of approximately $314.74. This figure represents an 85% increase from the current stock price of $170. The model suggests a future price for JPMorgan at $545.20, translating into an impressive annual return of 44.1%.
Conversely, the other two banks, based on their respective valuations, are deemed fairly valued. Bank of America could potentially yield annual returns of 20.6%, while Wells Fargo might deliver 18.3%. Given these considerations, I advocate for a “strong buy” rating on JPMorgan, while suggesting a “buy” for the others.
Overview
Business
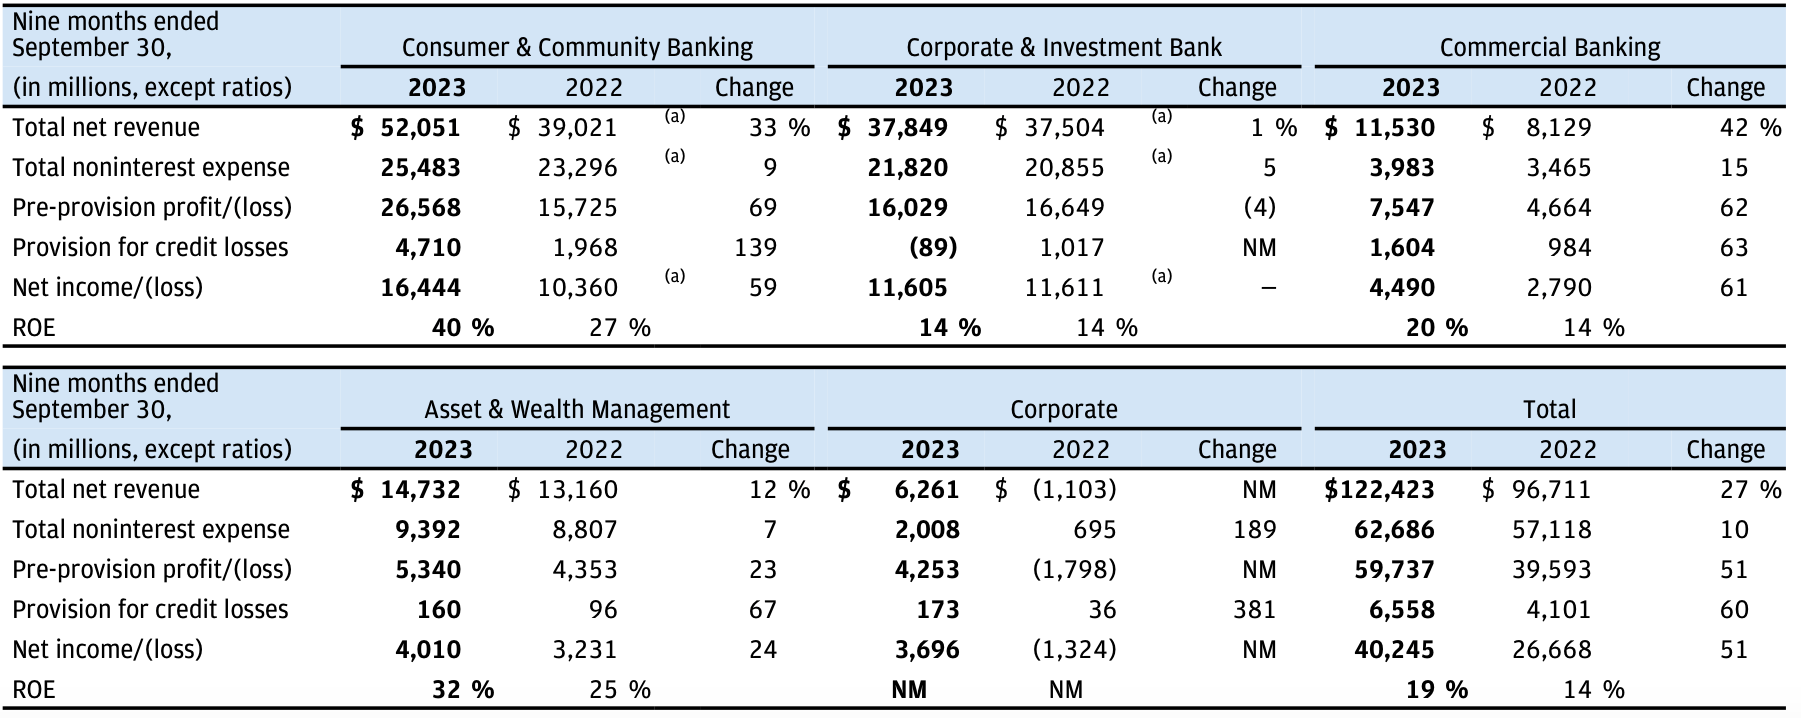
As evident from the table below, JPMorgan emerges as the most reliant on Consumer Banking, contributing 40.88% of its net income from these operations. In contrast, BofA and Wells Fargo exhibit a greater dependence on Corporate & Investment Banking, with percentages of 32.91% and 31.49%, respectively. Wells Fargo stands out as the most dependent on Commercial Banking, deriving 23.48% of its net income from this sector. Furthermore, in the realm of Asset & Wealth Management, BofA takes the lead, accounting for 13.24% of its net income.
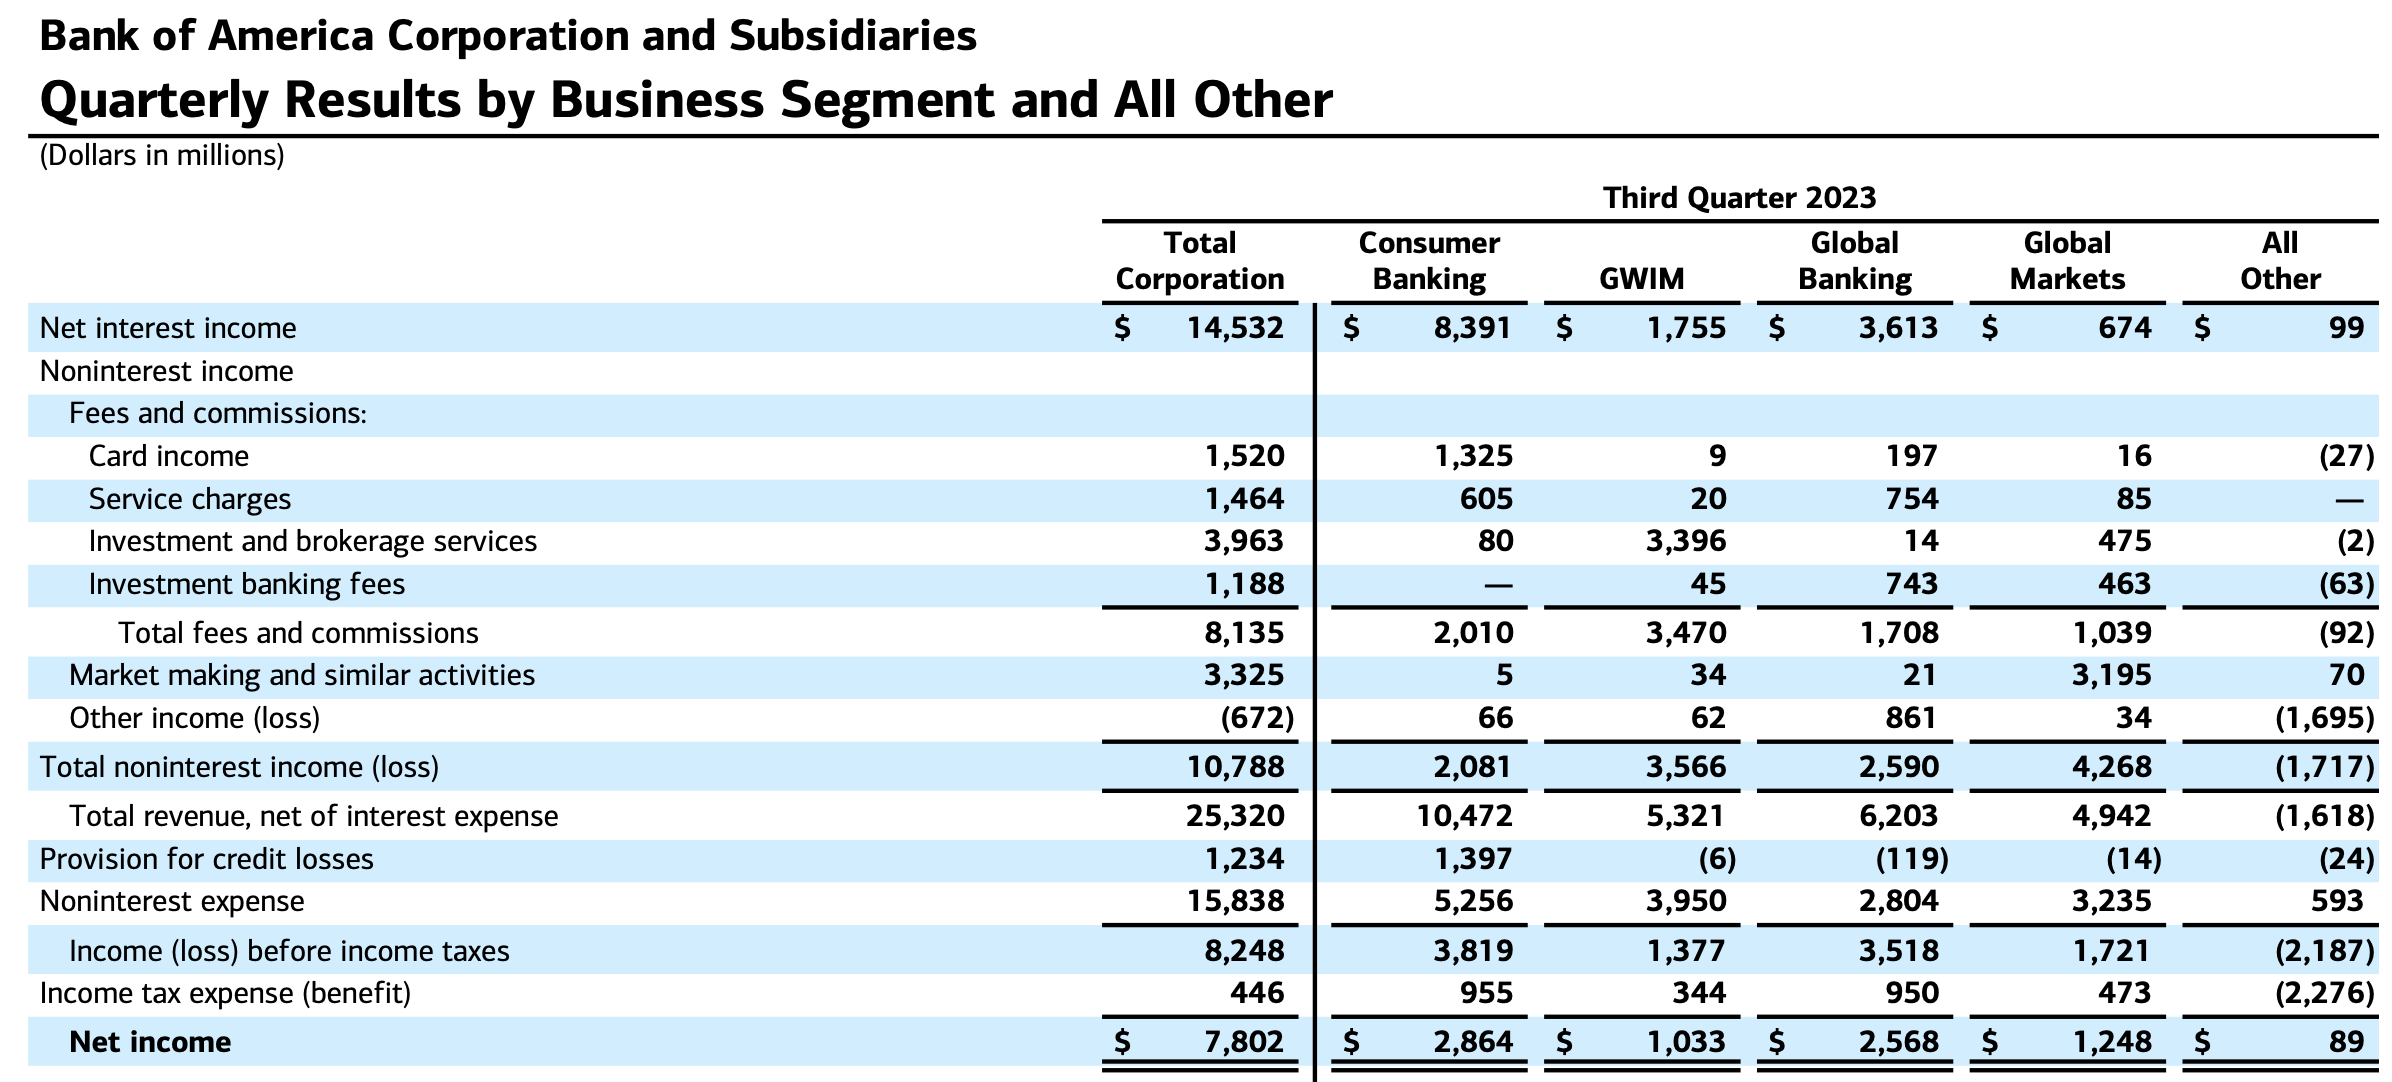
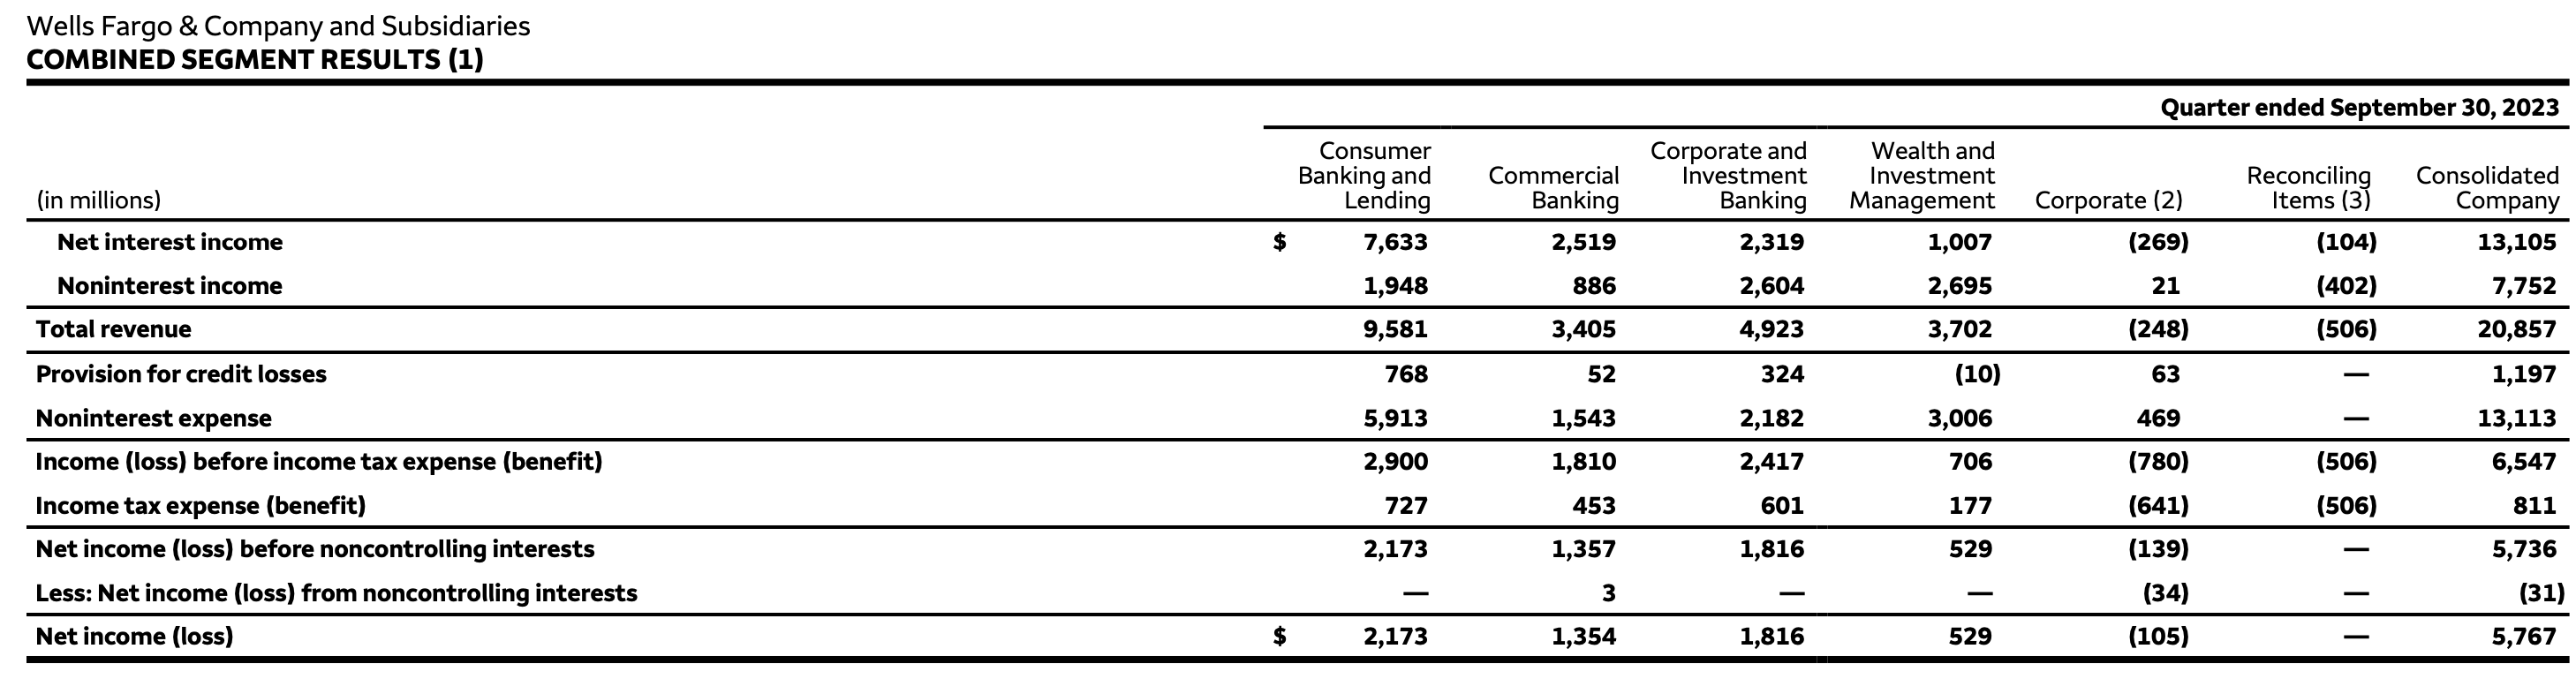
If you are wondering why JPMorgan’s base net income surpasses that of the other two, it’s because JPM’s base net income reflects the 9-month ended period, as disclosed in its Q3 2023 earnings. In contrast, the figures for the other two banks represent only the three months ended.
Author’s Calculations BofA Q3 2023 Earnings Release Wells Fargo Q3 2023 Earnings Release JPMorgan Q3 2023 Earnings Release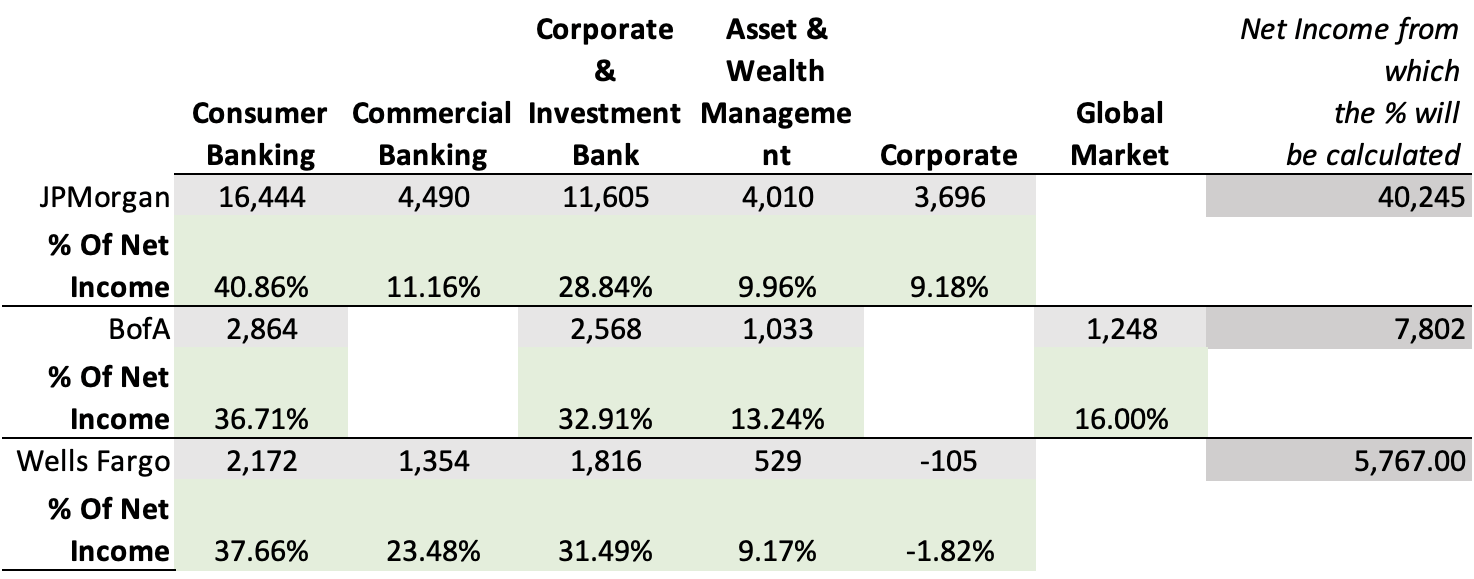
Market
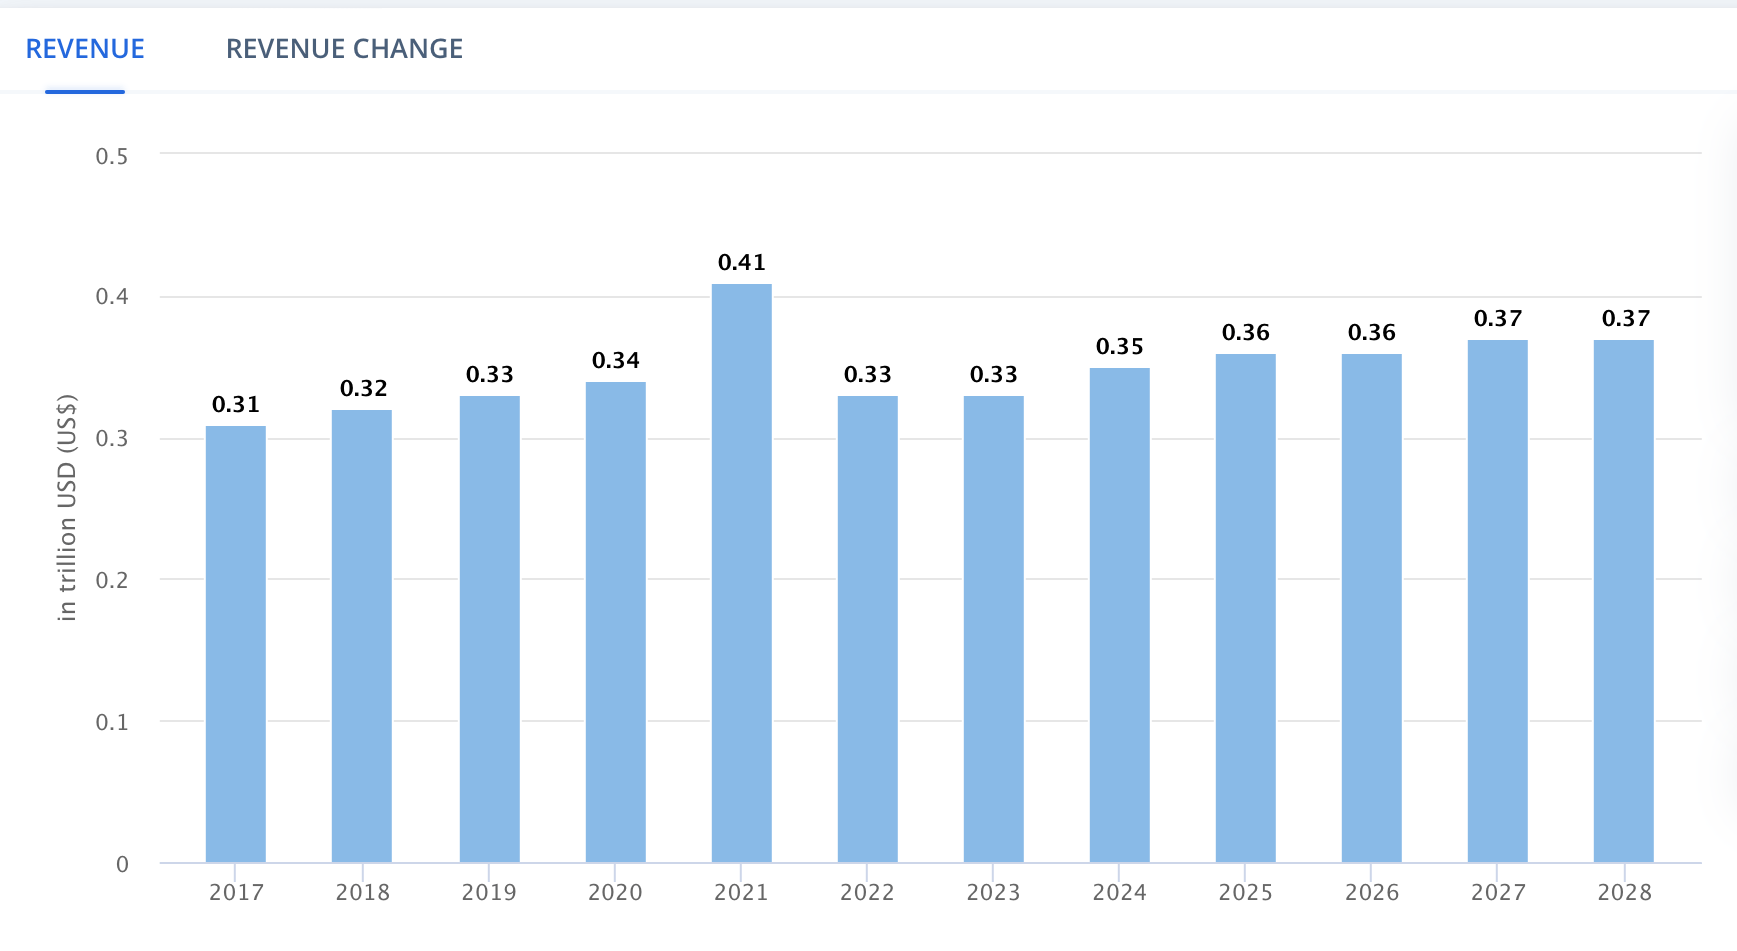
The US traditional banking market, comprising commercial banking and retail banking, is anticipated to experience a net interest income growth of 1.44% from 2024 to 2028. Simultaneously, global investment banking revenue is projected to grow at a CAGR of 1.40% during the same period. These sectors represent the slowest-growing markets within the banking industry, largely attributed to the maturity of the finance industry and minimal differentiation factors.
Despite the overall sluggish growth in these segments, JPMorgan holds a strategic advantage. The bank stands out by offering some of the most popular credit cards, including the Chase Sapphire Reserve, the Business Ink, and the Chase Freedom.
Net Interest Income of the U.S. Traditional Banking Market (Statista) Revenue of the Worldwide Investment Banking market (Statista)
Turning to other sectors, Worldwide Asset Management is poised for a more respectable growth rate of 4.40% from 2022 to 2027. However, the most dynamic market related to the three banks is Global Wealth Management, projected to achieve an impressive 5.90% revenue growth from 2024 to 2027. This signifies a more robust growth potential in these areas compared to the relatively slower-growing traditional and investment banking segments.
Revenue of the Global Asset Management market (Statista)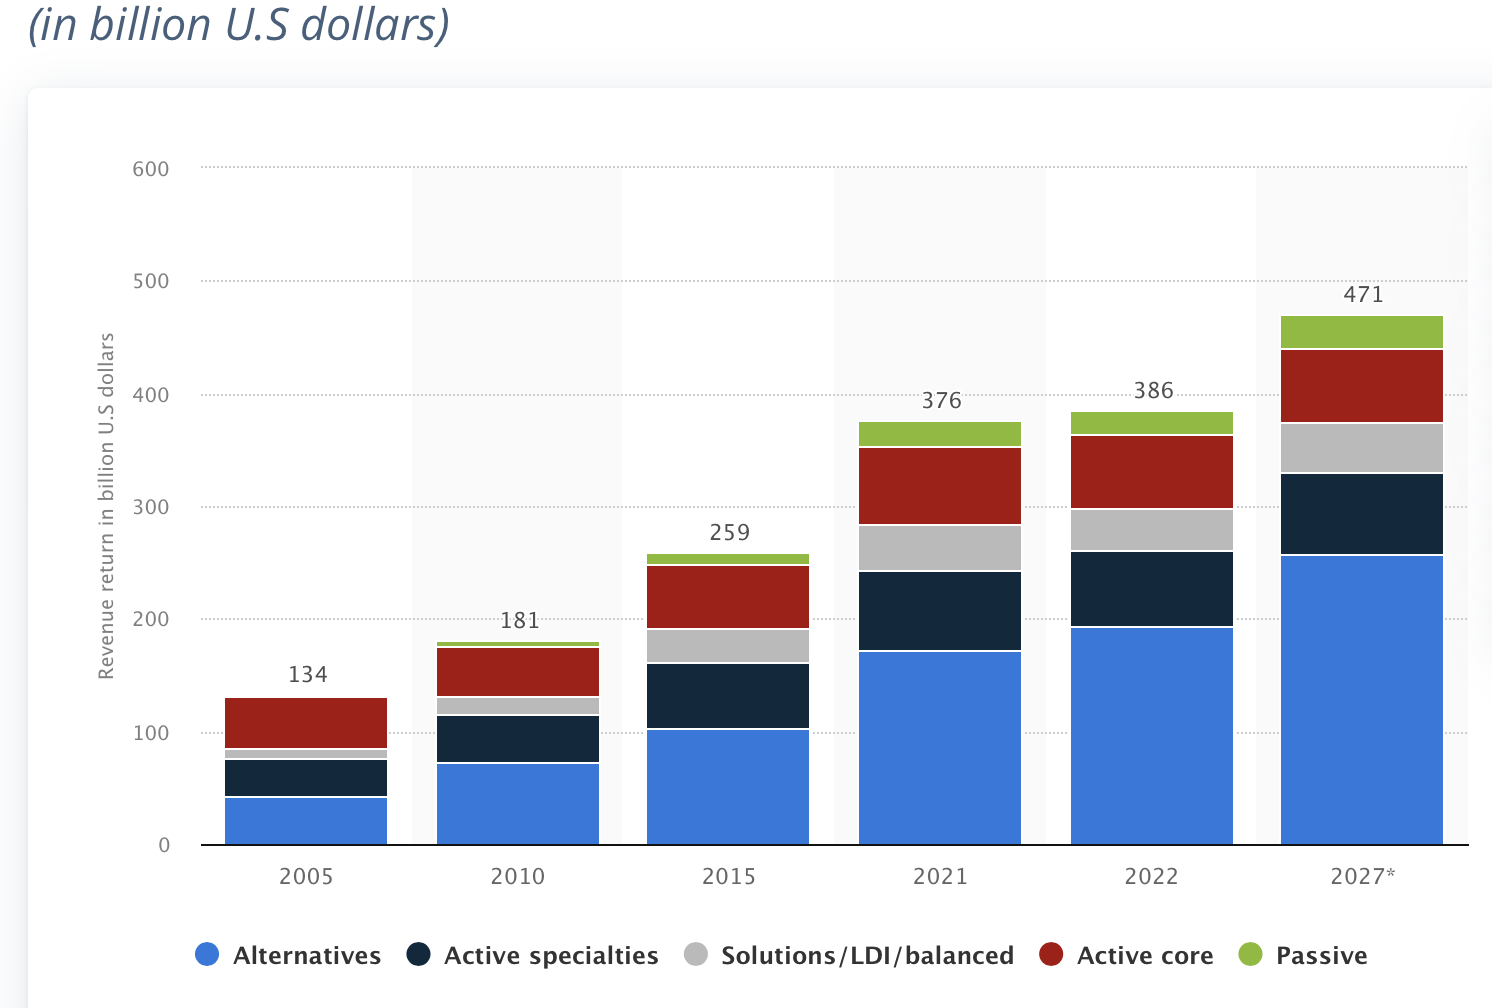
Financials
Regarding the income statement, JPMorgan takes the lead in the annual growth rate. Over the period 2017-2023 TTM, JPMorgan has exhibited robust revenue growth, averaging an annual rate of 8.39%, outpacing BofA with 2.60% and Wells Fargo with -1.84%. Notably, JPMorgan boasts the highest revenue among the three banks, reaching $142.4 billion.
Furthermore, JPMorgan has demonstrated superior performance in net income growth during the same period. With an annual net income growth of 18.28%, JPMorgan significantly outperforms BofA’s 11.22% and surpasses the stagnant growth of Wells Fargo at -2.88%.
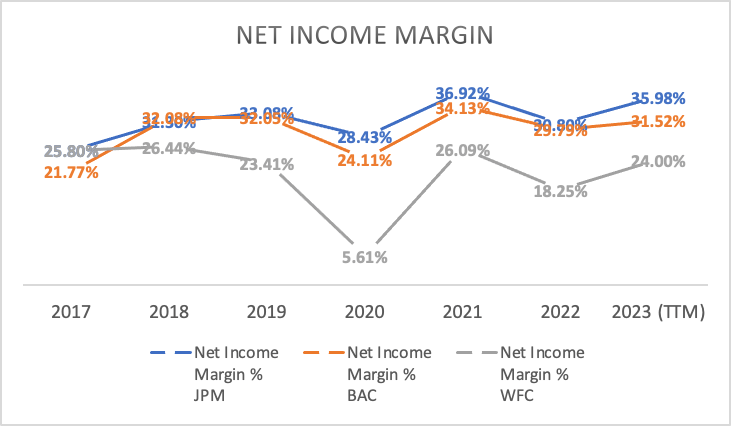
Concerning net income margin, JPMorgan closely aligns with BofA, as JPMorgan’s margin stands at 35.98% compared to BofA’s 31.52%. However, Wells Fargo lags considerably behind with a margin of 24%.
Author’s Calculations Author’s Calculations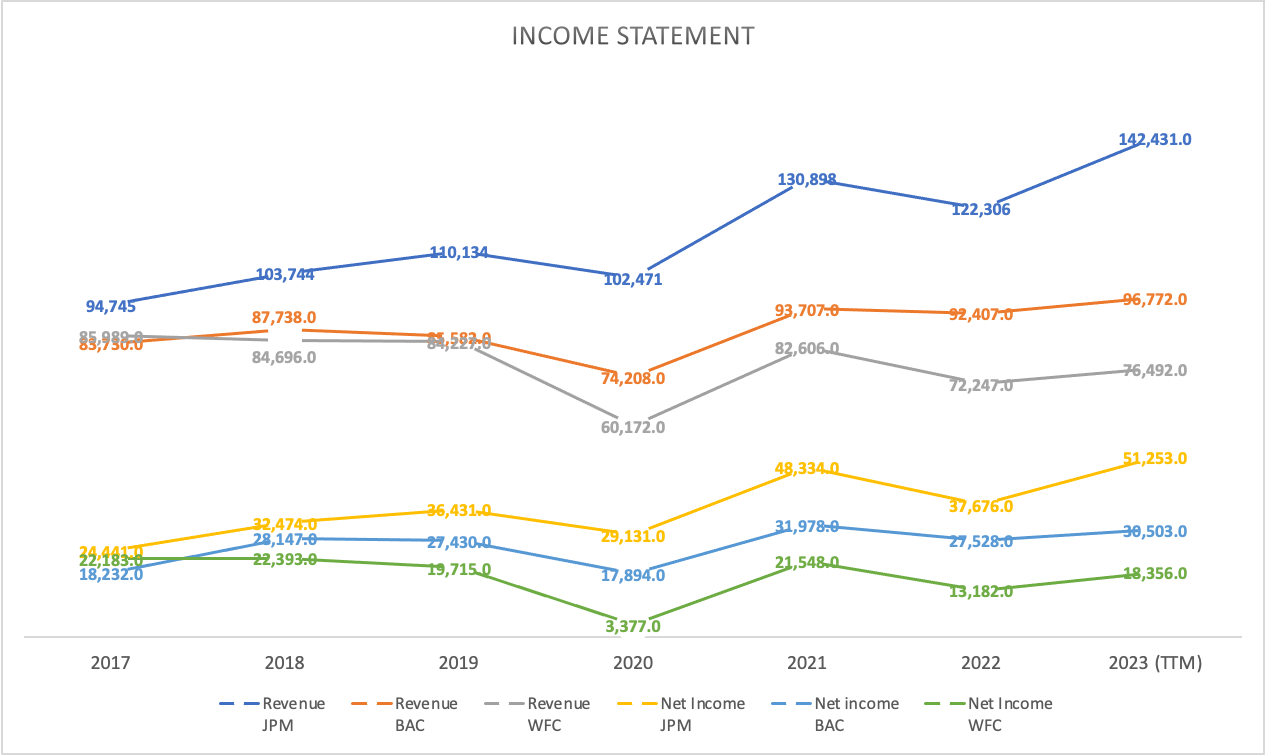
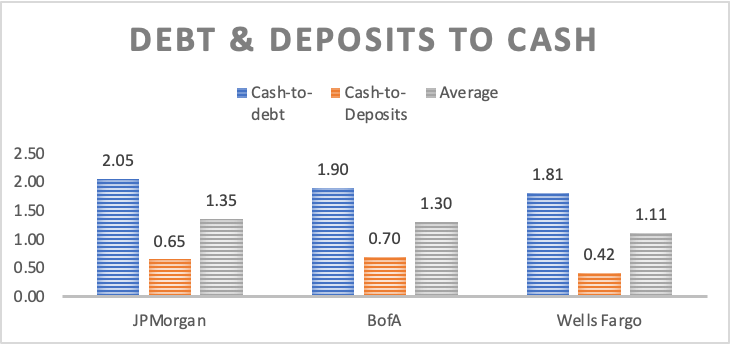
Turning to the balance sheet, it becomes evident that all three banks currently boast robust financial health, especially when comparing it to their total debt. In this regard, JPMorgan holds 2.05 times more cash than total debt, while BofA follows closely with a ratio of 1.90, and Wells Fargo stands at 1.81. However, when assessing the situation in relation to deposits, BofA stands out by covering approximately 70% of them with their cash and equivalents. JPMorgan secures the second position with 65%, while Wells Fargo trails behind at 42%.
In an overall evaluation using a composite score derived from these two key metrics, JPMorgan emerges at the forefront with a score of 1.35, closely trailed by BofA at 1.30. Wells Fargo, though maintaining a solid position, lags with a score of 1.11. Nevertheless, it’s important to note that all three are formidable, highly liquid banking giants, well-equipped to weather any potential banking panics.
Author’s Calculations Author’s Calculations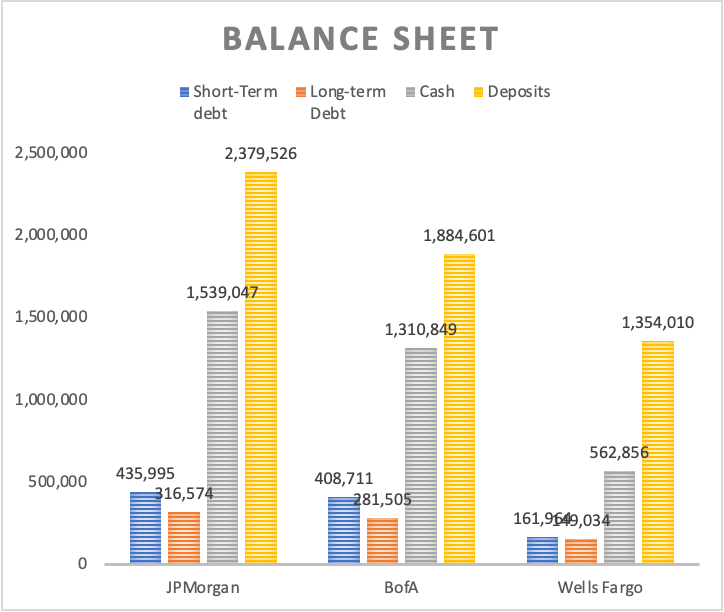
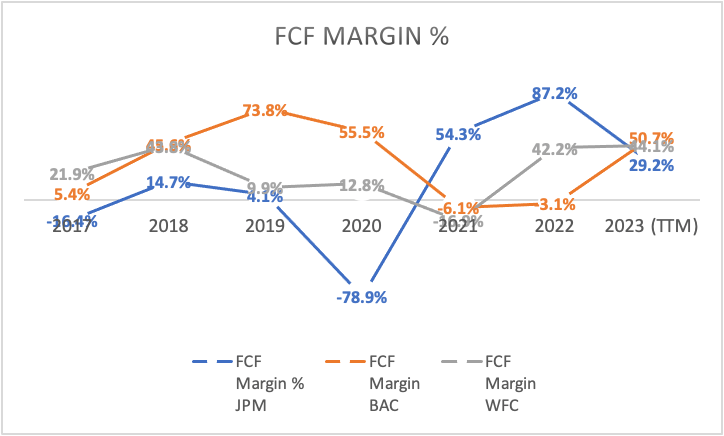
Finally, turning our attention to free cash flow, Bank of America (BofA) takes the lead with an impressive $49 billion, followed by JPMorgan (JPM) with $41 billion, and Wells Fargo with $33 billion. Examining the free cash flow margin reveals that BofA is currently in the lead with 50.7%, followed by Wells Fargo at 44.1%, while JPM lags significantly with 29.2%.
This disparity is also evident when looking at historical data, particularly the average free cash flow margin during the period 2017-2023 TTM. BofA and Wells Fargo maintained average FCF margins of 31.68% and 22.54%, respectively, during this period, whereas JPM reported a lower average of 13.47%. This underscores the consistent strength of BofA in generating free cash flow compared to both JPM and Wells Fargo.
Author’s Calculations Author’s Calculations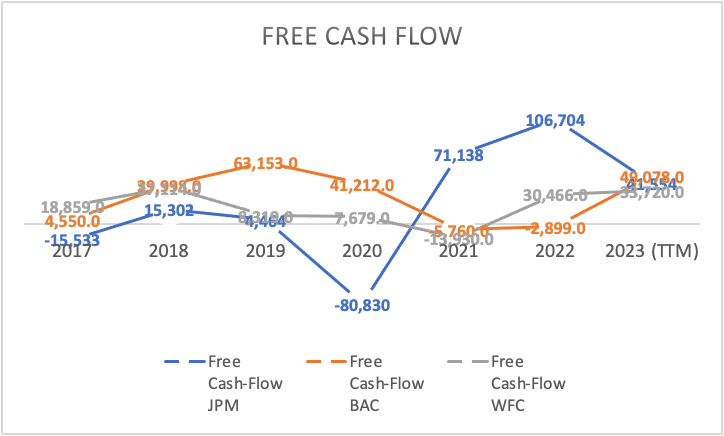
In summary, JPMorgan stands out as the bank with the most promising growth prospects. It is a robust and healthy institution, although not surpassing the financial health of Bank of America (BofA), which not only exhibits better free cash flows but also boasts a superior balance sheet. However, BofA faces the challenge of less optimistic growth prospects.
On the other hand, Wells Fargo emerges as the outlier or “black sheep” in this comparison. The bank, marred by various scandals and operating under asset limitations, faces constraints in its growth potential compared to JPMorgan. While its balance sheet remains solid, it doesn’t quite measure up to the financial strength of both JPMorgan and BofA.
Valuation
In this valuation section, I will employ three distinct residual earnings models for the banks discussed in this article. The assumption tables at the beginning of each subsection in the valuation section will be populated using various sources of information.
Additionally, the CAPM tables, utilized to calculate the Required Rates of Returns, will be provided. The betas of the stocks are sourced from MarketWatch and stand at 1.21 for BofA, 1.22 for Wells Fargo, and 1.1 for JPMorgan.
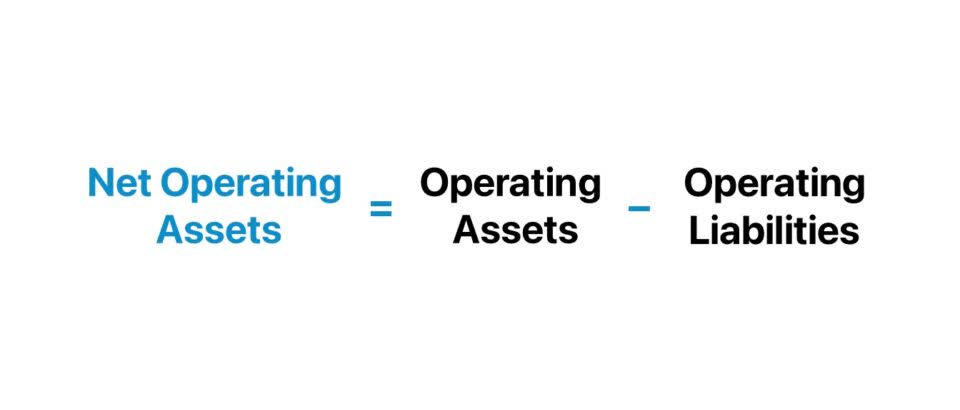
The process of determining net operating assets involved subtracting cash reserves from total assets, followed by subtracting total deposits. The latter serves as the operating liabilities in the formula, while all cash reserves are classified as non-operating assets in this calculation. This classification is rooted in the notion that cash, in my thought process, is a product of the book of loans (considered operating assets) originated from deposits (deemed operating liabilities).
Wall Street Prep Wall Street Prep
Furthermore, the book value was computed using a margin linked to revenue, achieved by dividing the 2023 TTM book value by the 2023 TTM revenue. This comprehensive approach aims to provide a thorough and accurate assessment of the valuation process.
Bank of America Corporation
Commencing with the initial bank, Bank of America, below is the assumption table. It’s worth noting that this is the same table utilized for calculating Weighted Average Cost of Capital [WAAC] in Discounted Cash Flow [DCF] models. However, as this is a Residual Earnings model, the focus will shift to calculating a Capital Asset Pricing Model (CAPM), derived from beta, the risk-free rate, and the average market return.
| TABLE OF ASSUMPTIONS | |
| (Current data) | |
| Equity Value | 258,667.00 |
| Debt Value | 690,216.00 |
| Cost of Debt | 1.22% |
| Tax Rate | 8.56% |
| 10y Treasury | 3.80% |
| Beta | 1.22 |
| Market Return | 10.50% |
| Cost of Equity | 11.97% |
| Net Income | 30,503.00 |
| Interest | 8,433.84 |
| Tax | 2,612.00 |
| D&A | 1,954.00 |
| Ebitda | 43,502.84 |
| D&A Margin | 2.02% |
| Interest Expense Margin | 8.72% |
| Revenue | 96,772.0 |
| CAPM | |
| Risk-Free Rate | 3.80% |
| Beta | 1.22 |
| Market Risk Premium | 6.650% |
| Required Rate of Return | 11.913% |
Displayed in the table are the variables for the terminal value, with the growth rate derived from the forward GAAP EPS growth rate available in the “growth” tab of Seeking Alpha for the stock ticker BAC, corresponding to Bank of America.
| Terminal Value Calculation | |
| Assumptions | |
| CAPM | 11.91% |
| Growth Rate | -2.98% |
| EV / EBITDA | 6.53 |
Next, the table facilitates the calculation of net operating assets and book value throughout the projection, employing the process previously mentioned. Bank of America’s total assets currently stand at $3.15 trillion, with total investments totaling $1.31 trillion and deposits amounting to $1.88 trillion.
| Operating Assets | -42,360.0 |
| Book value | 287,062.0 |
| Operating Assets / Revenue | -45.84% |
| Book Value / Revenue | 296.64% |
Moving forward, the subsequent table outlines revenue and operating income projections. Although D&A and interest expenses are included in the table, they are not utilized in the model. For revenue, estimates for FY2023 and FY2024 are selected at $100.83 billion and $100.8 billion, respectively. Operating income is then calculated using the EPS estimates for FY2023 and FY2024, which are $3.41 and $3.26, respectively. This figure is then multiplied by common shares outstanding to obtain net income, and taxes are added to that net income to derive operating income.
| Revenue | Operating Income | Plus D&A | Plus Interest | |
| 2023 | $100,830.0 | $29,330.0 | $31,365.94 | $40,153.44 |
| 2024 | $100,800.0 | $28,039.0 | $30,074.33 | $38,859.22 |
| 2025 | $105,023.5 | $33,463.9 | $35,584.54 | $44,737.52 |
| 2026 | $109,424.0 | $34,866.1 | $37,075.53 | $46,612.02 |
| 2027 | $114,008.9 | $36,327.0 | $38,628.99 | $48,565.06 |
| 2028 | $118,785.8 | $37,849.1 | $40,247.55 | $50,599.94 |
| ^Final EBITA^ |
Author’s Calculation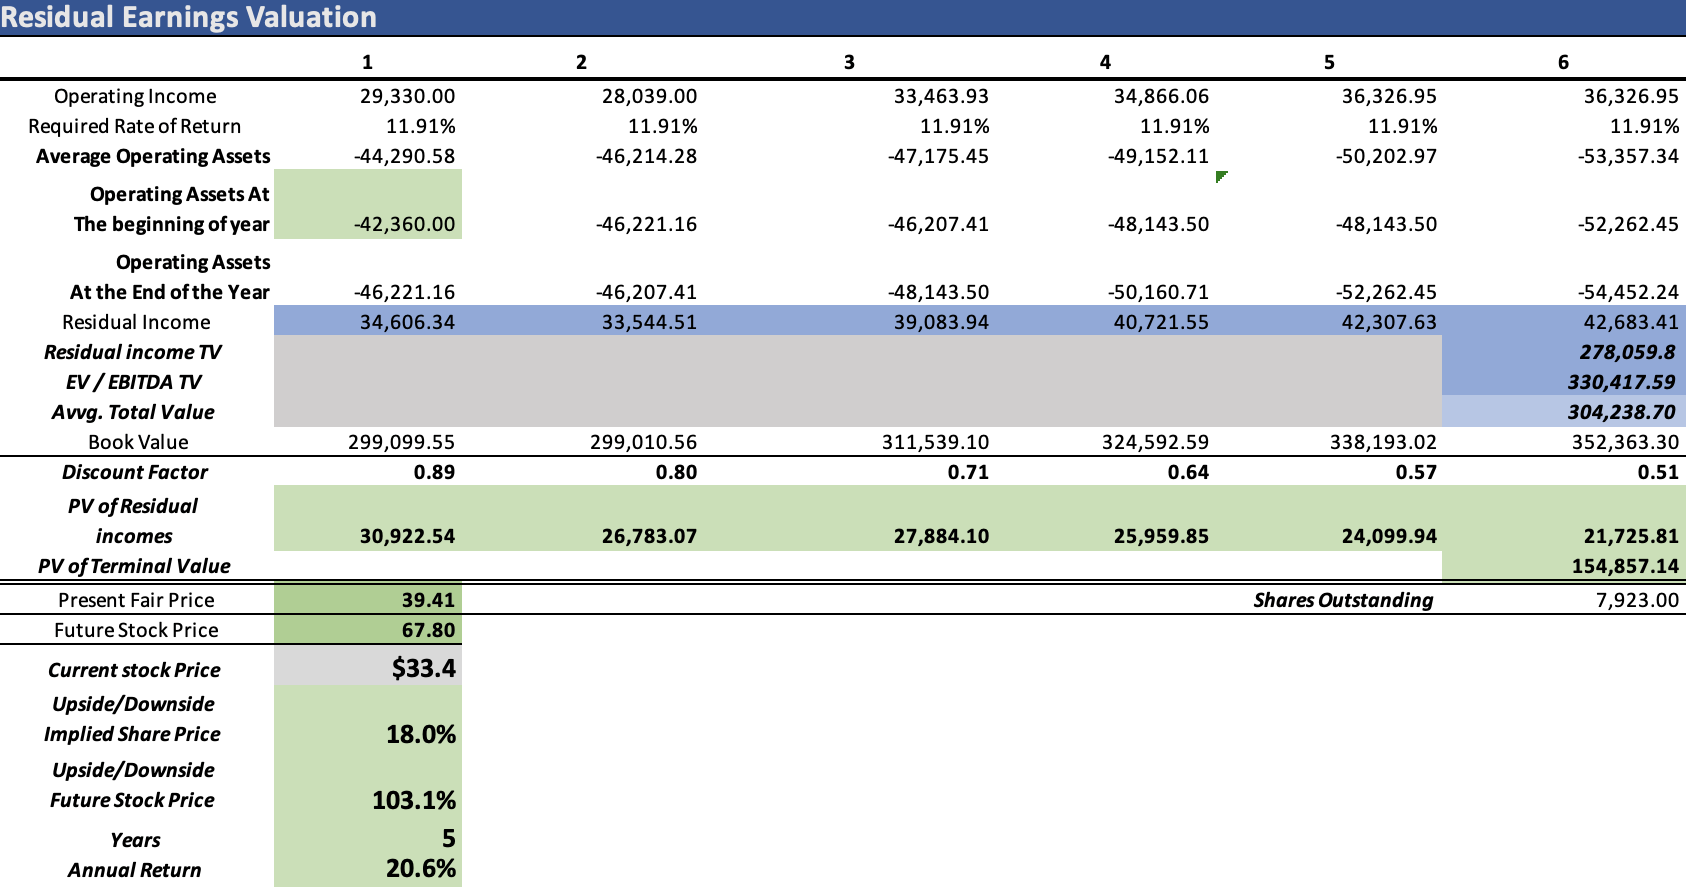
According to my model, Bank of America is deemed undervalued by approximately 18%, suggesting a fair price per share of around $39.41. Moreover, the model indicates that by 2028, the stock is projected to reach a price of $67.80, translating into annual returns of 20.6%, a commendable figure.
Wells Fargo & Co.
For the upcoming analysis focused on Wells Fargo, I will adopt a methodology similar to the one previously detailed. Presented below is the comprehensive set of assumptions and pivotal tables essential for computing revenue and operating income targets, along with the CAPM.
| TABLE OF ASSUMPTIONS | |
| (Current data) | |
| Equity Value | 161,696.00 |
| Debt Value | 310,998.00 |
| Cost of Debt | 2.20% |
| Tax Rate | 13.70% |
| 10y Treasury | 3.80% |
| Beta | 1.21 |
| Market Return | 10.50% |
| Cost of Equity | 11.91% |
| Net Income | 18,356.00 |
| Interest | 6,832.73 |
| Tax | 2,514.00 |
| D&A | 6,014.00 |
| Ebitda | 33,716.73 |
| D&A Margin | 7.86% |
| Interest Expense Margin | 8.93% |
| Revenue | 76,492.0 |
The forward GAAP EPS growth rate for Wells Fargo available in Seeking Alpha is -0.12%.
| Terminal Value Calculation | |
| Assumptions | |
| CAPM | 11.85% |
| Growth Rate | -0.12% |
| EV / EBITDA | 7.38 |
| CAPM | |
| Risk-Free Rate | 3.80% |
| Beta | 1.21 |
| Market Risk Premium | 6.650% |
| Required Rate of Return | 11.847% |
Furthermore, the table facilitates the intricate calculation of net operating assets and book value throughout the projection, leveraging the previously mentioned process. Wells Fargo’s present total assets amount to $1.9 trillion, with total investments reaching $562.85 billion, and deposits totaling $1.35 trillion.
| Operating Assets | -7,605.0 |
| Book value | 182,373.0 |
| Operating Assets / Revenue | -10.53% |
| Book Value / Revenue | 238.42% |
| Revenue | Operating Income | Plus D&A | Plus Interest | |
| 2023 | $82,500.0 | $20,971.0 | $27,457.36 | $34,826.77 |
| 2024 | $80,860.0 | $20,267.0 | $26,624.42 | $33,847.33 |
| 2025 | $81,668.6 | $19,924.5 | $26,345.52 | $33,640.66 |
| 2026 | $82,485.3 | $20,123.8 | $26,608.97 | $33,977.06 |
| 2027 | $83,310.1 | $20,325.0 | $26,875.06 | $34,316.83 |
| 2028 | $84,143.2 | $20,528.3 | $27,143.81 | $34,660.00 |
| ^Final EBITA^ |
Author’s Calculation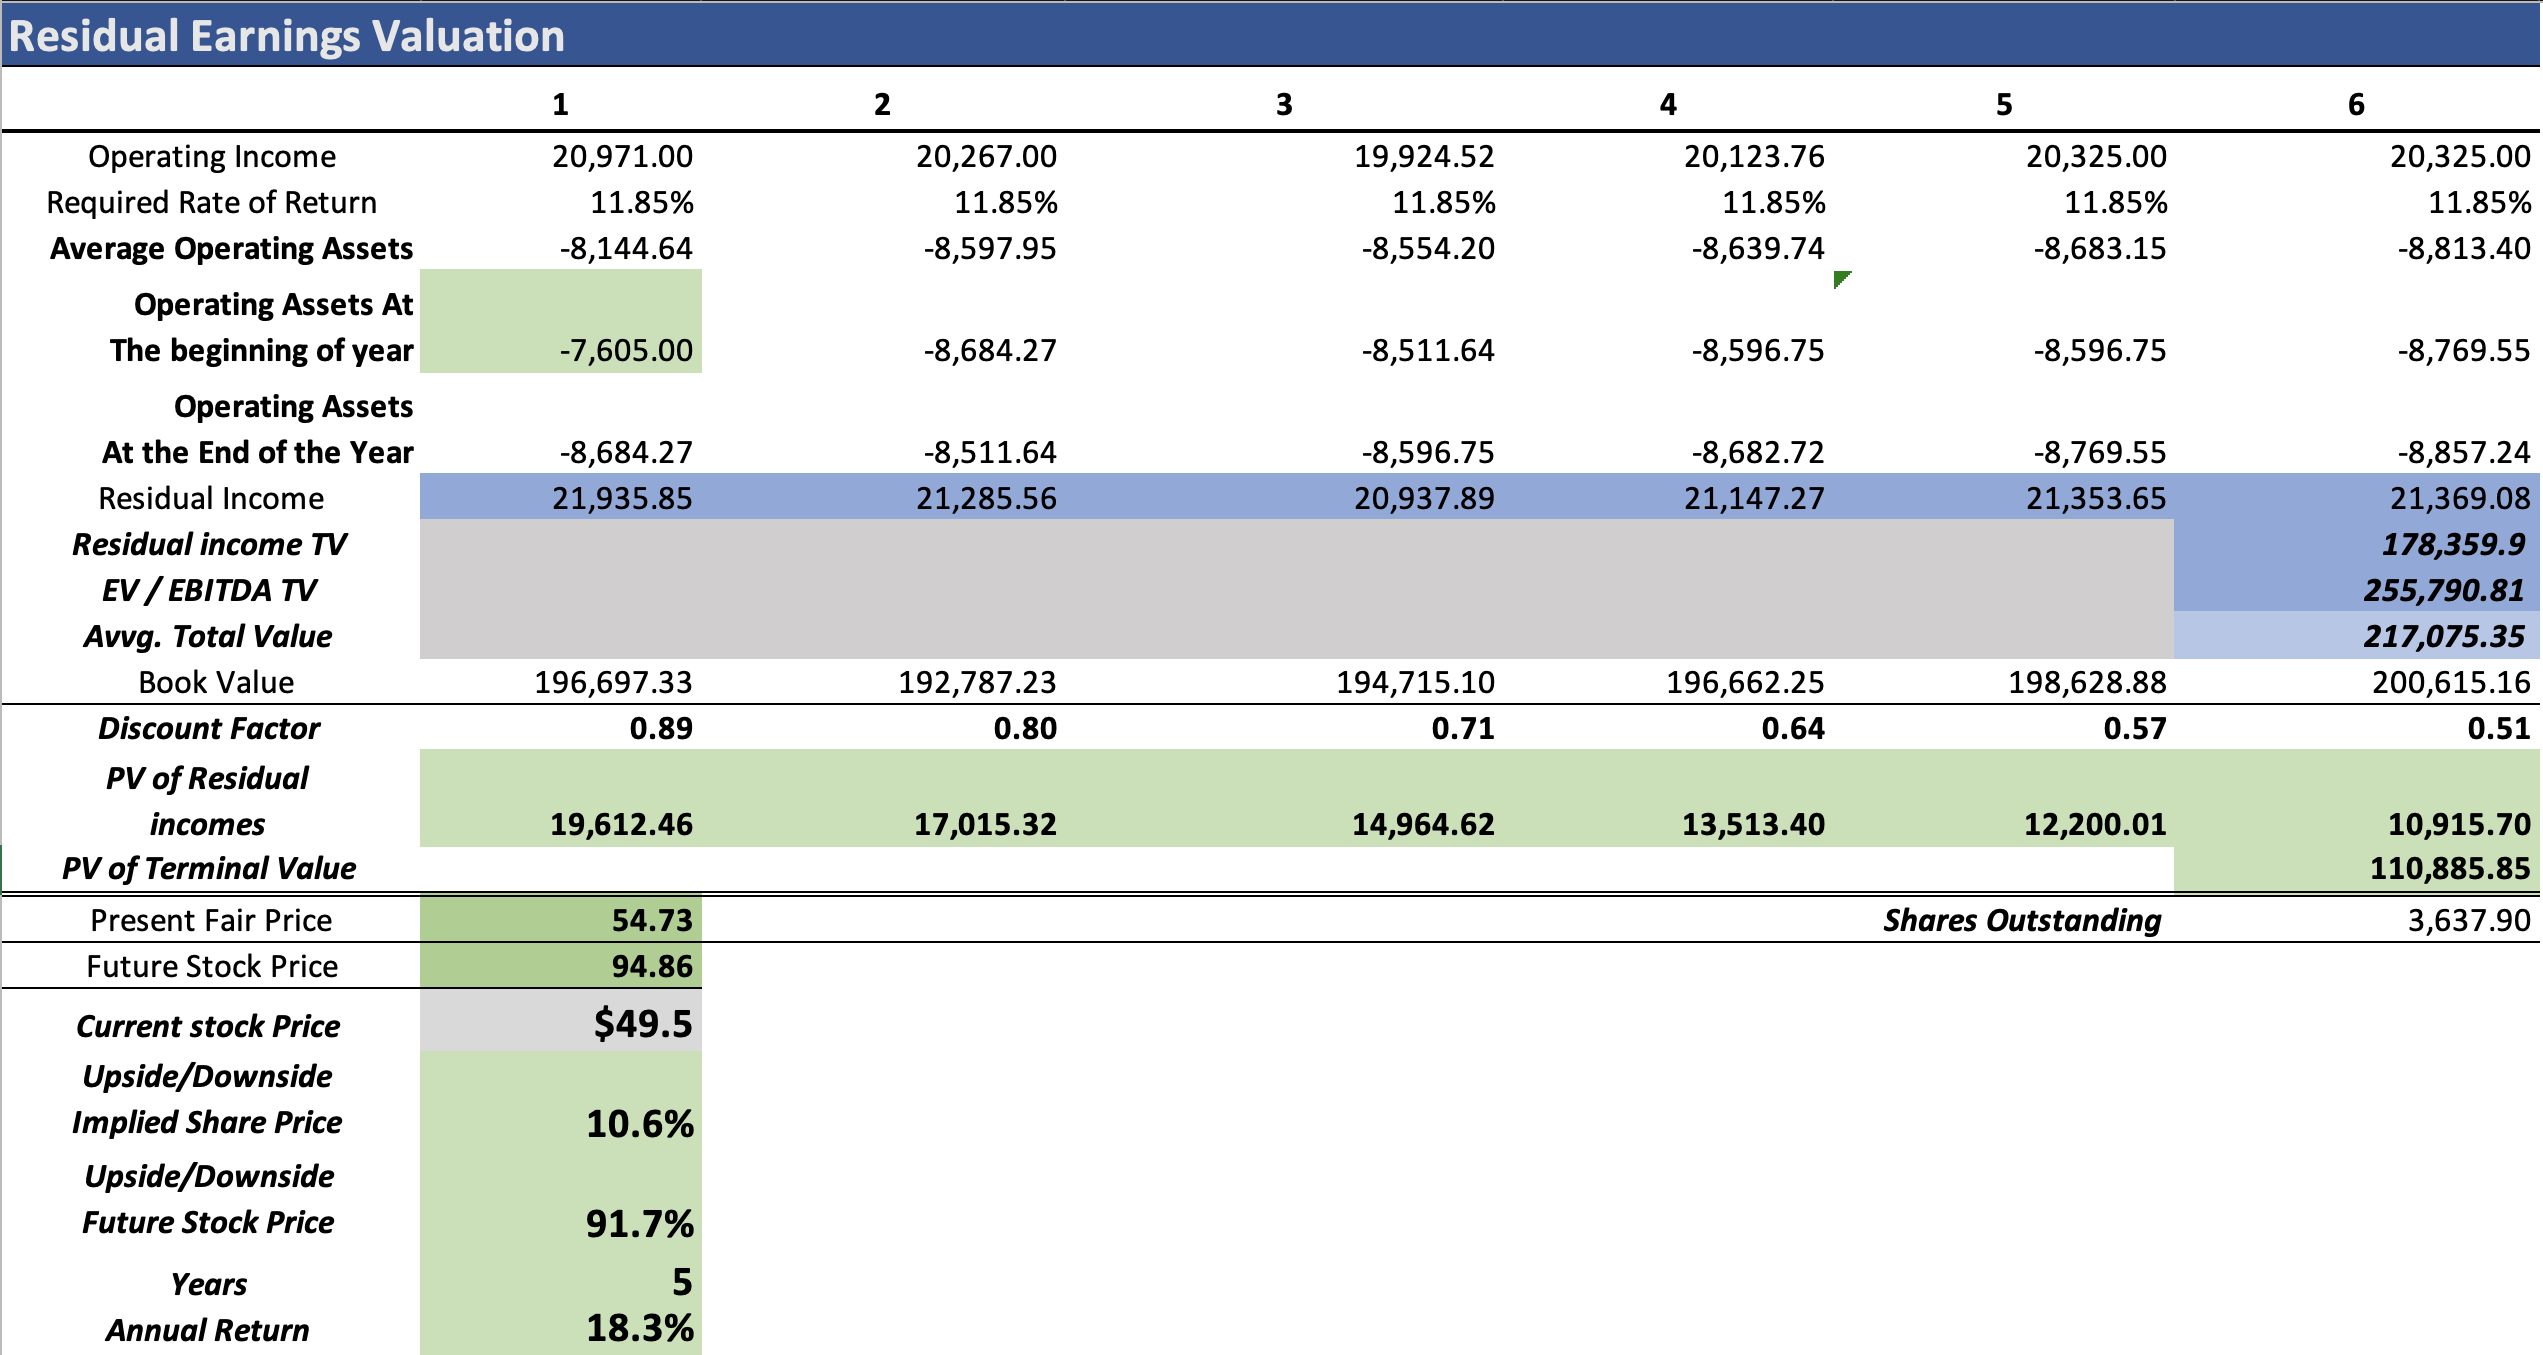
As depicted, the model advocates for a fair valuation of $54.73 for Wells Fargo, signifying an undervaluation of 10.6% in comparison to the current stock price. Peering into the future, the model anticipates a prospective price of $94.86 by 2028, translating into annual returns of 18.3% throughout that year. This projection underscores a promising growth trajectory for Wells Fargo, as envisaged by the model.
JPMorgan Chase & Co.
| TABLE OF ASSUMPTIONS | |
| (Current data) | |
| Equity Value | 289,967.00 |
| Debt Value | 752,569.00 |
| Cost of Debt | 1.30% |
| Tax Rate | 23.94% |
| 10y Treasury | 3.80% |
| Beta | 1.1 |
| Market Return | 10.50% |
| Cost of Equity | 11.17% |
| Net Income | 51,253.00 |
| Interest | 9,778.91 |
| Tax | 12,270.00 |
| D&A | 5,846.00 |
| Ebitda | 79,147.91 |
| D&A Margin | 4.10% |
| Interest Expense Margin | 6.87% |
| Revenue | 142,431.0 |
The forward GAAP EPS growth rate available at Seeking Alpha for JPMorgan is 0.34%.
| Terminal Value Calculation | |
| Assumptions | |
| CAPM | 11.12% |
| Growth Rate | 0.34% |
| EV / EBITDA | 9.72 |
| CAPM | |
| Risk-Free Rate | 3.80% |
| Beta | 1.1 |
| Market Risk Premium | 6.650% |
| Required Rate of Return | 11.115% |
Moreover, the table is instrumental in calculating net operating assets and book value throughout the projection, utilizing the previously mentioned process. Currently, JPMorgan’s total assets amount to $3.89 trillion, with total investments totaling $1.5 trillion, and deposits reaching $2.37 trillion.
| Operating Assets | -20,240.0 |
| Book value | 317,371.0 |
| Operating Assets / Revenue | -16.55% |
| Book Value / Revenue | 222.82% |
| Revenue | Operating Income | Plus D&A | Plus Interest | |
| 2023 | $159,888.0 | $61,478.0 | $68,040.51 | $79,017.97 |
| 2024 | $159,660.0 | $57,008.4 | $63,561.58 | $74,523.39 |
| 2025 | $174,811.7 | $81,811.5 | $88,986.53 | $100,988.61 |
| 2026 | $191,401.4 | $89,575.4 | $97,431.36 | $110,572.43 |
| 2027 | $209,565.4 | $98,076.1 | $106,677.59 | $121,065.75 |
| 2028 | $229,453.1 | $107,383.5 | $116,801.30 | $132,554.89 |
|
^Final EBITA^ |
Author’s Calculation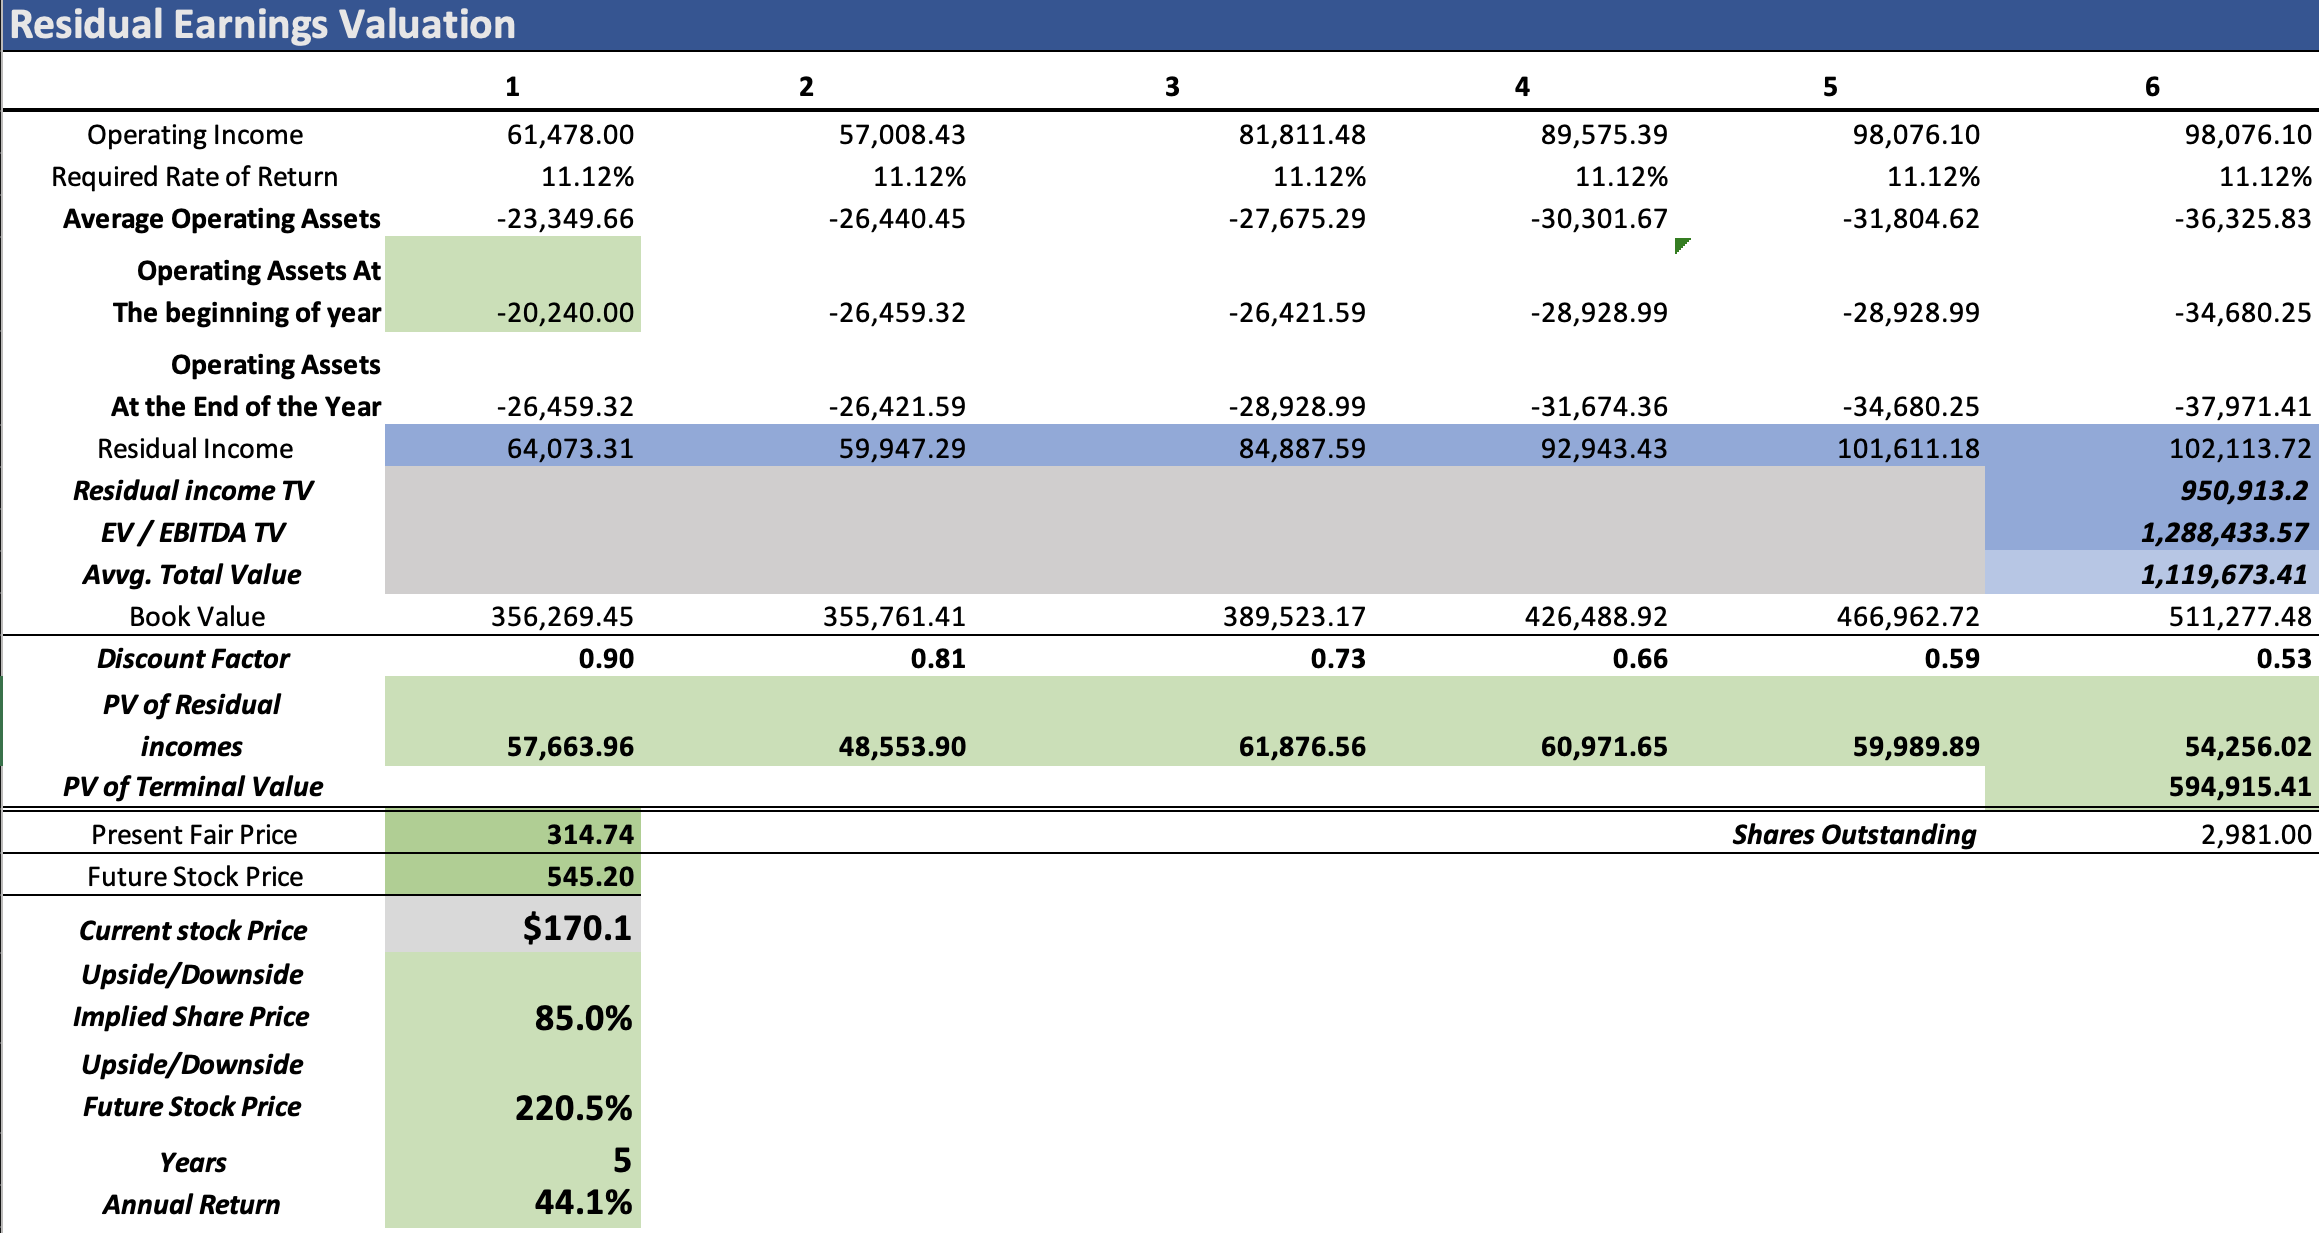
The comprehensive evaluation places JPMorgan at the forefront among the three banks, boasting superior growth prospects and the best overall score when comparing its debt and deposits to cash. According to the model, the stock could be undervalued by an impressive 85%, suggesting a fair price of around $314.74. Looking ahead to 2028, the model projects a future price of $545.20, translating into extraordinary annual returns of 44.1%.
While this figure may initially seem high, I shared the same skepticism when the model generated this result. Subsequently, in my quest for validation, I sought out other articles on Seeking Alpha covering JPMorgan. Interestingly, I discovered articles with targets around $240. However, it’s crucial to note that these targets covered a shorter projection period of 3 years, whereas my analysis spans 6 years. Consequently, the extended projection horizon results in more residual earnings to discount, contributing to a higher stock fair price.
Finally, attempting to project each of the bank’s operations by the market growth rate of their respective market is inconsequential. In the event of a downturn, such as in investment banking, all three banks would be equally affected, and the same scenario would apply to consumer banking, furthermore, as previously said, the banks have a very similar dependence on all the segments they operate which would cause them to yield similar fair prices.
In conclusion, all three banks present a promising upside with commendable annual returns. Nevertheless, JPMorgan stands out with extraordinary returns and a substantial upside. Consequently, JPMorgan is unequivocally designated as a “strong buy,” while Bank of America and Wells Fargo could be classified as a “buy.” This distinction is derived from the superior prospects projected for JPMorgan compared to the other two banks.
Risks to Thesis
The primary risks associated with this thesis revolve around well-established challenges within the banking industry, the foremost being the perennial threat of bank runs. As exemplified in the 2008 financial crisis, large banks are more susceptible to mismanagement, often relying on the expectation of being rescued. Unfortunately, this rescue focus tends to prioritize saving the bank over safeguarding shareholders, potentially leading to significant losses for investors.
A second critical risk stems from the saturation of the market. The recent surge in deposit growth experienced by major banks is, in part, a consequence of individuals fleeing from smaller lenders following the bank panic in March 2023. However, this momentum may be fleeting, and there is a possibility that depositors could revert to smaller institutions offering more attractive interest rates in a high-interest rate environment.
The final identified risk pertains to a broader market downturn, which could substantially diminish the revenue of Asset & Wealth Management. This revenue model relies on a commission tied to AUM. Therefore, if the valuation of these AUM diminishes during a market downturn, the associated commission would represent a reduced monetary value.
Understanding and mitigating these risks is crucial for a comprehensive evaluation of the thesis, as each poses distinct challenges to the sustained success and profitability of the banking industry in the outlined context.
Conclusion
In conclusion, the comprehensive analysis of JPMorgan, Bank of America, and Wells Fargo underscores distinct trajectories within the banking sector. JPMorgan emerges as the standout performer, exhibiting superior growth prospects and an impressive overall score, positioning it as a “strong buy.” The model suggests an undervaluation of around 85%, with a fair price projection of approximately $314.74 and an ambitious future target of $545.20 by 2028, translating into remarkable annual returns of 44.1%. While these figures may seem ambitious, the extended projection period contributes to this optimistic outlook, making JPMorgan an exceptional investment proposition.
On the other hand, BofA and Wells Fargo, while offering decent upsides and commendable annual returns, fall slightly behind JPMorgan in terms of growth potential. With a fair price of $39.41, BofA is classified as a “buy,” projecting an annual return of 20.6%. Wells Fargo, valued at $54.73, also receives a “buy” rating, with an anticipated annual return of 18.3% by 2028. These ratings and targets reflect a nuanced understanding of each bank’s strengths, weaknesses, and market conditions, providing investors with a well-informed basis for decision-making in navigating the dynamic landscape of the banking industry.
Be the first to comment