

imaginima
Introduction
Based on recent returns, why even review another International Equity fund might be asked. The next chart shows what I mean.
PortfolioVisualizer.com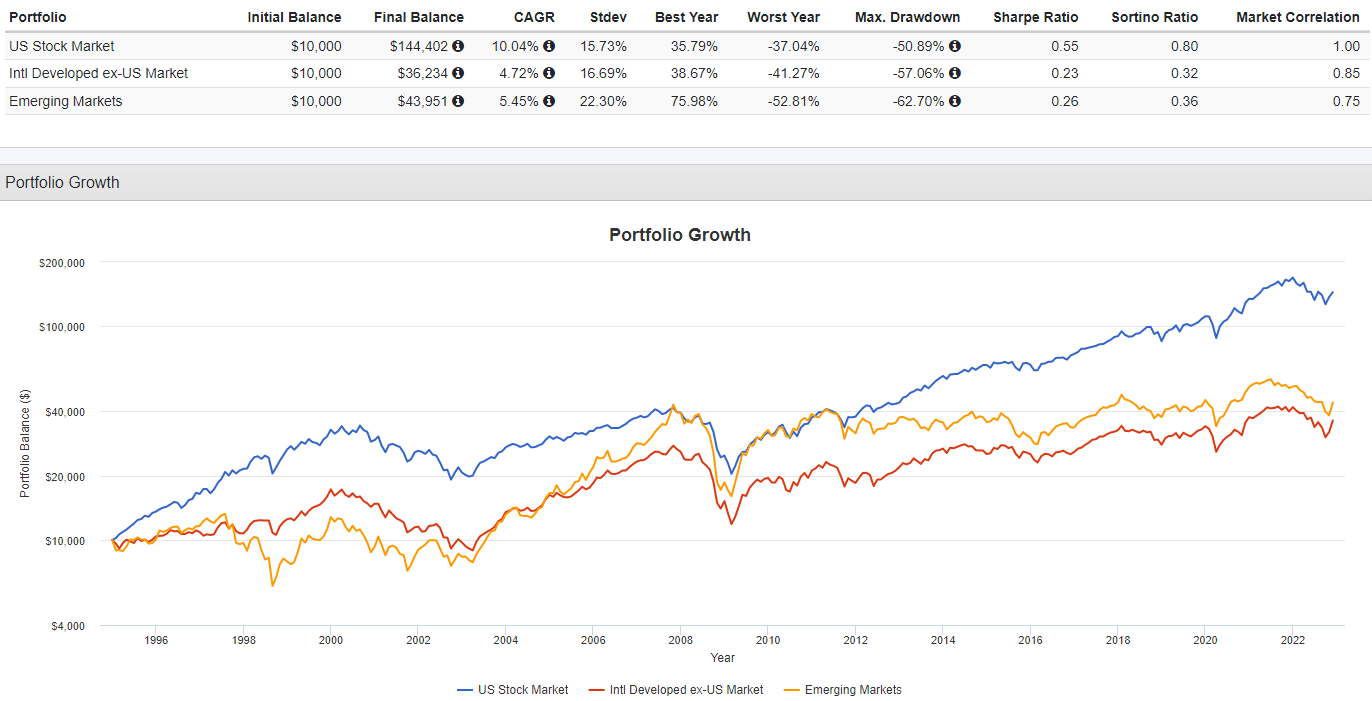
The chart also shows two reasons why investors might want some International exposure. From 2003 and into the GFC of late 2008, International stocks, both Developed and Emerging, outperformed. Also, since 1995, both sets of stocks were not 100% correlated to the US market.
While reviewing the JPMorgan Diversified Return International Equity ETF (NYSEARCA:JPIN) is the focal point, under the Portfolio strategy section, I will examine whether eliminating currency risk is a better play when investing outside the US. For any non-US reader, you would want to do the same analysis using your home currency.
JPMorgan Diversified Return International Equity ETF review
Seeking Alpha describes this ETF as:
The fund invests in public equity markets of global ex-US/Canada region. The fund invests in value and momentum stocks of companies across diversified market capitalization. It seeks to track the performance of the JP Morgan Diversified Factor International Equity Index. JPIN started in 2014.
Source: seekingalpha.com/symbol JPIN
JPIN has amassed $760m in assets. The managers charge a reasonable 37bps in fees. Currently, investors see a 5.6% yield. JPMorgan provides three benefits of this ETF:
-
Designed to provide international equity exposure with potential for better risk-adjusted returns than a market cap-weighted index.
-
Utilizes a rules-based approach that combines risk-based portfolio construction with multi-factor security selection based on value, quality and momentum factors.
-
Aims to diversify risk at the region, sector and stock levels while providing exposure to factors that have the potential to enhance returns.
Index review
For any fund that passively invests based on an index, starting your due diligence there makes sense to me. This is what I found about the index used by JPIN.
The JP Morgan Diversified Factor International Equity Index is based on the FTSE Developed ex North America Index, which includes the UK, Europe, Japan, and Asia-Pacific regions. All Index data is from the Index PDF.
- The data cut-off date for the determination of factor data is the close of business on the last trading day of the month before the review month.
- Liquidity is defined as the median daily trading volume over the 22 business days prior to the data cut-off date.
- If a company consists of multiple lines, only one eligible line per region is included in the ranking procedure.
- The factor rank of each stock is defined as the percentile rank within the relevant ICB5 industry of the eligible universe, where factor values are available.
- Stocks with lower percentile rank are more attractive than stocks with a higher percentile rank. Where two or more constituents have identical ranks, they are ordered by liquidity.
- The Composite Multi Factor Score comprises of a weighted sum of all the metrics used in each of the three single factors.
The three factors used by this Index are, with their sub-components:
Value:
1. Earnings Yield = Latest 12-month Net Income/ Market Capitalization
2. Book to Price = Latest reported Book Value/ Market Capitalization
3. Free Cash Flow = Latest 12-month Net Operating Cash Flow less Capital Expenditure/ Market Capitalization
4. Dividend Yield = Latest 12-month Trailing Dividend/ Market Capitalization
Momentum:
Momentum is calculated as the one-year total return in local currency divided by the standard deviation of daily local returns over one year. A minimum of 200 daily price observations is required. A security with fewer than 200 daily price observations is awarded a neutral score of 50.5.
The momentum score is determined by ranking momentum values where higher momentum stocks are more attractive. The contribution (multiplier) of Momentum ranks in the Composite Multi Factor is 36.
Quality:
Quality is comprised of ten metrics spanning three themes: Profitability, Solvency & Risk and Earnings Quality.
research.ftserussell.com Indices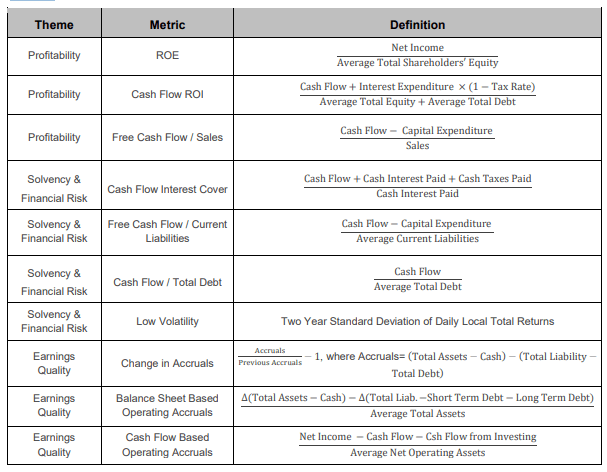
Here the weightings are:
-
Metrics within the Profitability Theme: 4
-
Metrics within the Solvency & Financial Risk Theme: 3
-
Metrics within the Earnings Quality Theme: 4
The Composite Multi Factor Score is a weighted sum of the three factors: Value, Momentum and Quality. The weighting scheme ensures:
1. Metrics used within each Quality factor theme are equally weighted; Metrics within Value factor are equally weighted; Metrics within Momentum factor are equally weighted.
2. Each Quality factor theme is equally weighted
3. Each factor is equally weighted
For more about the Index construction, here is a link to the full PDF. The Index factors are reviewed at the end of each calendar quarter.
Holdings review
JPIN currently holds 472 securities. In 2021, the portfolio experienced a 35% turnover ratio, which seems high for an index-based ETF, indicating the quarterly factor adjustments might be driving that number.
The first list shows countries with a 2+% weighting. In all there are 25 countries represented.
am.jpmorgan.com; compiled by Author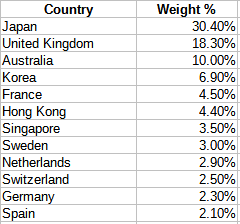
Asia is the largest regional exposure at 56%; the UK at 18%, and Europe at 24%. This results in the following currency exposures.
am.jpmorgan.com; compiled by Author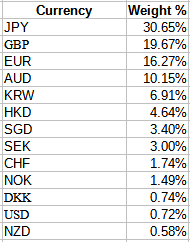
An interesting point is JPIN only has currency forward contracts against Japan and some Asian currencies; none of the others. Next, we look at sectors.
am.jpmorgan.com; compiled by Author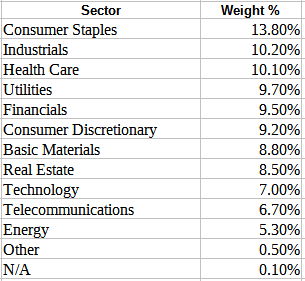
Later, I will compare these against a popular International Developed Market ETF to see how using factors altered the sector allocations. Ignoring cash, the largest 20 positions are:
am.jpmorgan.com; compiled by Author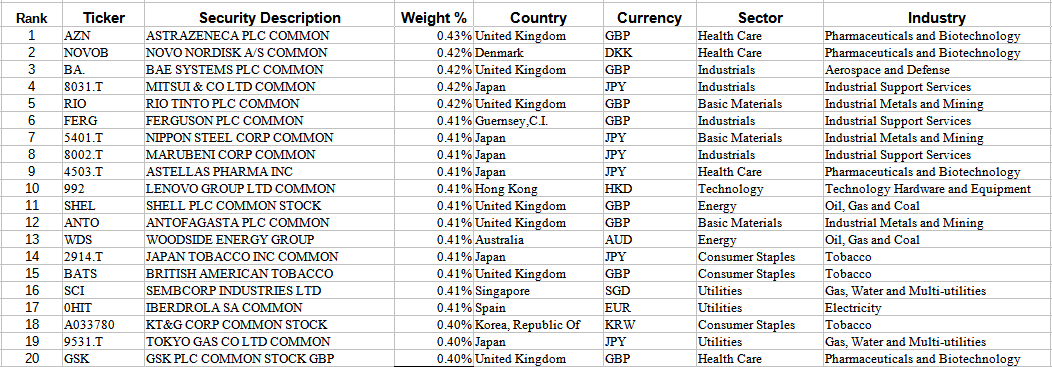
As one sees, the factor-weighting process smooths out the allocations, with 34 stocks at or just above .4% and another 70 between .35-.39%. There are 120 below .05%.
Distribution review
seekingalpha.com DVDs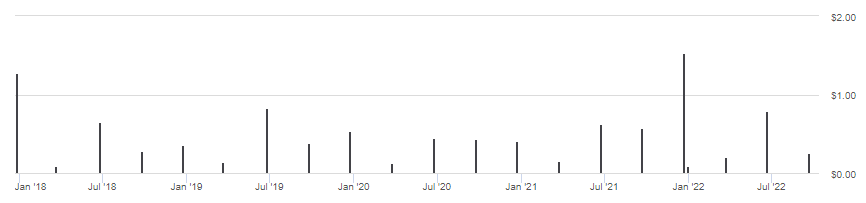
Like many international ETFs, the quarterly payments vary, with the June and December usually higher as some non-US stocks pay dividends semi-annually. Seeking Alpha give JPIN a high “A” rating for their payout history. Seeking Alpha’s complete set of ratings, grades, and rankings are:
Seekingalpha.com JPIN homepage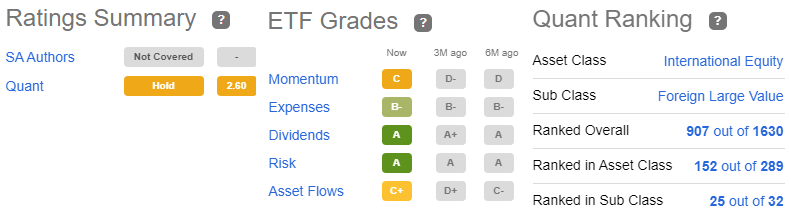
Despite the high grades, the sub-class ranking within the SA Quant system is not favorable.
Comparing JPIN to non-factored ETF
I picked the popular Vanguard FTSE Developed Markets ETF (VEA) as FTSE considers South Korea as developed, not Emerging, thus matching JPIN’s classification. MSCI-indexed ETFs still have that country as EM. I think Canada is the only non-overlapping country.
multiple pages; compiled by Author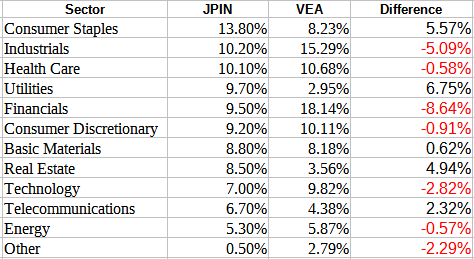
Sectors were definitely affected as over half differ by almost 5% or more. Country comparing show similar differences, with VEA having 10% in Canada, whereas JPIN has none.
multiple pages; compiled by Author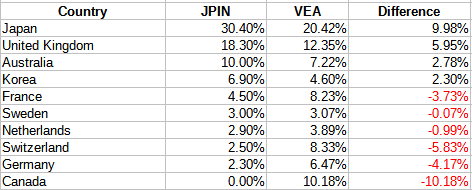
Using Vanguard’s comparison tool, we can see how they matchup on several ratios.
personal.vanguard.com 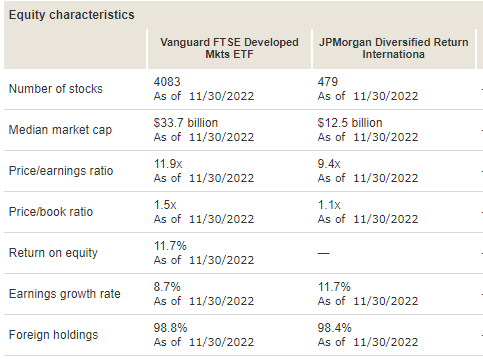
As I show later, JPIN’s use of factors has not provided investors with a “better mouse trap”: sometimes simple just works better.
Portfolio strategy
An added risk (or opportunity) of investing outside one’s home currency is the risk your currency will be stronger than the others, causing foreign prices to be converted back at less favorable exchange rates. Allocating some or all of your international assets to funds that hedge that exposure reduces the currency risk.
PortfolioVisualizer.com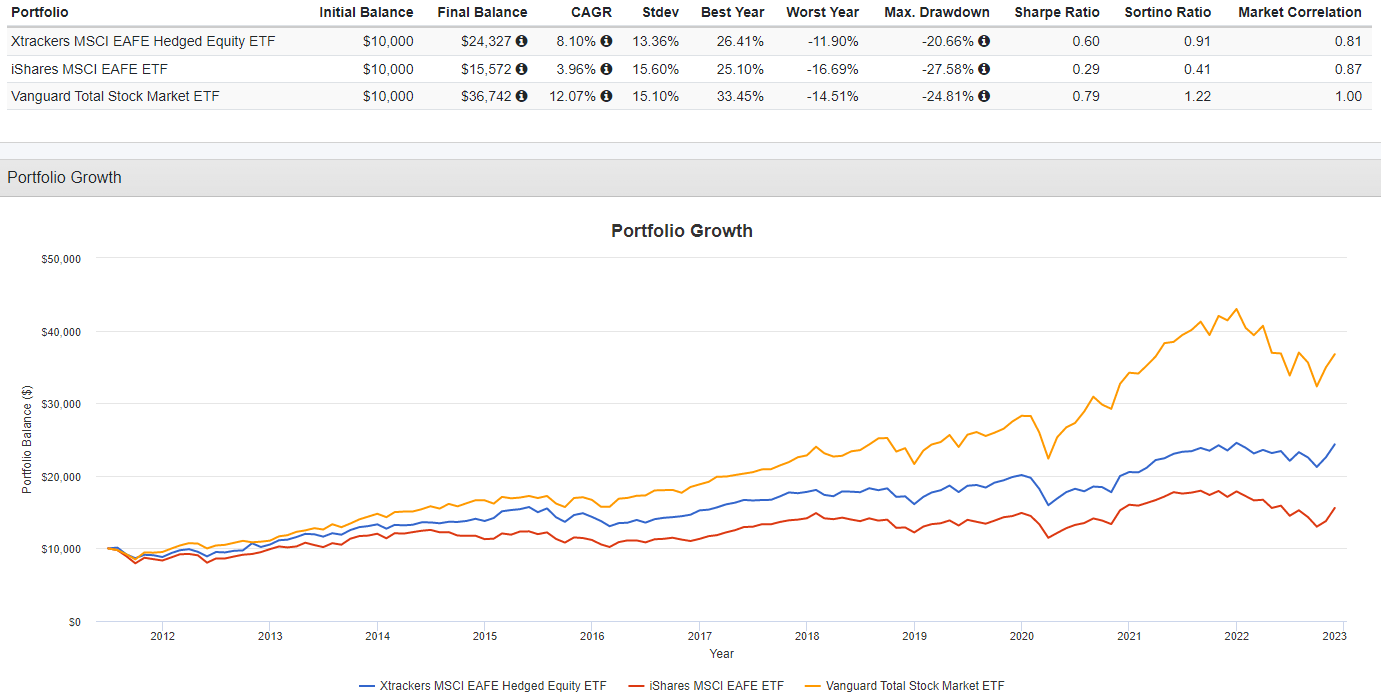
Since 2011, while still trailing US stock returns, hedging provided better returns on international stocks.
xe.com/currencycharts 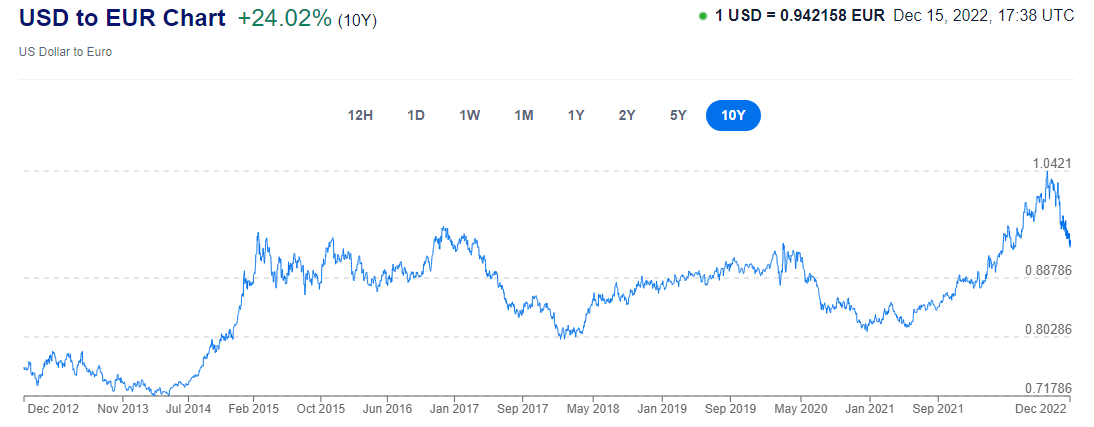
This was during a time when the USD wasn’t always the strongest currency against the Euro. Except for two of the last eleven years, the hedged ETF did better.
PortfolioVisualizer.com; compiled by Author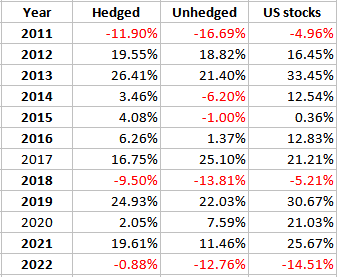
I recently compared the WisdomTree International Hedged Quality Dividend Growth Fund (IHDG) to its sister ETF that doesn’t hedge, the WisdomTree International Quality Dividend Growth Fund (IQDG), which showed similar results that favored hedging (article link).
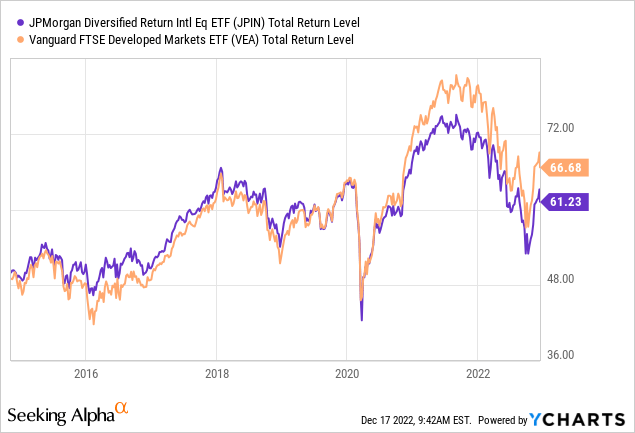
For those willing to go unhedged, the question than changes to comparing JPIN to similar international funds, which I do next. I found three others besides VEA that all provided investors with better returns.
PortfolioVisualizer.com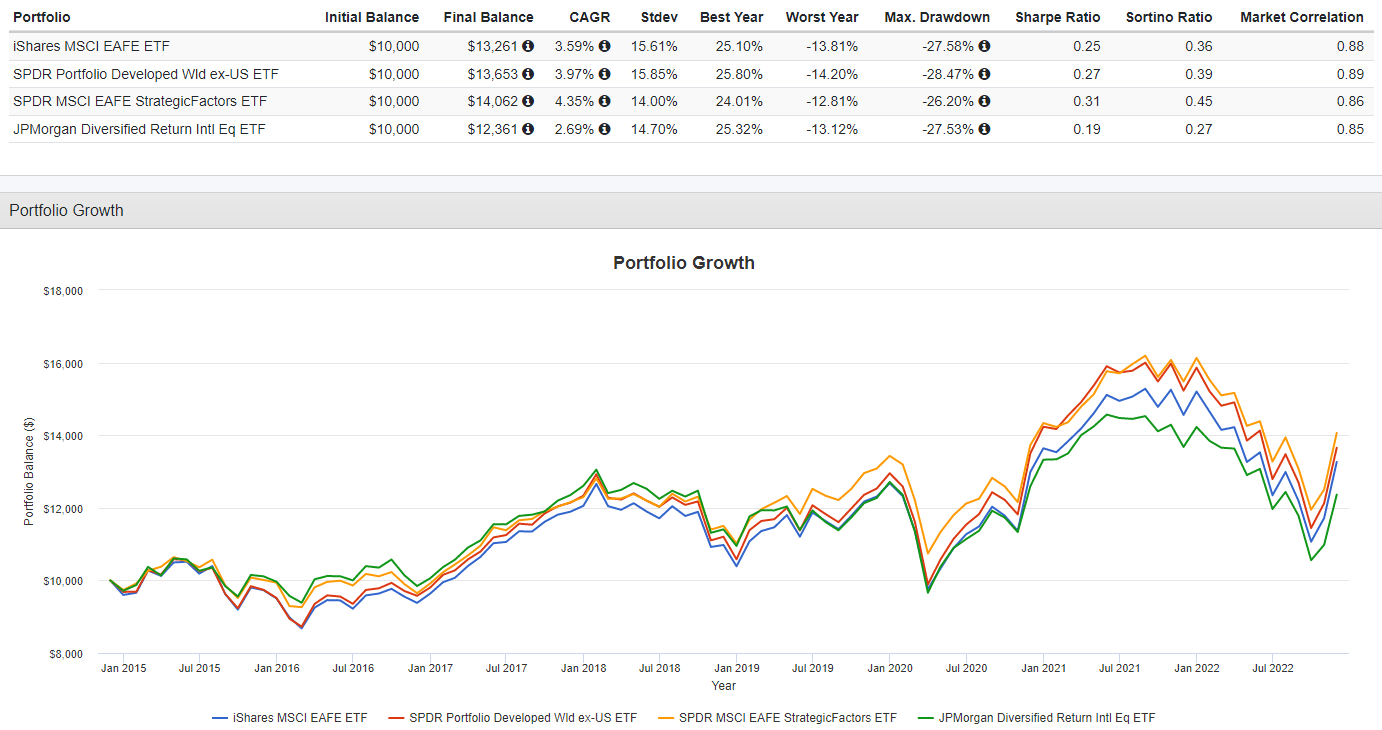
Final thoughts
At least between IHDG and IQDG, hedging seems to work regardless of how the USD is performing against the world’s major currencies. Second, index construction effects how the unhedged international developed market ETFs performed. Since both sets are outperforming JPIN, I would consider selling JPIN and reinvesting in another ETF in that market segment.
For another view on JPIN, this article was just published: JPIN: Global ETF Investing In Low-Risk Value Stocks, Generating Strong Returns
Be the first to comment