

Alex Wroblewski
Mr. Dimon and Friends Go to Washington
Jamie Dimon of JPMorgan Chase & Co. (NYSE:JPM) and the CEOs of six other large banks will be in Washington DC September 21-22 meeting with committees of the U.S. Senate and House of Representatives.
Seeking Alpha’s headline describing the event notes that “JPMorgan’s Jamie Dimon to push back at higher capital requirements at hearing.”
Good for him.
Americans should appreciate his courage. And his facts.
My July 15 article highlighted Dimon’s concerns. Here are a few of his comments from the bank’s 2Q earnings call:
“And we don’t agree with the stress test. It’s inconsistent. It’s not transparent. It’s too volatile. It’s basically capricious arbitrary.”
“And now we spend all the time talking about these ridiculous regulatory requirements.”
“Let me state very simply for you. In COVID, we got to 15% unemployment within three months. And in two quarters, we added $15 billion, which we can easily handle. That is clearly — I would put that almost out of the worst case.”
“We intend to drive that SCB (stress capital buffer) down by reducing the things that created it.”
“We’re probably going to drive down mortgages, and we’ll probably drive other credit too that creates SCB.”
“This got bad effects for the economy because — I just said, we’re going to drive down this and drive down. It’s not good for the United States economy.”
Fact #1: Bank Accounting is Arcane
To be an informed investor in banks, investors need to understand at least the basics of bank accounting.
Most importantly, investors need to know that provision expenses is a non-cash event that increases and decreases a bank’s Allowance for Loan and Lease Losses (“ALLL”) based on perceived risk of loss as determined by bankers, regulators, and ultimately outside accounting firms.
Also important, investors need to know that measuring capital is as much art as science. That is why regulators have at least five capital ratio standards.
For a detailed discussion of bank capital history, see the first two chapters of my 2016 book about bank investing.
Fact #2: History of Bank Capital 1984-2022
Below is a run-chart showing total capital in the U.S. banking system from 1984 to Q2 2022.
Note: Trend is steadily up. We will examine 2008-2009 numbers more closely shortly.
Total Bank Capital US Banking System (FDIC)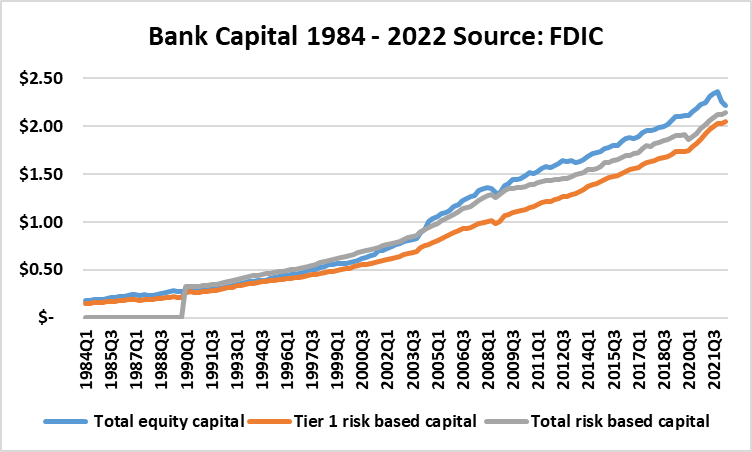
Here is another view of the same data, this time showing capital as a ratio of various categories of assets. Headline observations:
- Capital ratios for U.S. banks have trended up over the past four decades.
- Capital ratios spiked in 2020-21 because of two factors:
- A new accounting standard known as “CECL.” (Don’t get me started on this subject).
- COVID worries prompted banks to pump up Loan and Lease Loss Allowances (ALLL).
- The decline in capital ratios at year-end 2021 into 2022 is because banks (to be technically correct, outside audit firms) reset Loan and Lease Loss Allowances to reflect a lower risk environment. In other words, banks were perceived to be over-capitalized.
Bank Capital Ratios (FDIC)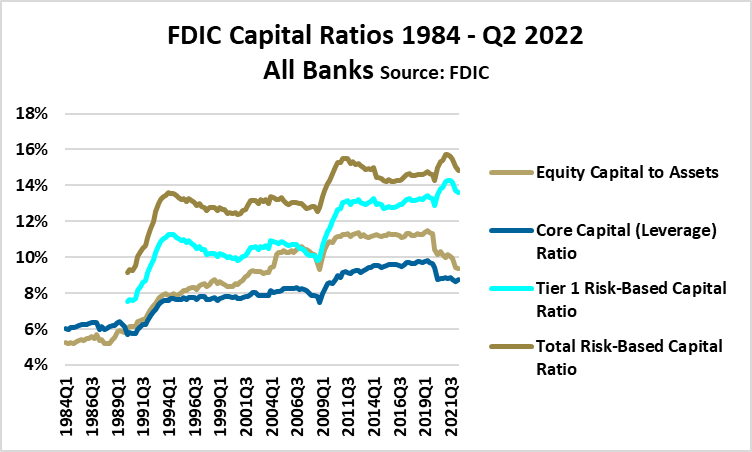
Fact #3: 2008-2009
Banks almost went out of business in 2008-2009 during “The Great Financial Crisis,” right?
Well, in a word, no.
I prefer to call this time in American financial history, “The Great Panic,” not the “Great Financial Crisis.”
That’s how Mervyn King, former governor of the Bank of England, labeled the 2008-2009 time in his 2016 book, “The End of Alchemy.”
Investors looking for the best book on global banking during 2008-2009 are well-served reading King’s book. The other book I recommend is Laurence Ball’s “The Fed and Lehman Brothers,” also written in 2016.
The next chart shows bank earnings by quarter from 1984 to Q2 2022.
Net Income All Banks (FDIC)
Let’s zero in on bank earnings from Q4 2006 through Q4 2010. This is when, popular legend has it, that the U.S. banking system, if not the global system, nearly failed. Note:
- U.S. banks lost money in aggregate during four of the five quarters starting in Q4 2009.
- During those five quarters, after-tax earnings totaled $-54 billion.
- While -$54 billion is a lot of money, the aggregate loss must be viewed in context:
- In 2007 banks earned $102 billion, nearly twice the loss from Q4 2008 to Q4 2009.
- In 2010, banks earned $83 billion.
- In other words, while the losses were material, those losses were less than the earnings immediately before and after the Great Panic.
Net Income (FDIC)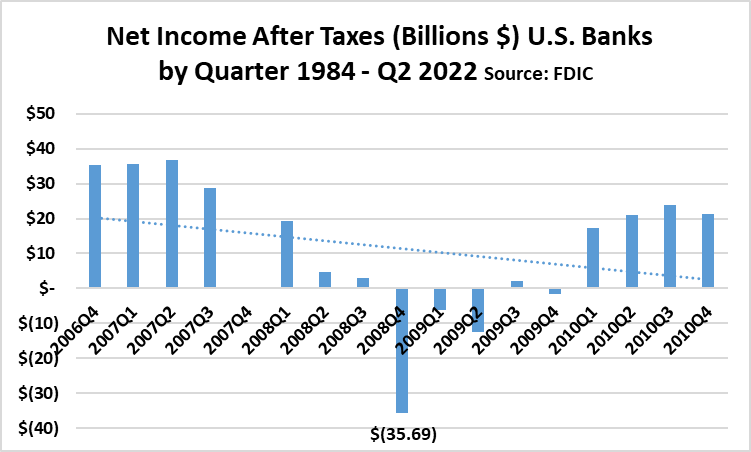
Bank capital ratios from 2006 to 2014 are worth examining.
While there are at least five capital ratios used by global regulators, my experience is that the ratio that matters most is the Tier-1 Ratio that captures tangible capital plus ALLL as a percentage of “risk” (loans plus some types of bonds) assets.
Note that the Tier-1 Ratio declined to its low of 9.79% on September 30, 2008. You may recall that in early September of that year, Lehman failed, and Merrill Lynch sold itself to Bank of America Corporation (BAC). In early October, an arguably inexperienced FDIC chair further terrified Americans by three actions that the historic record show she accomplished unilaterally:
- Attempted to hand Wachovia Bank off to Citigroup Inc. (C), a move ultimately frustrated by the reality that Citi was sicker than Wachovia.
- Handed off Washington Mutual to JPMorgan Chase, a move well-documented and reviewed in Kirsten Grind’s 2012 book, “The Lost Bank.” Grind revealed in the book that the FDIC has refused to release certain key documentation associated with this hand-off until 2059. You have to wonder why?
- Successfully gave Wachovia to Wells Fargo & Co. (WFC), an action that made Wells a ton of money for the next six years as Wachovia loans which had been charge-off as part of the deal, were subsequently collected and boosted earnings. I contend that Wells made so much money on the Wachovia deal that it grew fat and happy, a state they remained in until 2015-20 when their over-confidence and what I’d call lazy governance came home to roost.
Capital Ratios 2006 – 2010 (FDIC)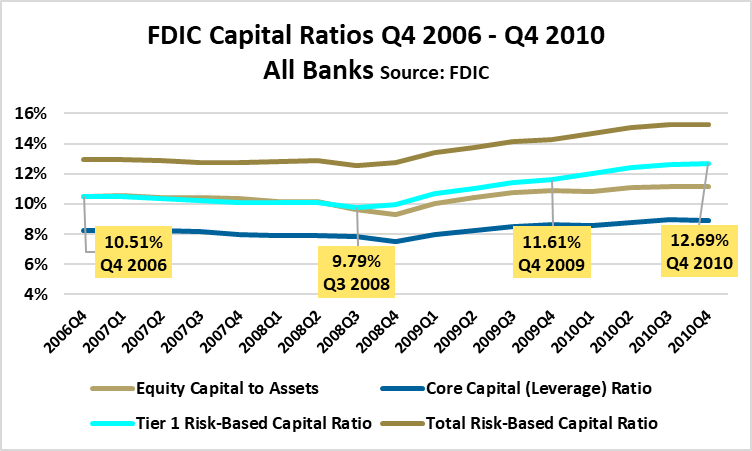
Fact #4: Bank Capital, Loans, and Provision 2008-2014
These next few charts get to the heart of Dimon’s 2022 concerns.
Dimon likely recognizes that politicians (and regulators directed by politicians) are prone to forget banking history. (My 2013 book about modern U.S. banking history has a chapter devoted to this theme.)
Between Q3 2008 and Q4 2014, the industry’s Tier-1 Ratio increased 315 basis points (from 9.49% to 12.94%), equivalent to a 36% increase in bank capital. No question, this is a material jump in capital.
Bank Capital Ratios (FDIC)
How did the banks accomplish the 36% increase in capital?
No, the answer is not TARP. Yes, some of it, came from new investor capital. But most came from a combination of retained earnings, and very importantly, from low growth in risk assets (the denominator in the equation).
Examine this next chart that shows Net Loans for U.S. banks by quarter from Q2 2008 to Q4 2014.
- Note that loan balances dropped almost 10% from 2008 to YE 2009.
- Loan balances did not climb back to Q2 2008’s $7.85 trillion until the second quarter of 2014.
- A key to the industry’s ability to improve its risk capital from 2008 to 2010 was a reduction in risk assets, aka, loans.
- When banks’ appetite for lending wanes, so too does the economy, which grew sluggishly during these six years.
Total Loans 2008 – 2014 (FDIC)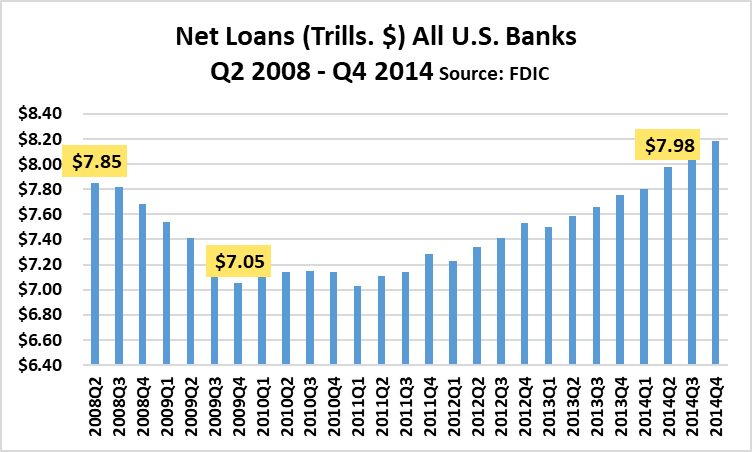
Closing Thoughts
Politicians love banks.
Hearings make for wonderful theater.
Occasionally, a lawmaker reveals the true depth of their knowledge about banking.
Maxine Waters (Dem. CA) chairs the House Financial Services Committee. In a 2016 hearing, she pushed the CEOs of the big banks to justify their abysmal performance in student lending, which had left millions of Americans bereft in debt.
Check out YouTube as one CEO after another calmly informs Congresswoman Waters that their bank had not been involved in student lending since 2010 when the Obama administration took it over under the promise of making the government a lot of money.
Just imagine: If the chair of the House Financial Services Committee did not know the facts about student lending, what are the chances she and other lawmakers might not know the facts about bank capital?
One last chart that I suspect most politicians and a few investors don’t know: If there is an issue facing Congress, the issue should not be increasing bank capital, but increasing lending. Bank loan-to-deposit ratios are near record lows.
Jamie Dimon understands this fact. And he also knows that a big push on bank capital will lead to unintended consequences.
Good news, at least for depositors, is that this ratio will increase as deposits flow out to higher-yielding safe investments, which can include short-term Treasuries yielding 3%+.
Loans to Deps. (FDIC)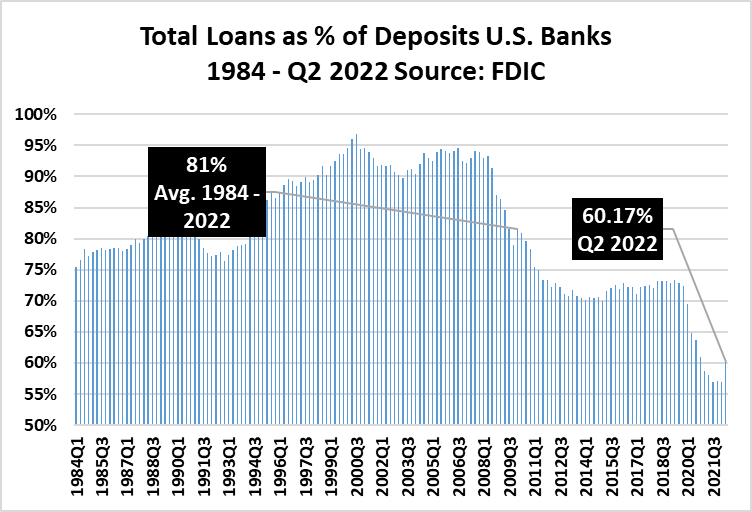
What’s an investor to do?
- Get the facts.
- If you don’t have time for the facts about bank accounting and capital ratios, avoid banks.
- Beware peddlers of books and articles crying out doom and gloom.
- Beware politicians claiming expertise in setting bank capital ratios.
- Don’t let political bias color investment judgment.
- Take advantage of the times when “Mr. Market” goes running around like the world is about to end; such times almost always suppress bank valuations.
I like JPM and BAC as long-term buy-and-holds as I have written recently on these pages. However, patience is advised. My view is that big banks are not cheap today. Same is true for Mid-Caps.
(I will be addressing Small-Cap valuations in the near future.)
Do your homework before investing in a bank.
Understand your tolerance for risk, which can include volatility in bank stock prices not only tied to swings in the economy but political swirl.
Be the first to comment