

feedough/iStock via Getty Images
Thesis
The Dogs of the Dow strategy (detailed in the second section) refers to the buying and holding of the 10 stocks that have the highest dividend yield from the Dow Jones Industrial Index. Banks typically do not make it to the Dogs of the Dow list. The list is frequented more often by stocks in sectors that historically feature higher payouts, such as telecom (such as Verizon), healthcare (such as Walgreens and Amgen), or commodity-oriented stocks (such as Chevron and Dow). Banking stocks, on the other hand, have historically paid dividends that are near or below the average of the Dow index, let alone close to the top. For example, the average dividend yield from JPMorgan Chase (NYSE:JPM) has been around 2.6% in the past decade, slightly above the average dividend yield of 2.1% from the Dow Index. And the average dividend yield from Goldman Sachs (NYSE:GS) has been around 1.5% in the past decade, below the average dividend yield of the Dow Index.
However, as you can see from the chart below, this month, both JPM and GS have become the Dogs of the Dow. They are currently the 8th and 10th highest-yielding stocks on the Dow list. As such, I am assuming that they have appeared on the radar of many dividend investors. And the goal of this article is to show:
- The Q3 banking earnings season may create further price volatility and attractive valuation for both stocks. A total of six major banks including JPM announced their quarterly results last week. And without surprise, all anticipated headwinds ahead from high U.S. inflation, slowing housing market, and interest rate raises. The Q3 earnings announcement for GS is scheduled on Oct 21, 2022.
- To wit, investors should watch out for the update in GS’s tangible book value (“TBV”) and also the opportunity to buy GS near its tangible book value. For JPM, I expect the incoming market volatility to bring its stock price to about $100 (approximately its TBV plus 10 times its dividends).
Source: www.dogsofthedow.com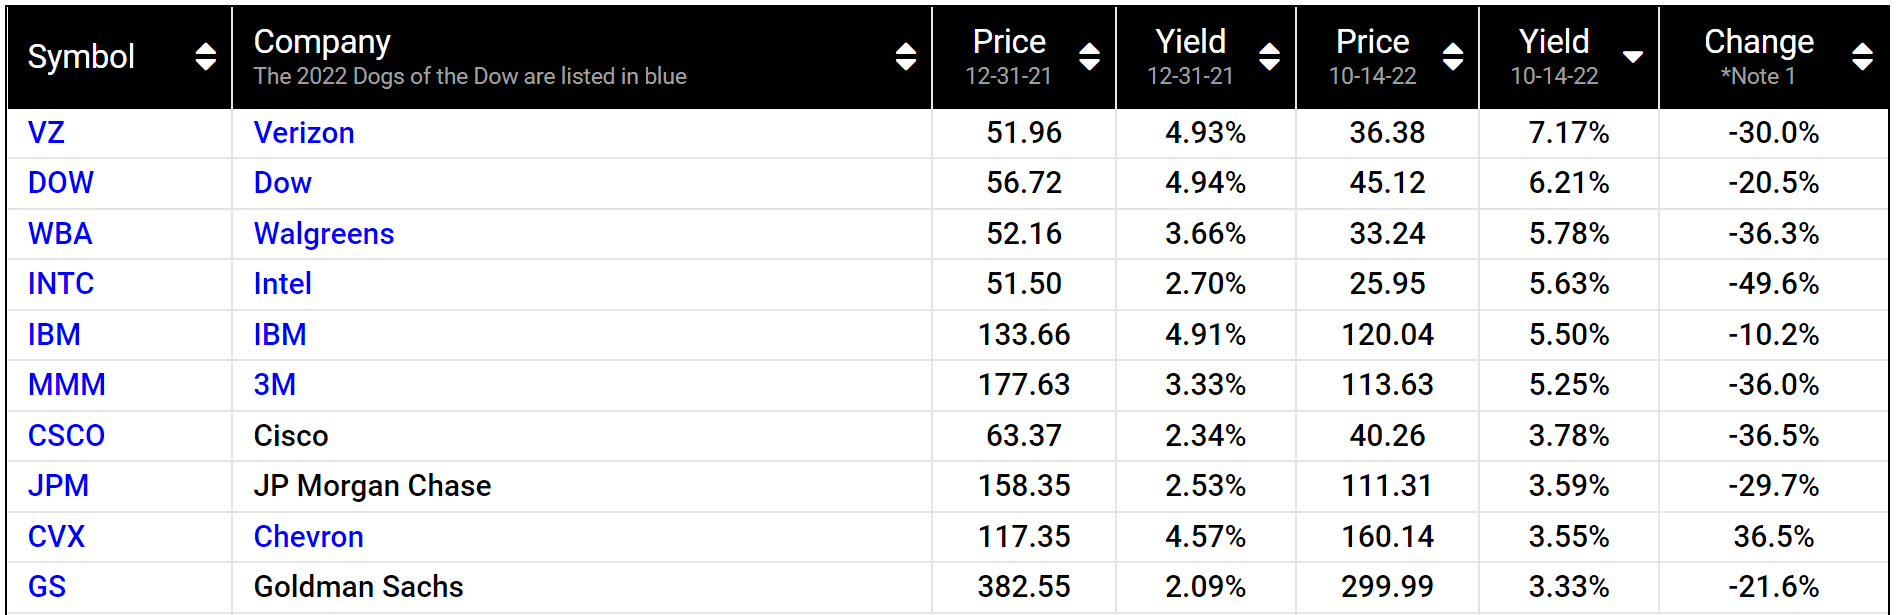
The Dog of The Dow method and how did it perform?
For readers unfamiliar with the Dog of the Dow strategy, the method involves a few simple steps as detailed by this website:
- Selecting several (say 10) stocks that have the highest dividend yield from the Dow Jones Industrial Index
- Holding them for a period of time (say one year)
- Repeating (or balancing) based on steps one and two.
It has been shown to be a simple yet effective way to systematically invest in undervalued and prominent dividend stocks. The below plot shows the performance of this method since 2007. According to Investopedia:
The chart compares the strategy to simply holding the Dow Jones Industrial index (“DJIA”). As seen, the strategy lagged the DJIA after the 2008 crash till 2010. Then it recovered and has been outperforming DJIA consistently since then. According to Investopedia.com, $10,000 invested in DJIA from the beginning of 2008 would grow to $17,350 in 2018. While the Dogs of the Dow strategy would have grown to $21,420.
Source: www.investopedia.com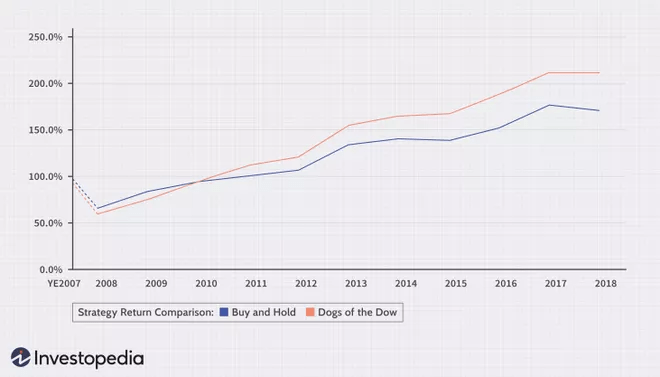
JPM, GS, and the Dow Index
Now back to JPM and GS. As you can see from the following chart, both have been underperforming the Dow index (“DIJA”) due to the headwinds facing the banking sector as aforementioned. To wit, JPM has suffered a total loss of more than 31% in the past year, and GS more than 24%. In contrast, the DIJA index, as represented by the SPDR Dow Jones Industrial Average ETF (DIA), suffered a loss of about 14%. Such large price corrections, combined with their stable dividends, have driven up the yields and sent them to the list as detailed next.
Source: Seeking Alpha data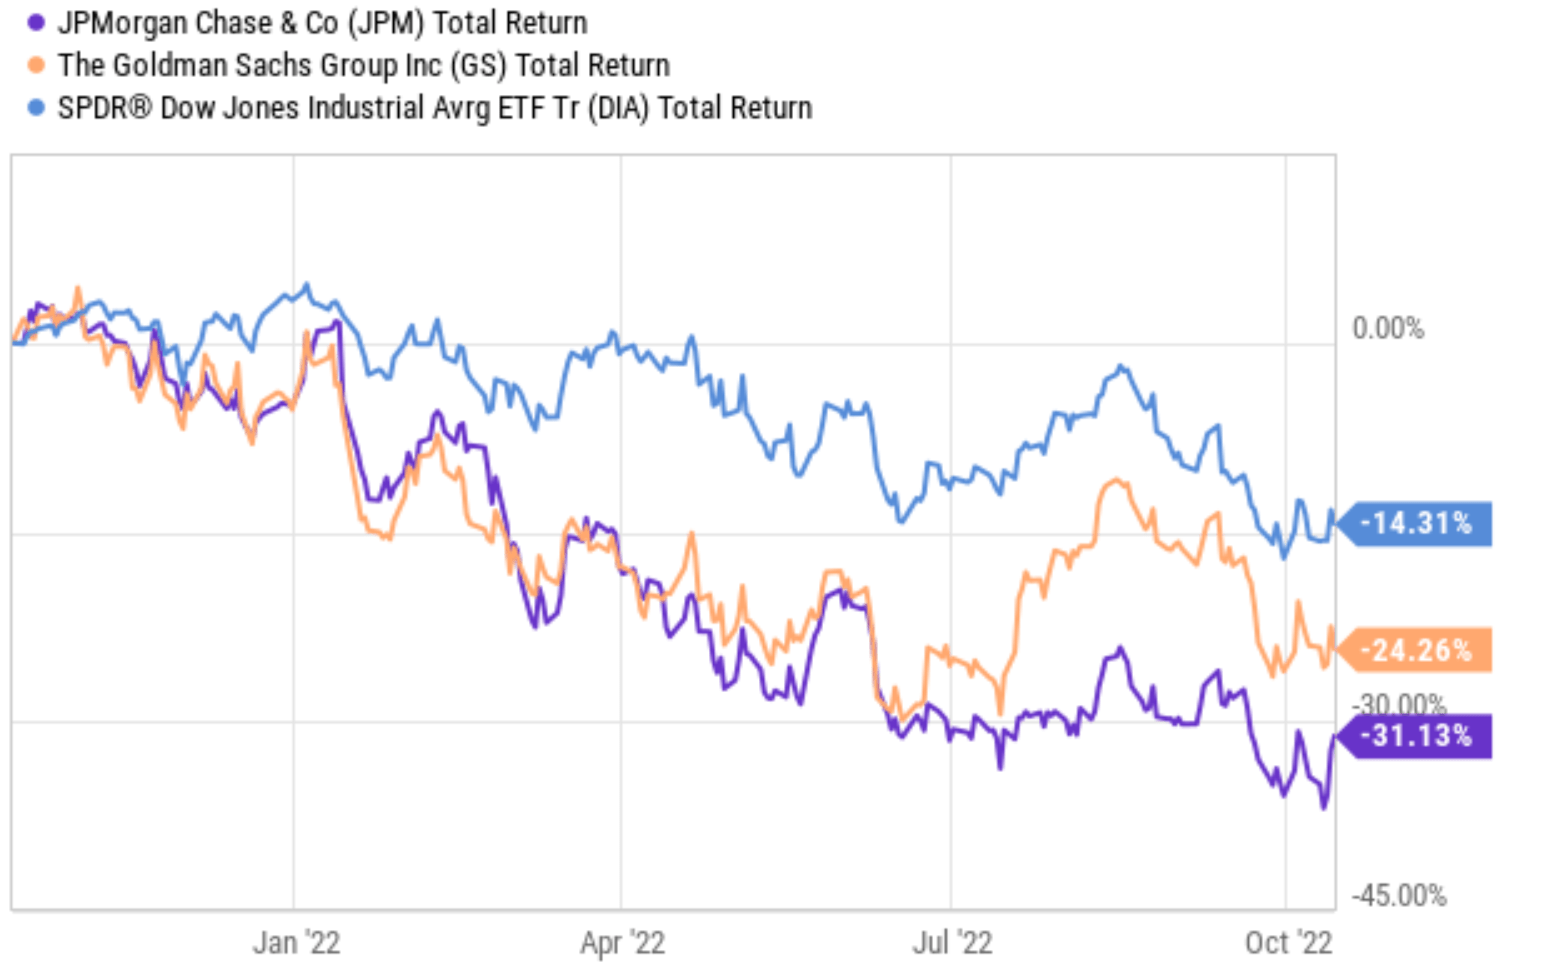
As you can see from the following chart, the dividend yield for JPM is currently 3.6% and GS 3.83%. As mentioned above, these banking stocks have historically paid dividends that are on average near or below the average of the Dow index as you can see. But their current yields are not only substantially above their own historical averages, but also substantially above the DIJA index of 2.1%.
To wit, JPM’s dividend yield has fluctuated in the past 10 years between 1.78% and 4.30% with an average of 2.59%. Its current dividend yield of 3.6% is therefore above its historical average by more than 38% in relative terms and above the DIJA’s 2.1% by a whopping 71%. For GS, its dividend yield has fluctuated in the past 10 years between 1.03% and 3.41% with an average of 1.54%. Its current dividend yield of 2.83% is therefore above its historical average by more than 83% and above the DIJA by almost 35%. By contrast, the DIJA itself is about fairly valued as indicated by the fact that its current dividend yield of 2.09% is essentially the same as its long-term average of 2.1%.
And next, you will see why I anticipate the volatility brought about by Q3 earnings could create opportunities to buy these premier banking stocks at even larger discounts.
Source: Seeking Alpha data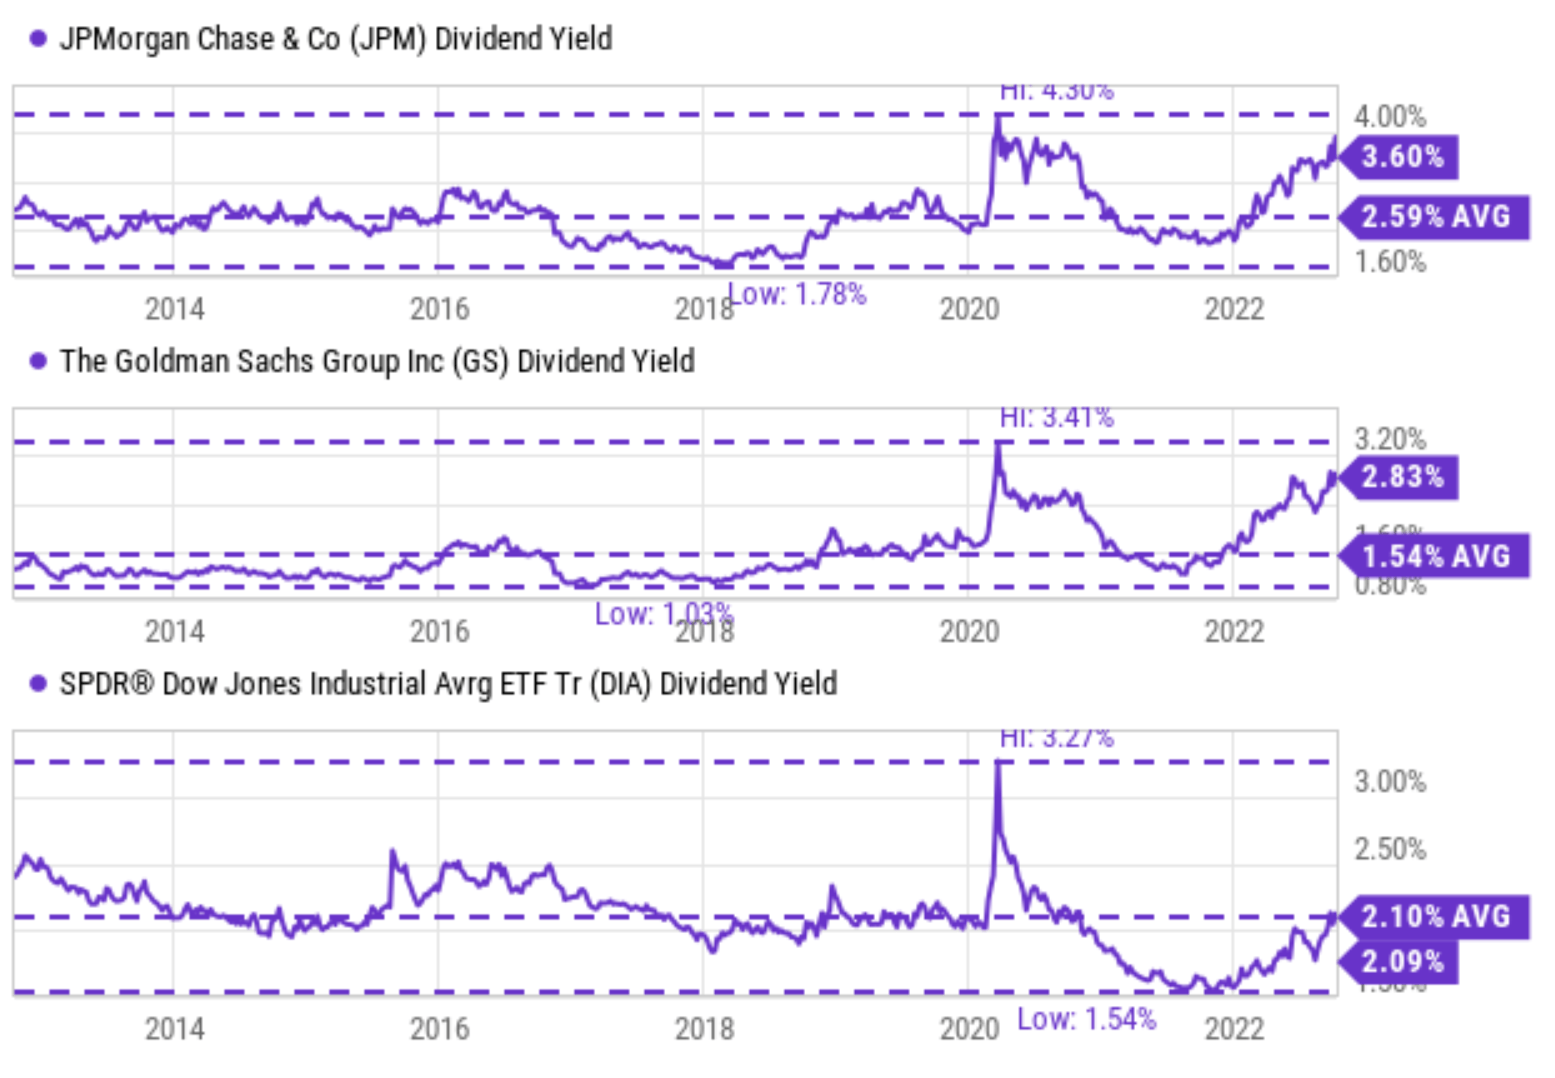
Q3 may offer GS at TBV
Buying good banks (such as GS and JPM) at or near tangible book value has been proven to be very successful investment both in our backtesting and real experiences – for obvious reasons. We are only paying for the tangible book and getting everything else (such as future earning power) for free.
As seen in the chart below, the TBV for GS was $289 as of its more recent earnings report (“ER”), which was its 2022 Q2 ER. Its current price is a bit above its TBV (by about 5.5%). Although, we have to be aware that book value is a moving target itself. When GS announced its Q2 book value of $289 per share, the number was delayed already, and the number kept changing with market conditions. So we will be watching closely for its updated TBV during Q3 ER. And historically, the price volatility of GS is quite high so I suppose its stock price moves more than the book value as I’ve argued in an earlier article, creating buying opportunities near or even below its TBV.
Source: Seeking Alpha data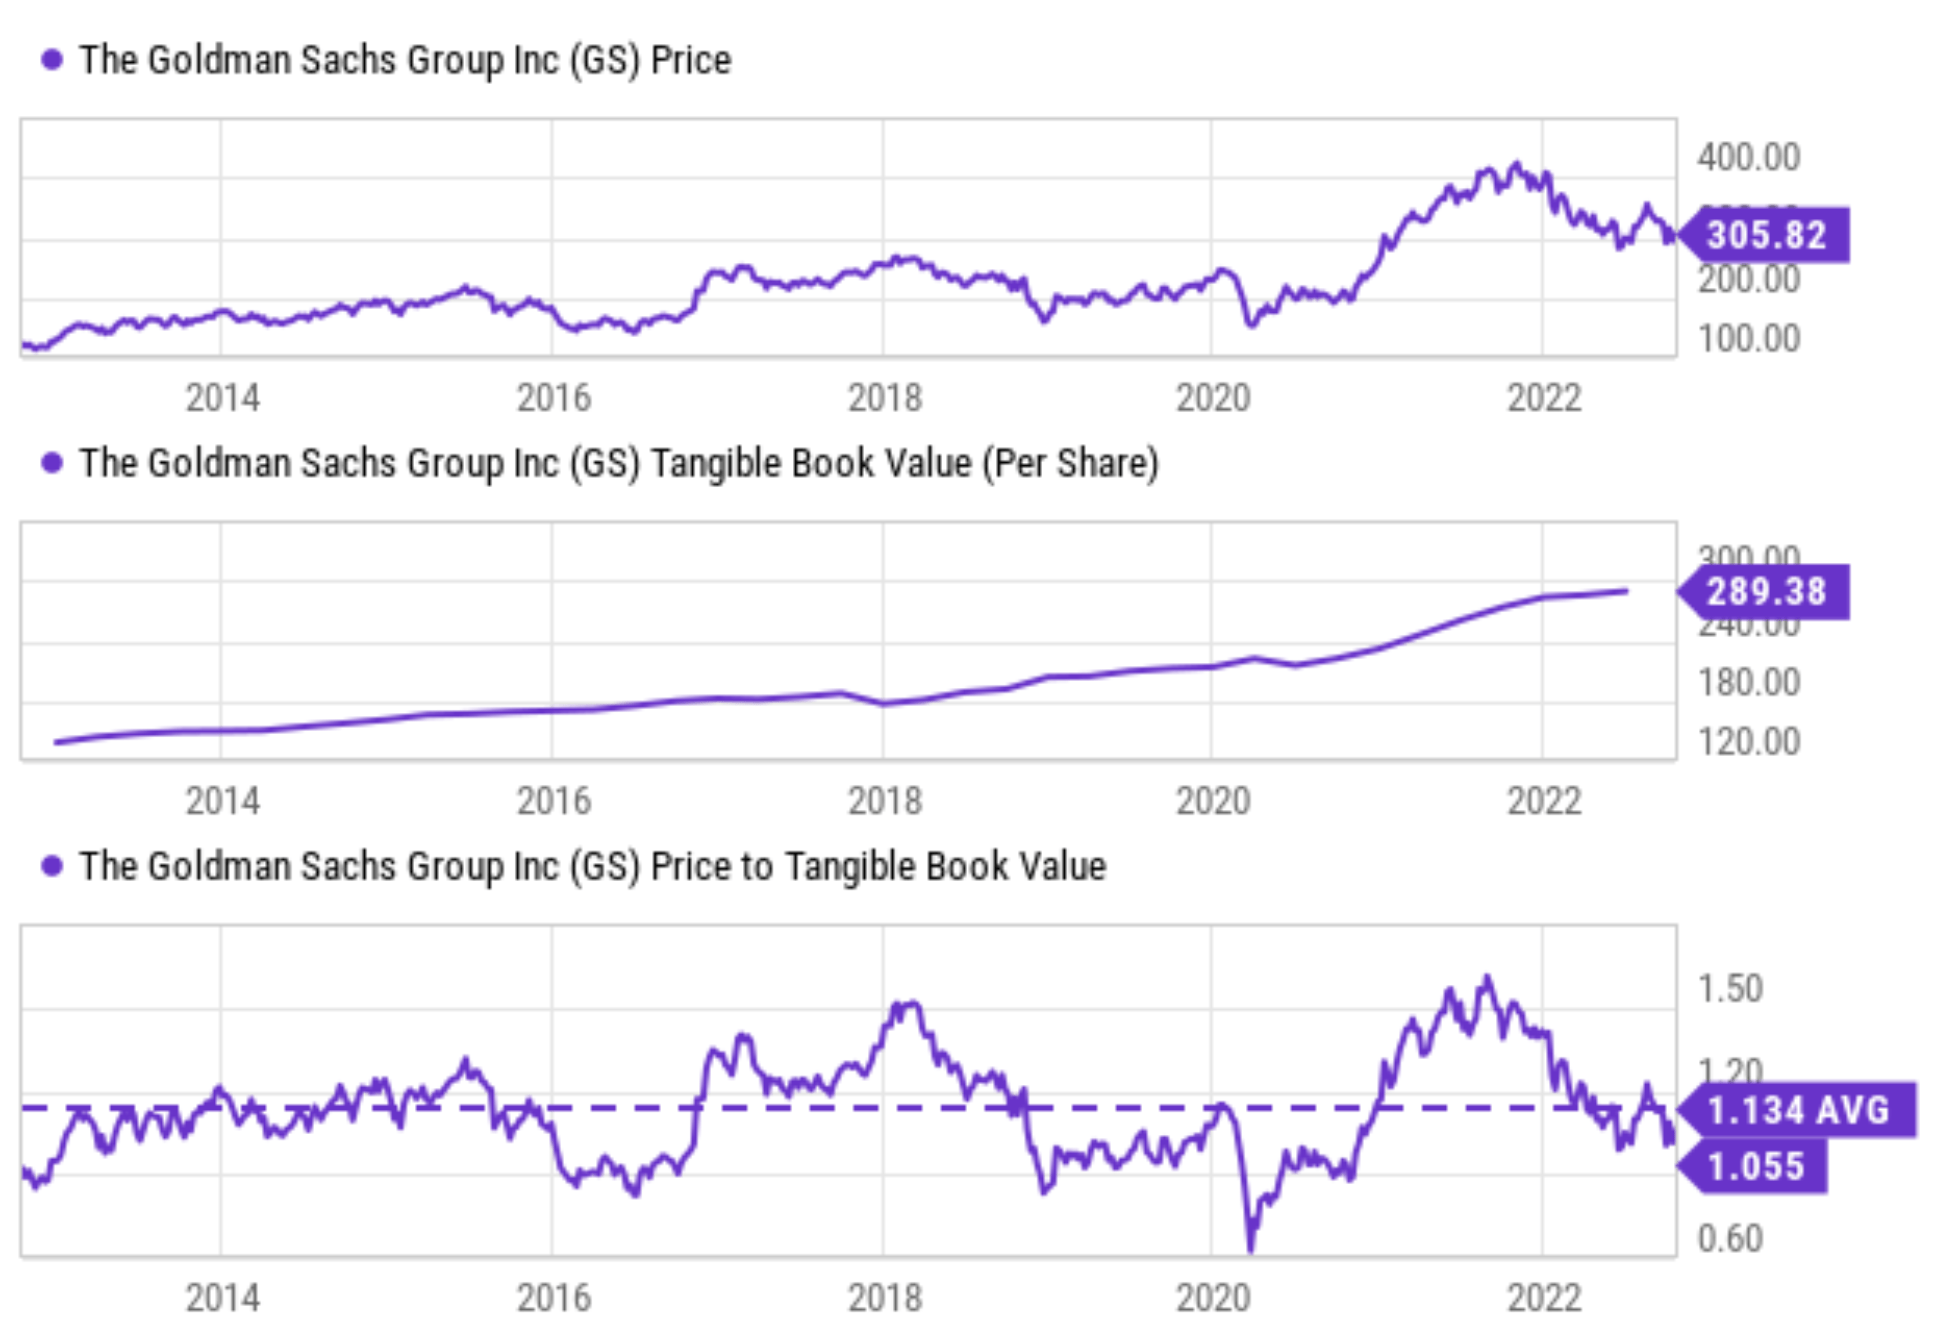
JPM target price of $100
For an integrated bank like JPM, it is rarely for sale at tangible book value (or even just book value). Investors are willing to pay a premium for the extra safety enabled by its diversified revenue streams and the lower volatility risks. More specifically, as you can see from the following chart, JPM has been valued at an average of 1.76x of its TBV in the past 10 years. The multiple fluctuated between 1.125x to as high as 2.59x. So even at its worst times during a decade (around 2014 amid the European banking crisis), it was still traded more than 10% above its TBV.
Source: Seeking Alpha data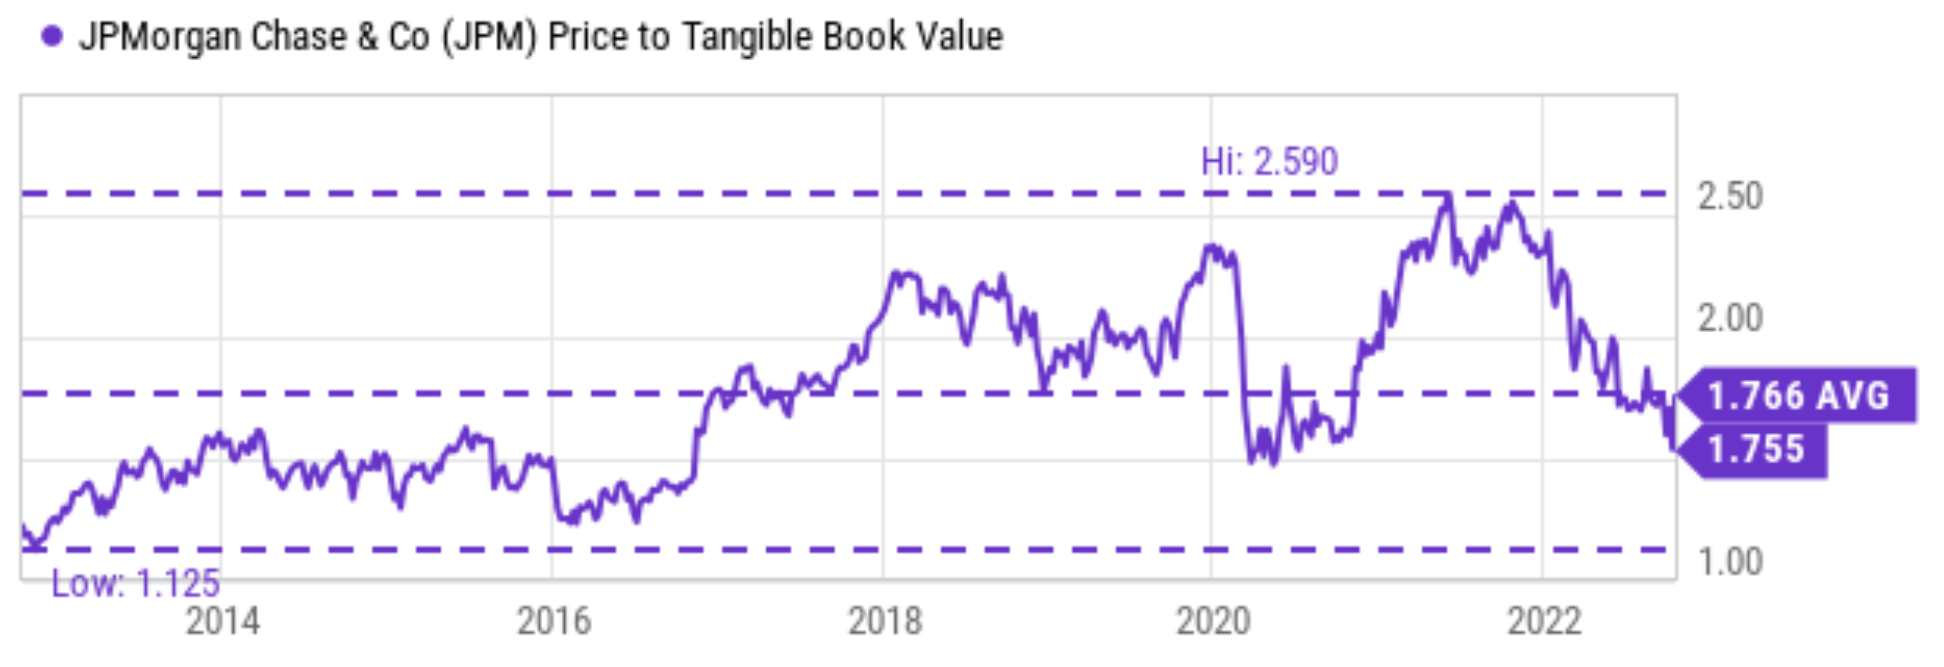
So, the next logical question is then: how much premium should we pay for JPM? A very intuitive and effective approach that we use ourselves for banking and REIT stocks is to add 10 times its dividend income to the TBV. That is, a 10x dividend is the maximum premium we are willing to pay on top of the TBV. The details are provided in my earlier articles, and a summary is provided here to facilitate this discussion:
- If you think like a long-term business owner (instead of a stock trader), then investing in these stocks is nothing more than buying a piece of assets (monetary capital in the case of banks or real estate int eh case of REITs) to collect income (interests for banks and rents for REITs). So the investment value consists of two parts: the value of the property itself and the future rent.
- Our valuation method approximates the first part by its book value and the second part by 10x of its dividends. In other words, the investment value (“IV”) of a REIT stock should be: IV = BV + 10 x dividend
- This method offers the advantage of valuation anchored in the most easily obtainable data with the least amount of uncertainty: BV and dividend. In investing, we always prefer the use of a few data points that are more reliable than many data points that are less reliable.
The following chart shows the results of this method applied to JPM since 2010. As you can see, it captured the lower bound of its market price very accurately in the long term. Whenever the prices dipped to be near or below the IV, historically these prices have been excellent entry points.
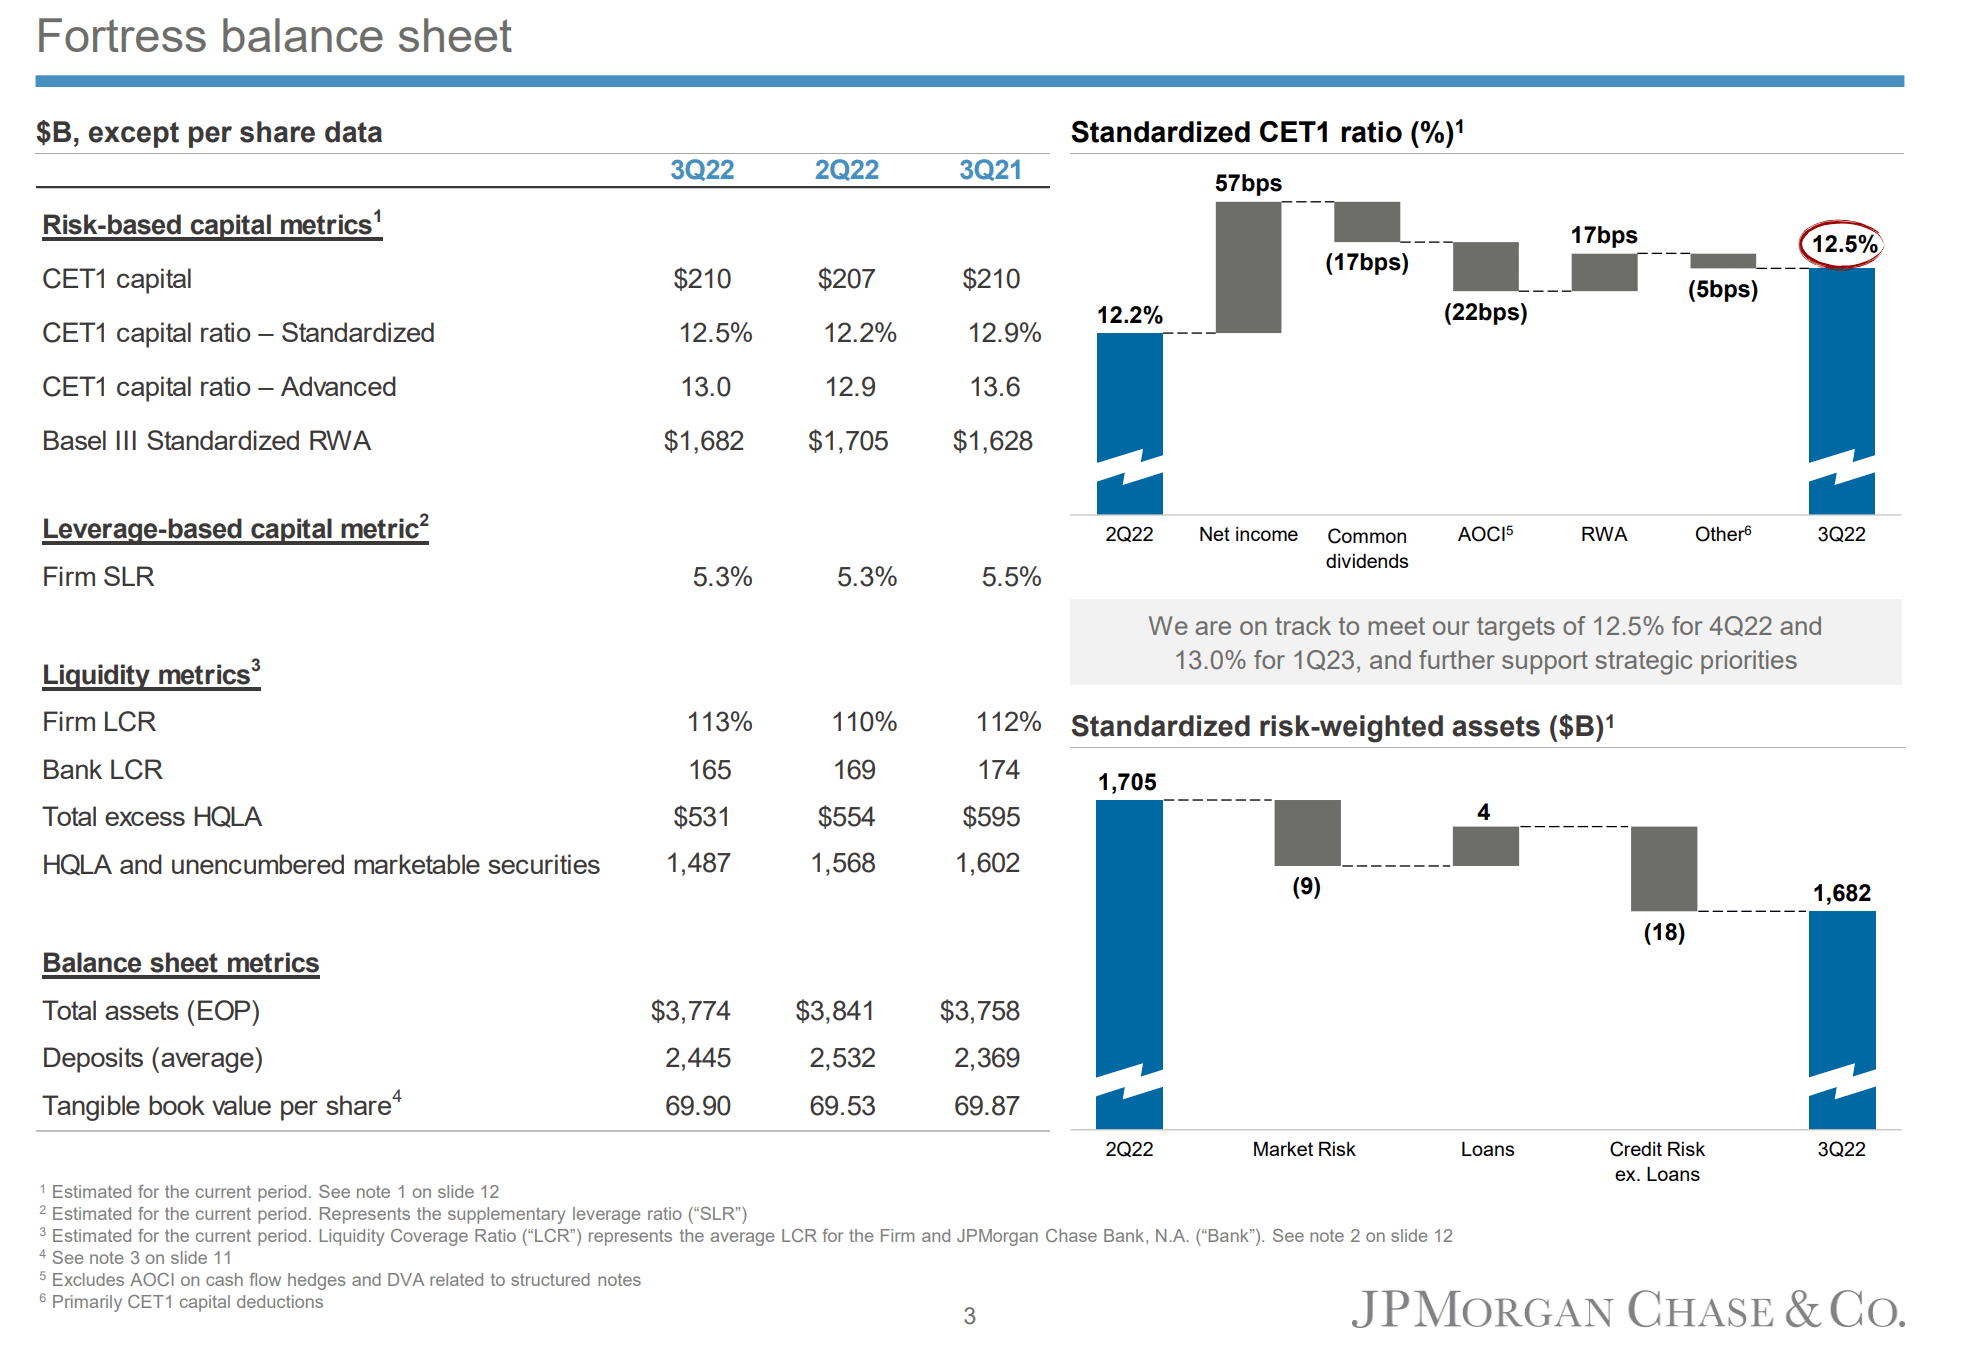
Currently, its latest TBV reported from its Q3 earnings is $69.90 per share (see the second chart below). With its $4 annual dividend per share, the IV works out to be about $118. And its current price of $111 is essentially on par with its IV (about 6% lower). However, as mentioned above for the case of GS, the TBV itself is a moving target and its current TBV may not be $69.90 per share anymore (or won’t be $69.90 at the time your order is triggered). So to leave some margin of safety, we are targeting an entry price of $100 (to allow about ~10% of margin of safety).
Source: Author based on Seeking Alpha data Source: JPM Q3 ER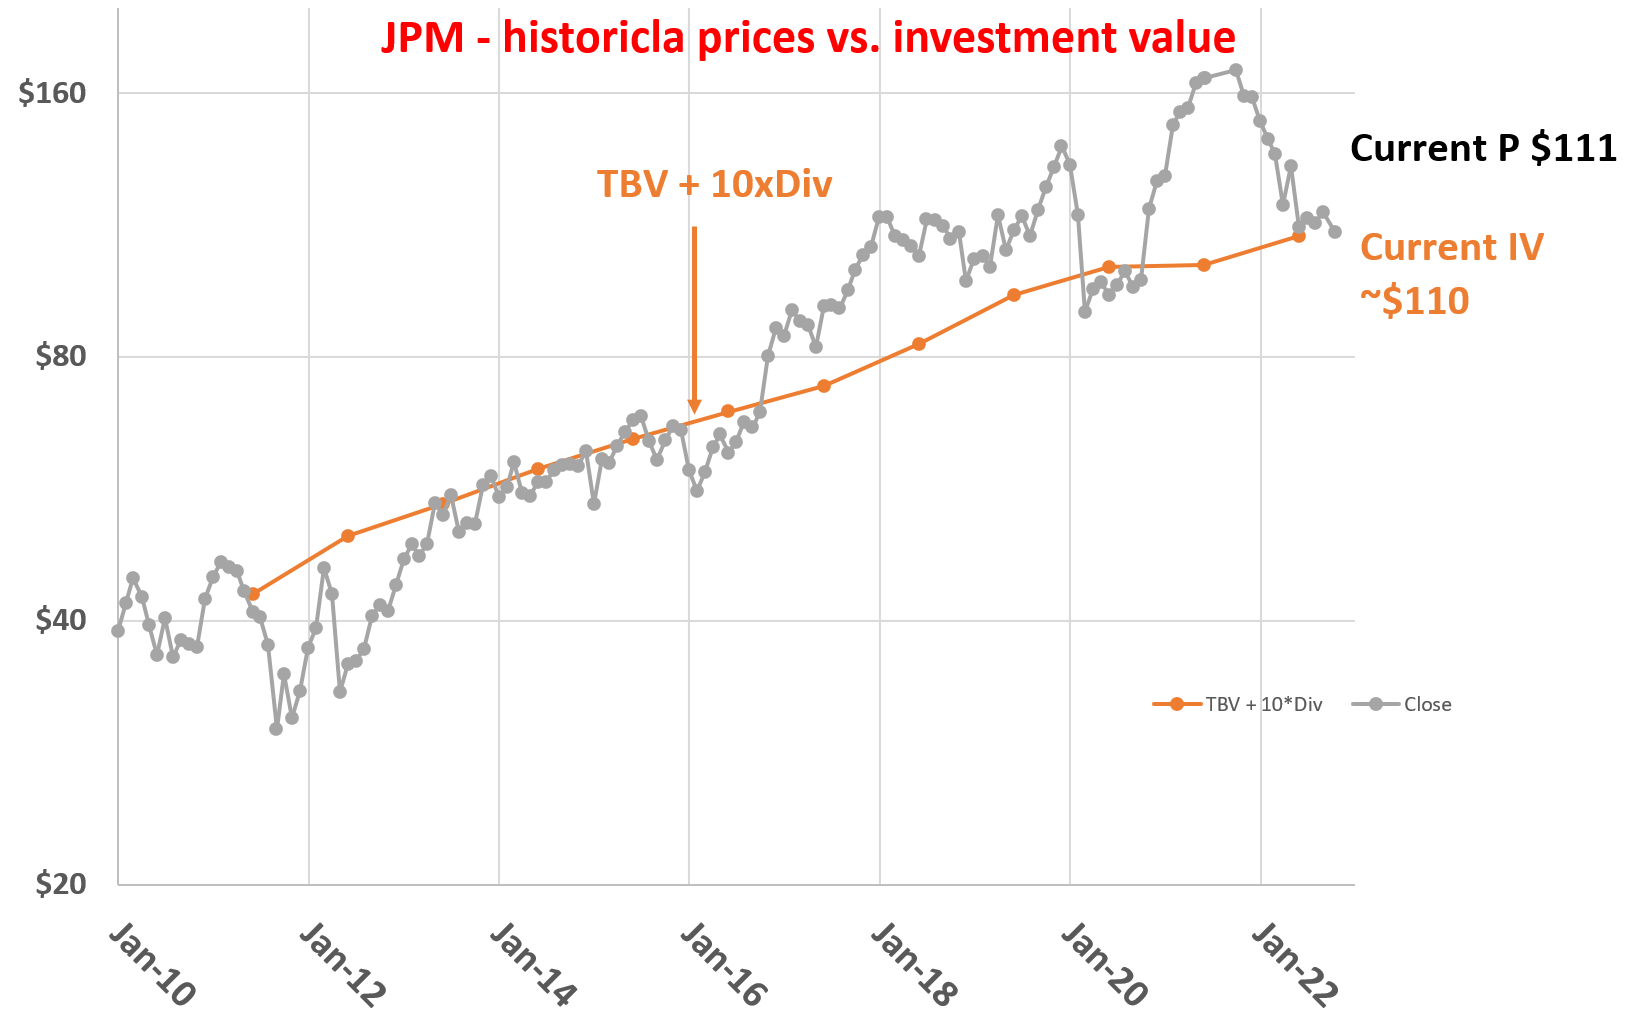
Summary of risks and final thoughts
To summarize, the banking sector now faces several macroeconomic risks such as high U.S. inflation, a slowing housing market, and interest rate increases. And the earnings reports from six major banks last week reiterated these risks with no surprise. During the reports, both the CEO of Wells Fargo (Charlie Sand) and the CEO of JPM (Jamie Dimon) cautioned investors about the possibility of a recession in the near future.
Looking ahead, I expect the reports from GS and other major banks to show similar headwinds. And I also expect the Q3 banking earnings season to create further price volatility and offer these premier banking stocks at even larger discounts. The very fact that both JPM and GS are on the Dog of the Dow list already signals large discounts relative to their historical valuations and also relative to the broader market. Further price volatility could offer GS near or below its TBV and JPM around $100.
Be the first to comment