

hyejin kang/iStock via Getty Images
(This article was co-produced with Hoya Capital Real Estate)
Introduction
The past year has not been kind to Fixed Income asset holders as rates have climbed, picking up stream as the FOMC started pushing up the Fed Funds rate. The most recent inflation report had the CPI up 8.3% YOY, causing a 3+% stock market hit when released. Opinions shifted that Fed easing isn’t on the cards.
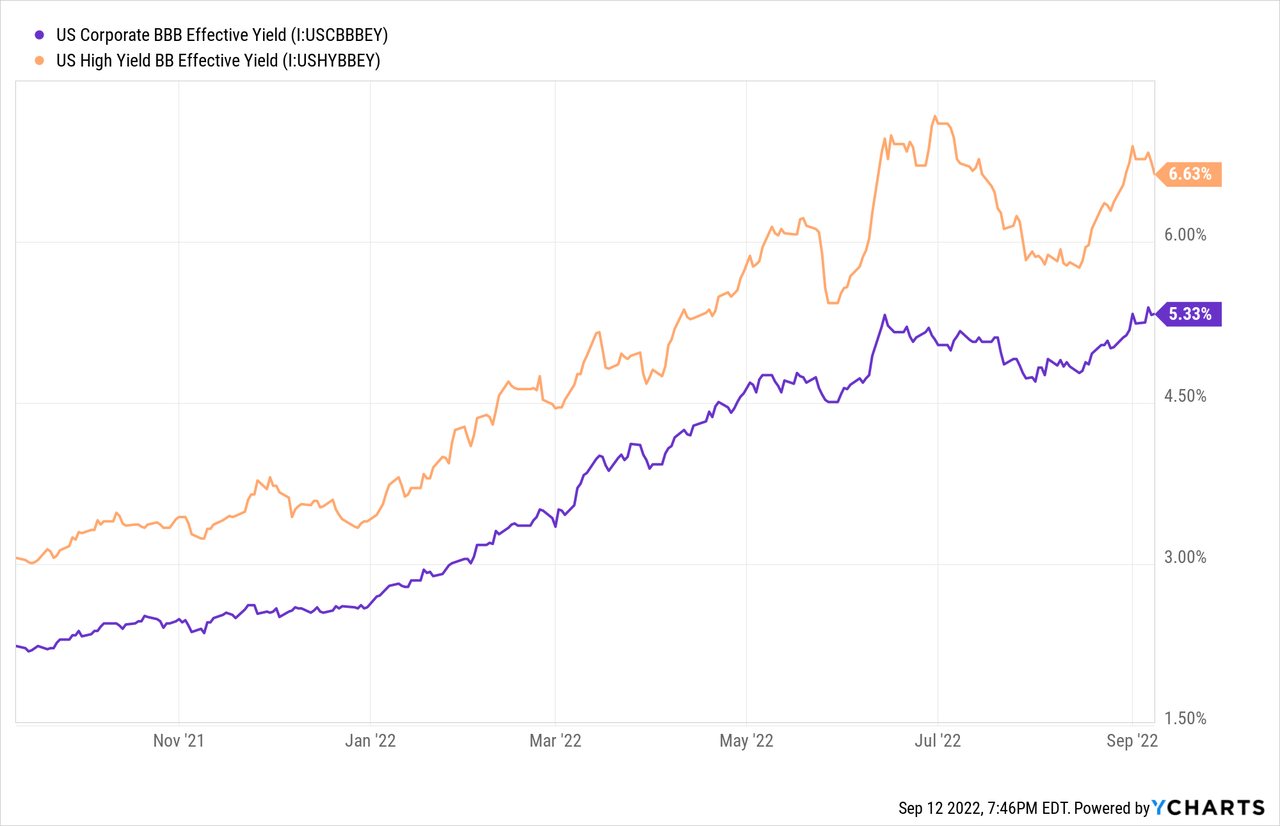
The above two lines represent the vast majority of the holdings of the Nuveen Preferred & Income Opportunities Fund (NYSE:JPC) being reviewed in this article and of the other Nuveen CEFs it’s compared against.
Nuveen Preferred & Income Opportunities Fund review
Seeking Alpha describes this CEF as:
The Fund seeks to provide high current income and secondarily, total return, by investing at least 80% of its managed assets in preferred and other income producing securities, including hybrid securities such as contingent capital securities and up to 20% opportunistically in other securities, primarily income-oriented securities such as corporate and taxable municipal debt and common equity. At least 50% is invested in securities that are rated investment grade at the time of purchase. Benchmark: ICE BofA US All Captl TR HUSD. JPC started in 2003.
Source: seekingalpha.com JPC
JPC has $863m in AUM and shows a Forward yield of 8.2%. Nuveen charges the following fees:
- Management cost: 81bps
- Other expenses: 4bps
- Leverage expense: 42bps
The recent leverage ratio was reported as 37.3% and latest monthly leverage expense was 2.46%. As rates rise, levered funds face higher costs. In August, JPC issued $150m in Taxable Fund Preferred, or TFPs, which they provided this background:
The new TFP Shares were issued with terms establishing an initial Variable Rate Demand Mode (the VRDM-TFP Shares) and a term redemption date of August 1, 2037. VRDM-TFP Share dividends are set weekly at a rate established by the Fund’s remarketing agent, subject to a maximum rate which will increase over time in the event of an extended period of unsuccessful remarketing. The VRDM-TFP Shares include a liquidity feature that allows holders of VRDM-TFP Shares to have their shares purchased by a liquidity provider in the event that sell orders have not been matched with purchase orders and successfully settled in a remarketing. The VRDM-TFP Shares are preferred shares of the Fund and are senior, with priority in all respects, to the Fund’s common shares in liquidation and as to the payment of dividends, rank junior to any borrowings of the Fund and rank on parity with other preferred shares, if any, of the Fund.
Source: documents.nuveen.com TFPs
Nuveen lists these benefits of owning JPC.
nuveen.com JPC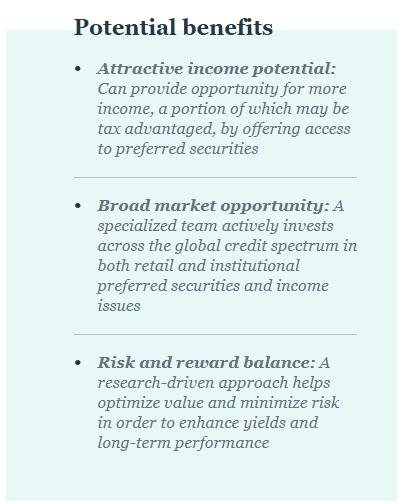
JPC holdings review
I will start the review with the credit ratings of the portfolio.
nuveen.com ratings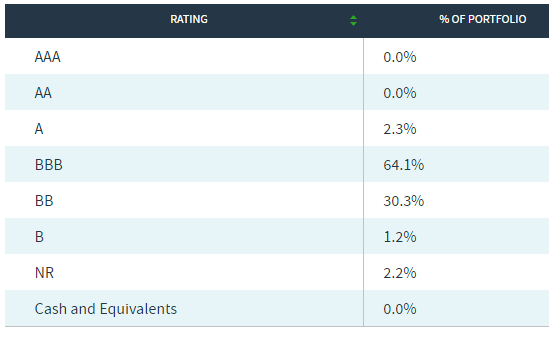
BBB/BB is where the split between investment-grade and non-investment-grade ratings occurs: JPC’s portfolio is mostly in those two rating levels. Nuveen doesn’t go down to the +/- level for each letter rating.
Other than stating that 62% of the portfolio is in US securities, no details are provided for the international 38%. The portfolio holds two kinds of both fixed and floating coupon securities.
nuveen.com types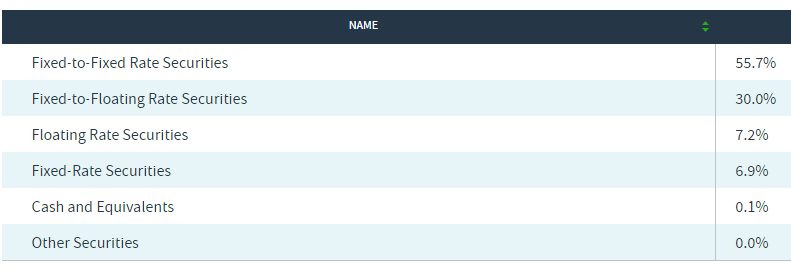
The table did not say if the Fixed-to-Floating only included those that haven’t started floating or not; I suspect not but have no proof. The same would apply to the biggest weighting, the Fixed-to-Fixed securities. In today’s environment, hopefully most of the Fixed-to-Floating securities are in the floating stage.
For JPC, only a Call schedule was provided.
nuveen.com Call schedule
With rates on the upswing, that lowers the odds a security will be called unless the issuer does not need to refinance the asset. As expected, most securities were issued by financial institutions. JPC does own multiple securities from the same issuer, thus the next table shows the highest concentrations.
nuveen.com Issuers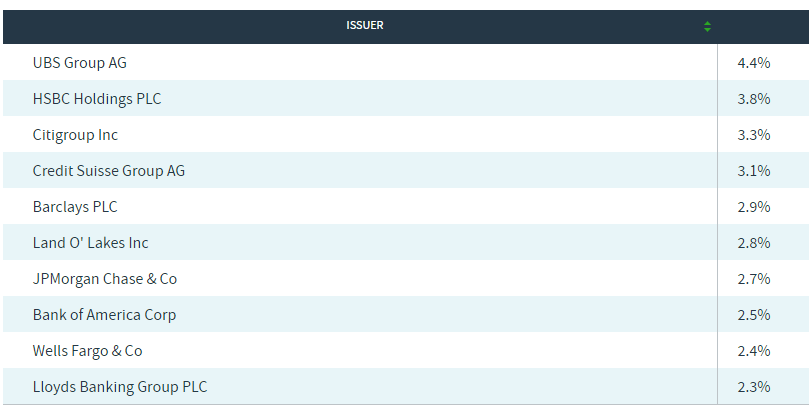
Top 20 holdings
nuveen.com; compiled by Author
Even with 230+ securities, the Top 20 holdings still comprise 27% of the portfolio. Using the data provided, I calculated the WAC to be 6.36%.
JPC distribution review
Nuveen provides some basic facts about the distributions.
nuveen.com distributions
I was able to find coverage data from August 2021 to compare the recent coverage data against.
nuveen.com UNII
seekingalpha.com DVDs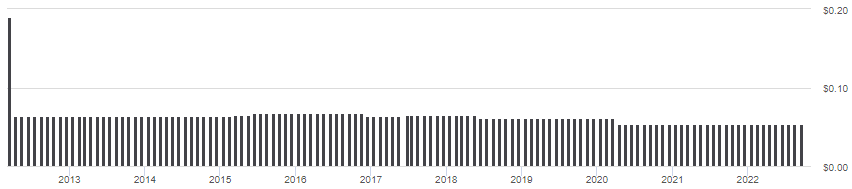
After a small increase in 2017, JPC has reduced its payout twice since, the last time being in April 2020. Nuveen appears to use at least two distribution policies:
- Monthly Level: The goal of each fund’s level distribution program is to provide shareholders with stable, but not guaranteed, cash flow, independent of the amount or timing of income earned or capital gains realized by the funds. Each fund intends to distribute all or substantially all of its net investment income through its regular monthly distribution and to distribute realized capital gains at least annually. In any monthly period, in order to maintain its level distribution amount, each fund may pay out more or less than its net investment income during the period.
- Monthly Managed: The goal of each fund’s managed distribution program is to provide shareholders relatively consistent and predictable cash flow by systematically converting expected long-term return potential into regular distributions. Historical distribution sources have included net investment income, realized gains and return of capital.
I could not find which JPC uses but I suspect it’s the first. More details are provided in their Understanding managed distributions document.
JPC price/NAV review
An important data element for CEFs is its premium/discount history.
cefconnect.com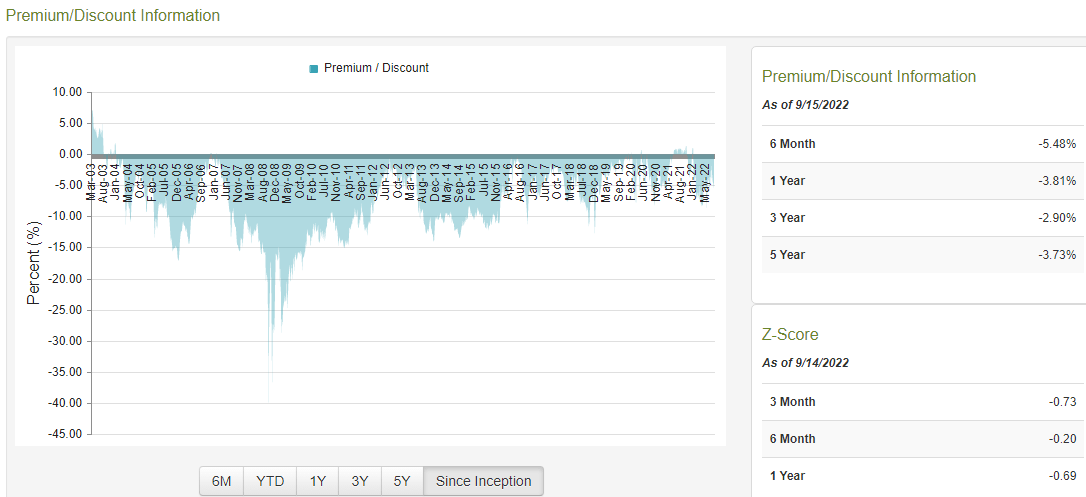
Except for most of 2021, JPC normally trades at a discount, with the current 5.9% discount within the range of “normal”. The Z-scores indicate it’s slightly deeper than that level. Recent deepest discounts have been near 8%.
Nuveen competing CEFs
Nuveen lists four other CEFs within JPC’s grouping: Taxable Fixed Income: Preferreds and Income.
- Nuveen Preferred & Income Term Fund (JPI)
- Nuveen Preferred & Income Securities Fund (JPS)
- Nuveen Preferred and Income Fund (JPT)
- Nuveen Variable Rate Preferred & Income Fund (NPFD)
Author’s note: JPT changed its name and eliminated its 2022 Term provisions.
nuveen.com compare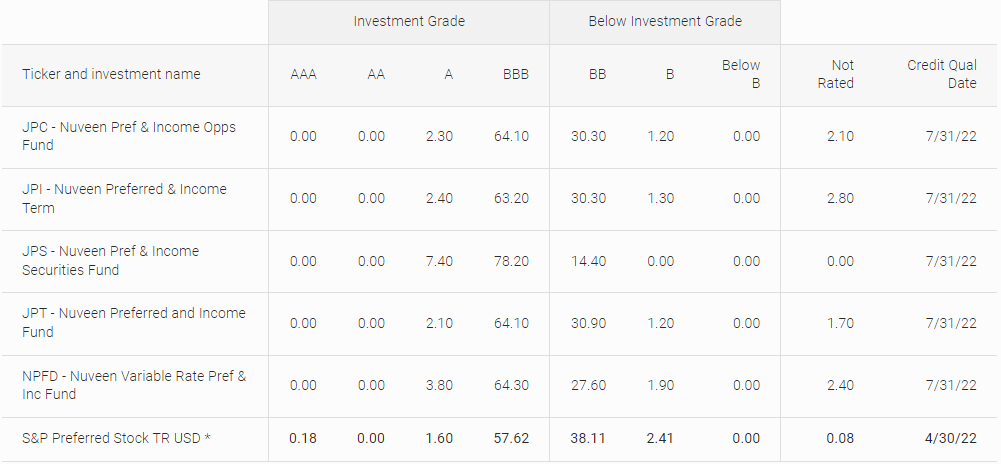
Credit data shows all the CEFs are invested very closely on this statistic. With interest rates rising, JPC is best protected, having the shortest duration. This helps explain why its yield is higher than the others, though all are close.
nuveen.com compare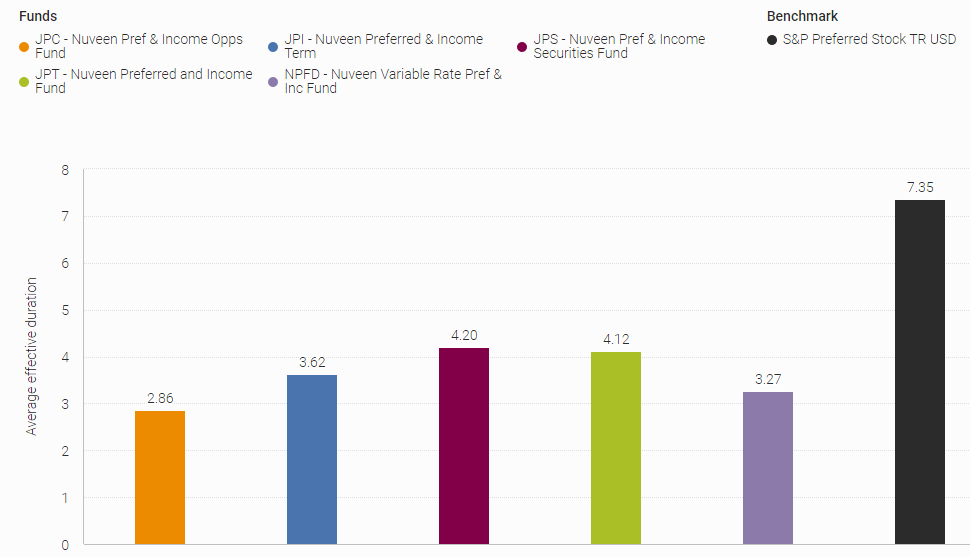
With NPFD under a year old, I left it out of the next analysis.
PortfolioVisualizer.com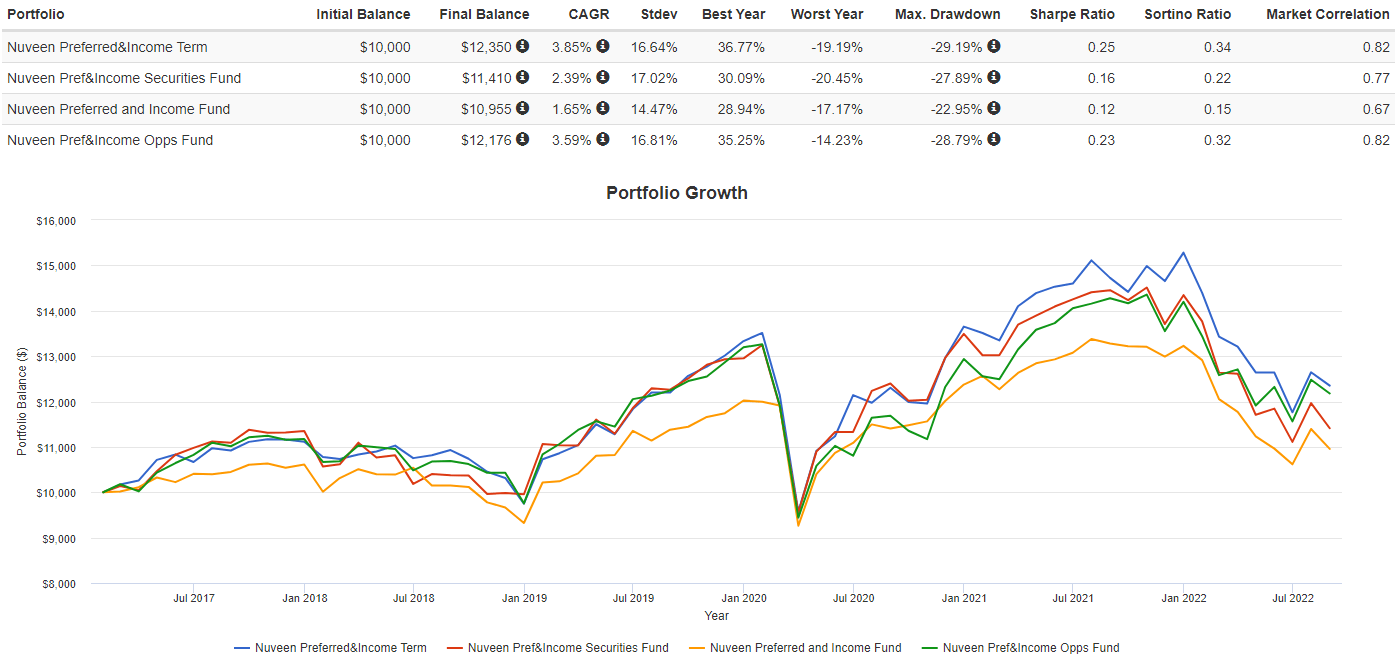
Since 2017, JPI has been the top performer amongst this set, with JPC placing second. JPI is scheduled to terminate in 2024, but like JPT, that could change.
Portfolio strategy
This chart shows the pain inflation is causing in the United States. The President and FOMC know inflation cannot stay at these levels and higher rates seem to be the main tool to fight it.
statista.com/chart-inflation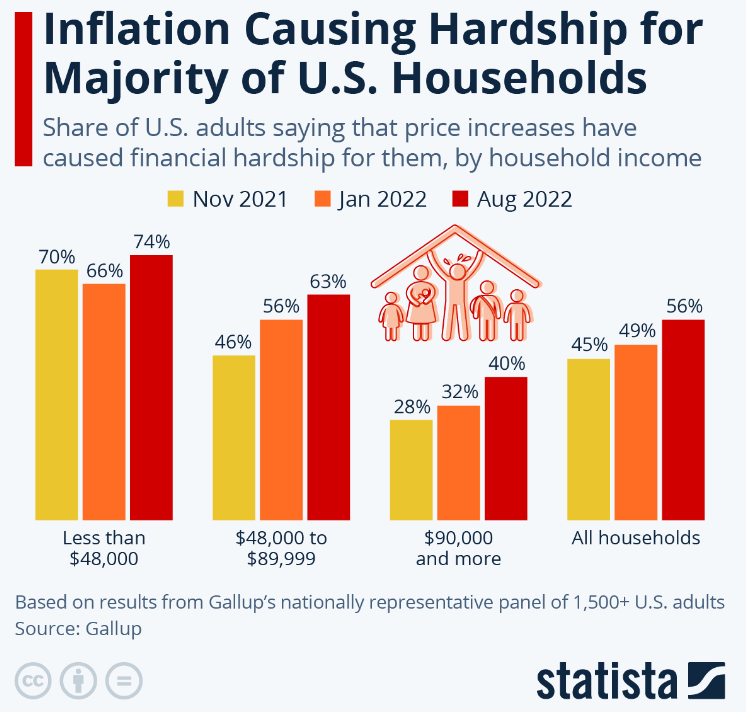
As mentioned, the latest reading came in at 8.3%, slightly above the consensus number. Expectations are the FOMC will do another 75bps increase to the Fed Funds rate at their next meeting (or two!). This is not a good environment for short-term fixed income investors as the past 12-month chart shows. JPC was on top during this time frame of rising rates.
PortfolioVisualizer.com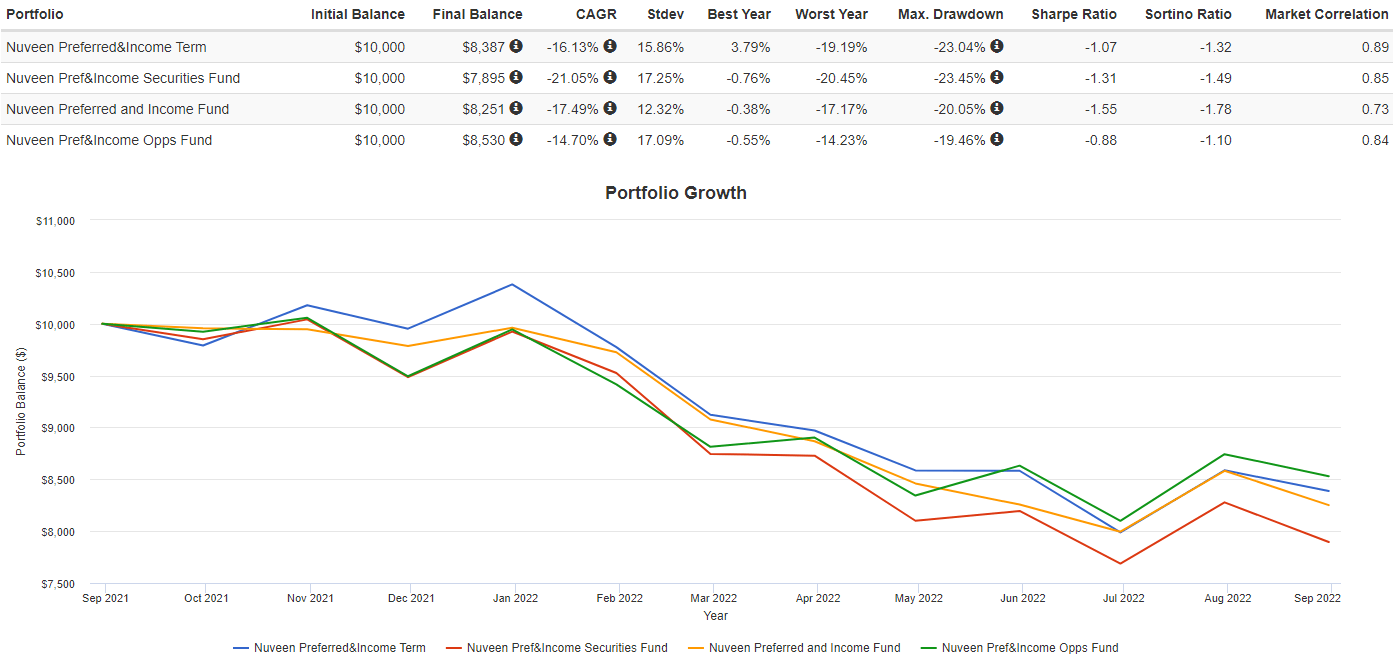
Other CEFs to consider
Assuming one has decided that JPC is the best of the Nuveen offerings within that class, how does it compare with other low-duration or floating-rate CEFs? For this, I will use four CEFs that I reviewed in two articles:
PortfolioVisualizer.com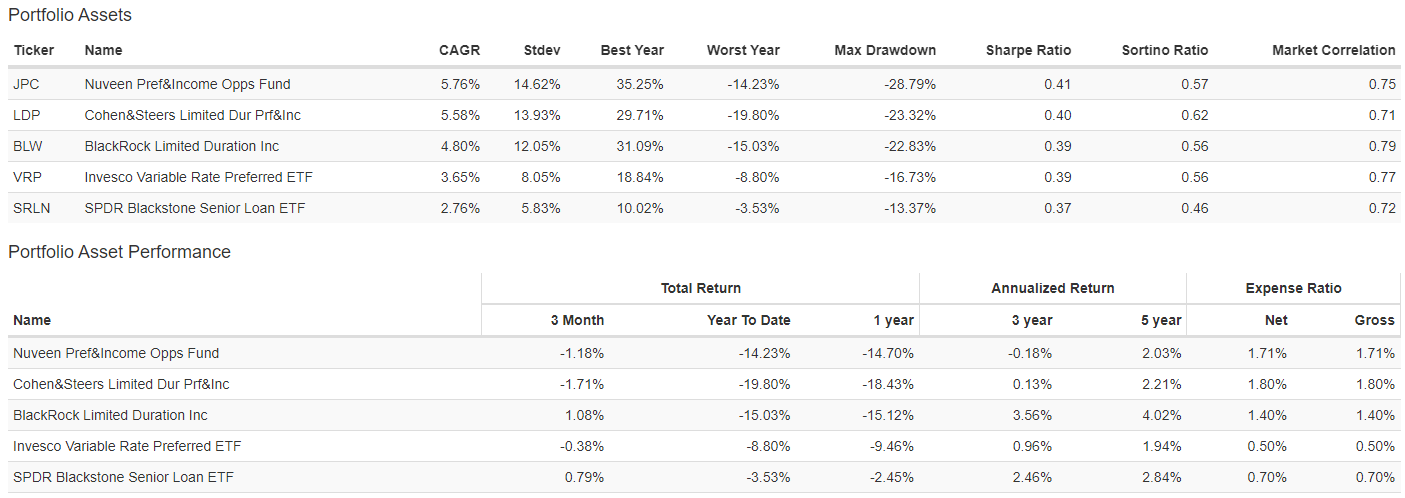
Since 2014, JPC has the best CAGR and Sharpe ratios, with the Cohen & Steers Limited Duration Preferred and Income Fund (LDP) right behind but with a better Sortino ratio. The SPDR Blackstone / GSO Senior Loan ETF (SRLN) has the shortest duration (.4) and that helped it achieve the best CAGR over the past 12 months.
Be the first to comment