

peshkov
This article was published on Dividend Kings on Wednesday, January 4, 2023.
—————————————————————————————
According to Bloomberg, in 2022, Morgan Stanley was the most accurate forecasting team on Wall Street.
They predicted that high inflation would cause interest rates to soar, bonds to suffer, and lead to a bear market.
They also correctly predicted the short-term bear market rallies. What was Morgan Stanley’s base case for 2023? They expect bonds to do relatively well in the first half, especially long-duration U.S. treasuries.
They also expect the first quarter to be especially painful for stocks, with the S&P 500 Index (SP500) potentially falling as much as 15% by the end of January.
Why? Because all year, Morgan Stanley’s Mike Wilson has warned that consensus estimates for 2023 earnings were way too high.
S&P Bear Market Potential Bottoms
| Earnings Decline In 2023 | 2023 S&P Earnings | X 25-Year Average PE Of 16.7 | Decline From Current Level |
| 0% | $218.46 | $3,648.28 | 4.6% |
| 5% | $207.54 | $3,465.87 | 9.4% |
| 10% | $196.61 | $3,283.45 | 14.1% |
| 13% | $190.06 | $3,174.01 | 17.0% |
| 15% | $185.69 | $3,101.04 | 18.9% |
| 20% | $174.77 | $2,918.63 | 23.7% |
(Source: Dividend Kings S&P 500 Valuation Tool, FactSet, Bloomberg Blue-Chip Consensus)
Morgan Stanley’s base-case 2023 earnings projection is for the S&P to come in at $195 and for the market to bottom at around 3,300, approximately 14% lower than it is now.
Their base case is that this will happen in Q1 (Goldman agrees), potentially in late January or early February. Why then? Two main reasons.
- First, the Q1 earnings season is expected to see 2023 guidance come in very conservative, causing earnings estimates to crumble. The last week of January is tech earnings week, with all the biggest tech giants reporting earnings.
- Next, we have market history. The timing of the 2023 recession, per the bond market, economic data, and individual economic forecasts, is for a mild recession to begin in Q1 and end in Q3. Historically, stocks bottom half-way through a recession when earnings pessimism is at its peak.
Now, Morgan Stanley’s base case isn’t that we get a recession, just a major slowdown. However, their base case for earnings still represents an 11% EPS decline in 2023, similar to the 13% average and median EPS decline for recessions since WWII.
Goldman expects an 11% EPS decline as well, and the blue-chip consensus range is for 0% to -20% EPS growth in 2023.
The blue-chip consensus expects the S&P to bottom at between 3,000 to 3,400 in the first half of 2023.
All of these models are statistical in nature, and based on 10,000 to 30,000 Monte Carlo Simulations.
But the point is that the market is likely not done falling and might fall a lot more, as much as 24%, and possibly in just the next few weeks.
Does that mean it’s time to sell everything and go to cash? Or hide entirely in long-bonds? Or even short the market? NO!
The greatest investors in history were not market timers, and none of the best and brightest minds on Wall Street are recommending their wealthy clients try such speculative “all-or-none” timing either.
Ben Carlson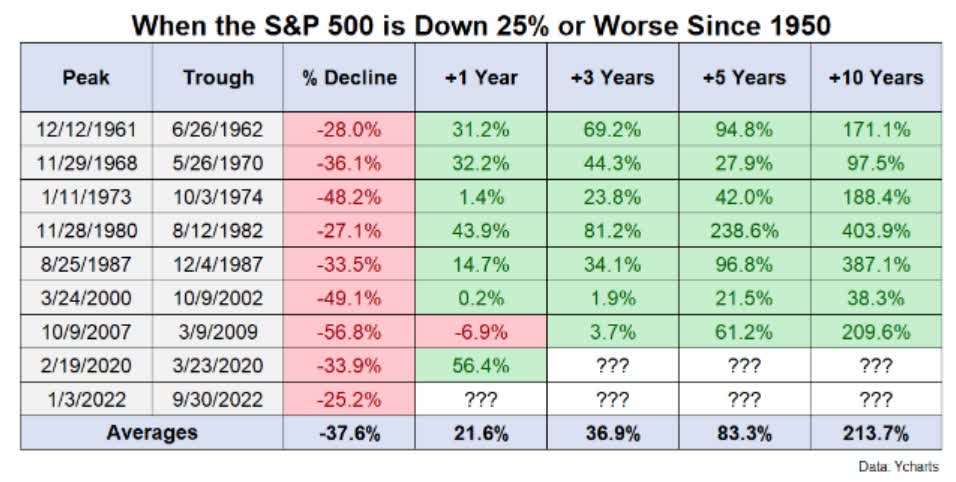
Guess what happens after the S&P falls 25%? It normally falls 17% more. And guess what investors who ignore that final painful short-term decline enjoy? A 22% average one-year gain, measured from the first time the market hits -25%.
More importantly, the average 10-year gain is 214%, or more than 3X on your money.
All past declines look like an opportunity, all future declines look like a risk.” – Morgan Housel
Unless the world ends, stocks will always be the best-performing asset class in history and always recover from bear markets.
Charlie Bilello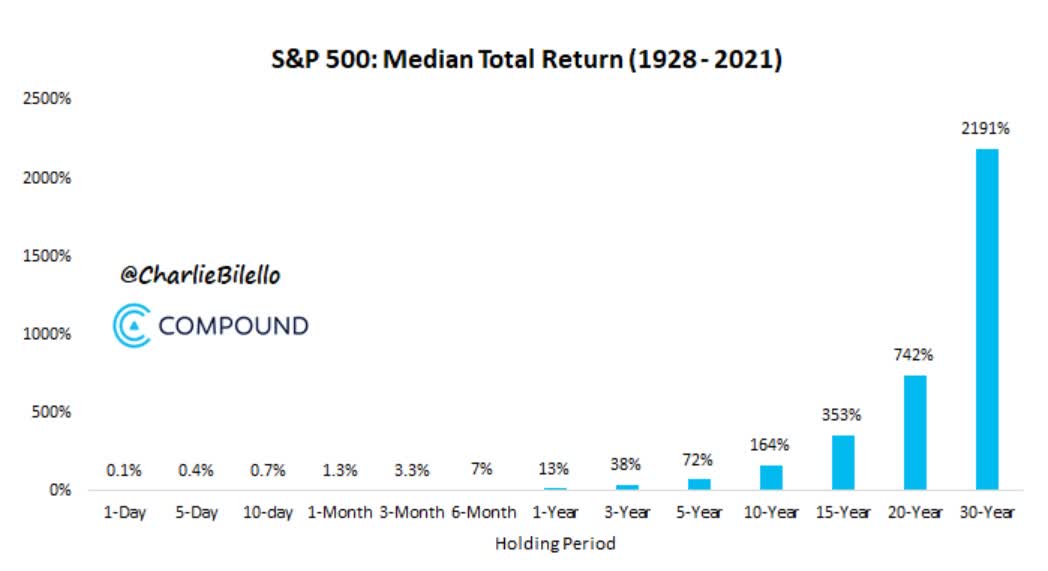
But to enjoy those long-term gains first, you must survive a potentially painful few weeks.
And that’s where healthcare dividend blue-chips can help.
Why Healthcare Is Likely A Great Sector For The First Half Of 2023
The bond market is currently screaming that a recession is a virtual 100% certainty in the first half of 2023. And the economic data indicates a mild recession could be coming within two to three months. This means that we’re likely in a “bull steepening” yield curve regime, which is what happens during recessions.
Reuters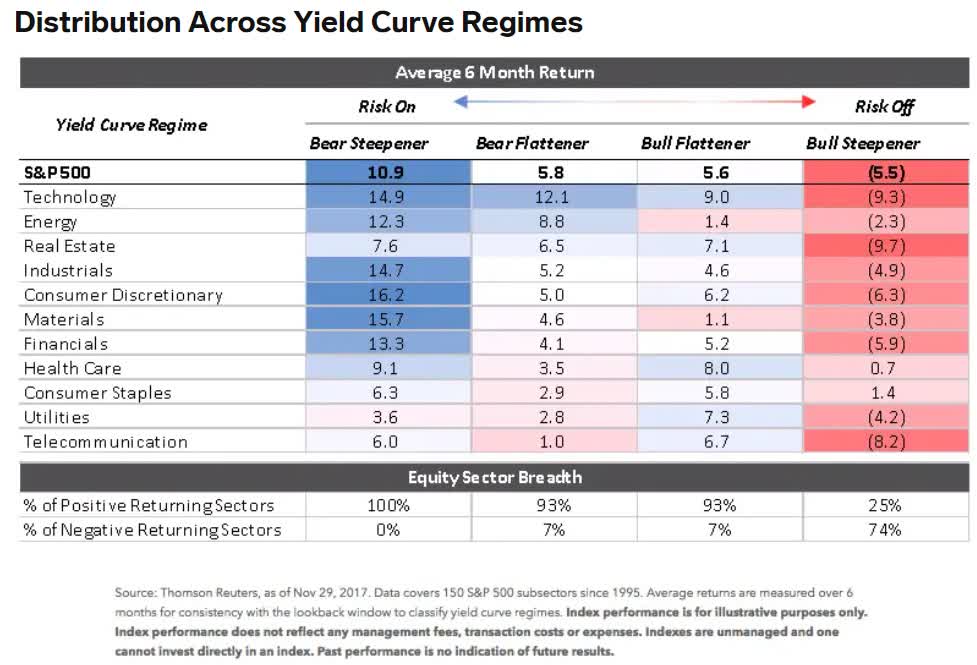
For this reason, healthcare is a favorite sector recommendation for the first half of 2023 among blue-chip analyst firms. It’s one of just two sectors that historically go up modestly during recessions.
But unlike consumer staples, which tend to lag when a new bear market begins, healthcare tends to keep up with the market in good times and outperform in bad ones.
That makes sense because healthcare is a necessity, and you need to buy medicine and medical treatments no matter what the economy is doing.
But do you know what’s even better than healthcare in a bear market?
Legacy Research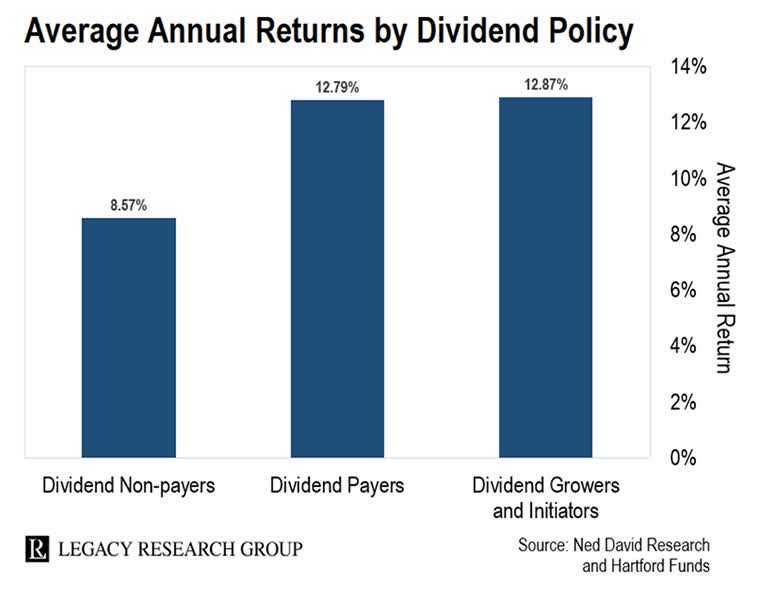
Dividend growth healthcare in a bear market. Dividend growth blue-chips are the single best-performing asset class in history, delivering 7X higher inflation-adjusted returns than non-dividend stocks over the last 50 years.
And do you know what are the most dependable dividend growth blue-chips? The dividend aristocrats and kings, companies with 25+ and 50+ year dividend growth streaks, respectively.
S&P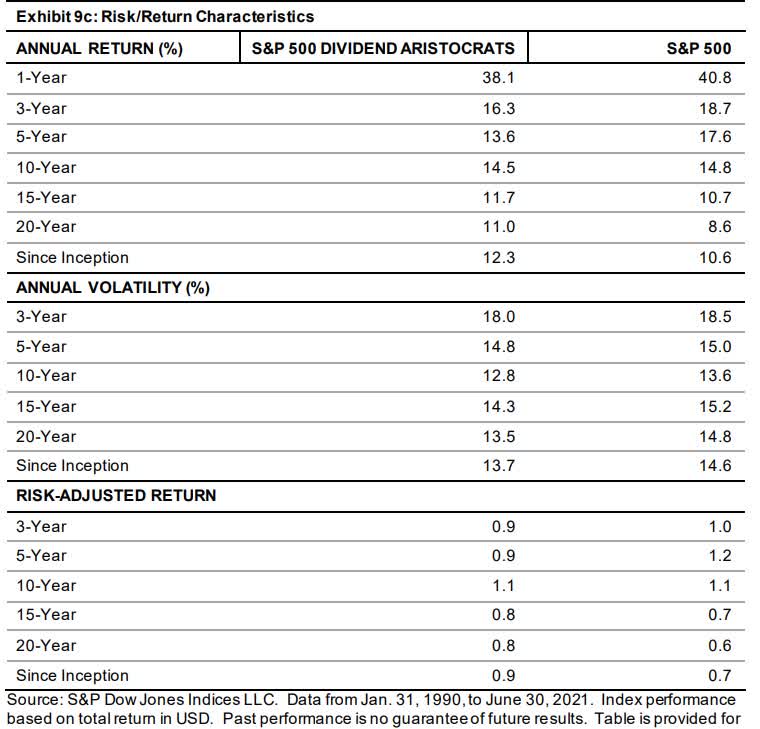
Aristocrats tend to be more mature companies, with safer and steadier dividends, and as a result, experience lower volatility and higher long-term returns than the S&P in general.
So what happens if you combine aristocrats, healthcare, and dividend growth? You get dividend aristocrat healthcare, arguably the most defensive equity choice for the coming recession.
But do you know what’s even better than a healthcare aristocrat? A healthcare dividend king such as Johnson & Johnson (NYSE:JNJ) or AbbVie Inc. (NYSE:ABBV).
- JNJ has a 59-year dividend growth streak and hasn’t missed a dividend payment in 106 years.
- ABBV has a 51-year dividend growth streak (S&P’s Grandfather rule from ABT spin-off) and hasn’t missed a dividend payment in 98 years.
Both are investment-grade world-beater blue-chips whose safe dividend credentials are beyond reproach.
And both tend to be lower volatility, defensive names that can help you sleep well at night, or SWAN, during even the scariest recessions and bear markets.
JNJ and ABBV (or Abbott (ABT) Pre-2013) Bear Market Peak Declines Since 1985
| Bear Market | JNJ | ABBV/ABT (Pre-2013) | 60/40 | S&P |
| 2022 Stagflation | 7% | 24% | -21% | -28% |
| Pandemic Crash | -11% | -13% | -13% | -34% |
| 2018 | -6% | -2% | -9% | -21% |
| 2011 | -1% | 0% | -16% | -22% |
| Great Recession | -28% | -26% | -44% | -58% |
| Tech Crash | -19% | -35% | -22% | -50% |
| July 1998 to October 1998 | -6% | 7% | -10% | -22% |
| 1990 Recession | 0% | 11% | NA | -20% |
| 1987 Black Monday Period | -26% | -31% | NA | -36% |
| Average | -10% | -7% | -19% | -32% |
| Peak Decline Vs. S&P 500 | -69% | -78% | -40% | 0% |
(Sources: Portfolio Visualizer Premium, Charlie Bilello.)
As you can see, both JNJ and ABBV/ABT have delivered exceptionally low volatility during every bear market of the last 37 years. In fact, they fall 70% to 80% less than the S&P and far less than even a 60/40 retirement portfolio.
So which of these defensive healthcare dividend kings is the better buy today? Let’s take a look.
Johnson & Johnson Vs. AbbVie: Battle Of The Defensive Ultra SWAN Dividend Kings
| Company | JNJ | ABBV | JNJ Wins | ABBV Wins |
| Yield | 2.5% | 3.6% | 1 | |
| LT Growth Consensus | 4.3% | 8.7% | 1 | |
| Total Return Potential | 6.8% | 12.3% | 1 | |
| LT Risk-Adjusted Expected Return | 4.8% | 8.2% | 1 | |
| Inflation & Risk-Adjusted Expected Return | 2.4% | 5.8% | 1 | |
| Conservative Years To Double (Adjusted For Risk And Inflation) | 30.6 | 12.5 | 1 | |
| Historical Total Return | 12.7% | 21.3% | 1 | |
| 12-Month Consensus Total Return Potential | 7% | 3% | 1 | |
| 12-Month Fundamentally Justified Total Return Potential | 2% | -9% | 1 | |
| 5-Year Consensus Return Potential | 5% to 11% | 7% to 11% | 1 | |
| Discount To Fair Value | 0% | -15.0% | 1 | |
| Cash-Adjusted P/E | 13.4 | 13.1 | 1 | |
| DK Rating | Reasonable Buy | Hold | 1 | |
| Dividend King’s Automatic Investment Decision Score | 61% Very Poor | 71% Below-Market Average | 1 | |
| Quality Score | 91% | 85% | 1 | |
| Safety Score | 97% | 85% | 1 | |
| Dependability Score | 83% | 86% | 1 | |
| S&P LT Risk Management Global Percentile | 77% Good, Low Risk | 99% Exceptional (Very Low Risk) | 1 | |
| Credit Rating | AAA Stable | BBB+ Positive | 1 | |
| 30-Year Bankruptcy Risk | 0.07% | 5.00% | 1 | |
| Dividend Growth Streak (Years) | 59 | 51 | 1 | |
| 5 Year Dividend Growth Rate | 6% | 18% | 1 | |
| Return On Capital (12-Months) | 122% | 338% | 1 | |
| Return On Capital Industry Percentile | 96% | 99% | 1 | |
| Return On Capital (13-Year Median) | 106% | 222% | ||
| Return On Capital (5-Year trend) | -1% | -4.2% | 1 | |
| Sum | 11 | 14 |
(Sources: DK Research Terminal.)
If we consider only safety and quality, JNJ is the slight victor.
It has an AAA-credit rating, one of just two in all of corporate America.
- JNJ’s AAA-credit rating = 0.07% 30-year bankruptcy risk according to S&P = 1 in 1,429 chance of losing all your money if you buy it.
- ABBV’s BBB+ positive outlook rating = 5% 30-year bankruptcy risk (33% chance of getting upgraded to A- within two years, 2.5% risk).
Both companies have strong balance sheets, with stable recession-resistant cash flows that can easily service their interest payments.
JNJ a more diversified business model that combines patented medicines with medical devices and equipment.
JNJ’s dividend growth streak of 59 years is also slightly better than ABBV’s. JNJ has been raising its dividend every year since 1963, including through:
- nine recessions
- 14 bear markets
- inflation as high as 15%
- interest rates as high as 20%
- two economic crises.
Then again, ABBV/ABT’s dividend track record is almost as impressive. ABBV/ABT have been raising their dividend every year since 1971 through:
- eight recessions
- 12 bear markets
- inflation as high as 15%
- interest rates as high as 20%
- two economic crises.
What about overall long-term risk management?
DK uses S&P Global’s global long-term risk-management ratings for our risk rating.
- S&P has spent over 20 years perfecting their risk model
- which is based on over 30 major risk categories, over 130 subcategories, and 1,000 individual metrics
- 50% of metrics are industry specific
- this risk rating has been included in every credit rating for decades.
The DK risk rating is based on the global percentile of how a company’s risk management compares to 8,000 S&P-rated companies covering 90% of the world’s market cap.
S&P’s risk management scores factor in things like:
- supply chain management
- crisis management
- cyber-security
- privacy protection
- efficiency
- R&D efficiency
- innovation management
- labor relations
- talent retention
- worker training/skills improvement
- occupational health & safety
- customer relationship management
- business ethics
- climate strategy adaptation
- sustainable agricultural practices
- corporate governance
- brand management.
How do JNJ and ABBV score on the most comprehensive long-term risk management model on Wall Street?
| Classification | S&P LT Risk-Management Global Percentile |
Risk-Management Interpretation |
Risk-Management Rating |
| BTI, ILMN, SIEGY, SPGI, WM, CI, CSCO, WMB, SAP, CL | 100 | Exceptional (Top 80 companies in the world) | Very Low Risk |
| AbbVie | 99 |
Exceptional |
Very Low Risk |
| Strong ESG Stocks | 86 |
Very Good |
Very Low Risk |
| Foreign Dividend Stocks | 77 |
Good, Bordering On Very Good |
Low Risk |
| Ultra SWANs | 74 | Good | Low Risk |
| Johnson & Johnson | 71 | Good | Low Risk |
| Dividend Aristocrats | 67 | Above-Average (Bordering On Good) | Low Risk |
| Low Volatility Stocks | 65 | Above-Average | Low Risk |
| Master List average | 61 | Above-Average | Low Risk |
| Dividend Kings | 60 | Above-Average | Low Risk |
| Hyper-Growth stocks | 59 | Average, Bordering On Above-Average | Medium Risk |
| Dividend Champions | 55 | Average | Medium Risk |
| Monthly Dividend Stocks | 41 | Average | Medium Risk |
(Source: DK Research Terminal.)
Both companies are adaptable to all business challenges, including their inherent company and industry-specific risk profiles. But AbbVie has superior risk management, according to S&P, thanks to a CEO that’s thus far proven brilliant at executing ABBV’s long-term plan.
That plan was to, from day one, diversify ABBV as quickly as possible away from Humira.
The execution wasn’t perfect, as the Stemcentryx for $9.8 billion in 2016. That M&A deal didn’t work out when ROVA-T failed in trials in 2019, forcing ABBV to write down $4 billion of its goodwill.
But do you know how many acquisitions AbbVie has made since its 2013 spin-off? Eight. How many have failed so far? Just one.
- 88% success rate on M&A
- Harvard estimates 70% of M&A deals fail.
Or, to put it another way, AbbVie’s CEO, Rick Gonzalez, is about 3X better at M&A than the average CEO.
When we consider everything together, from the balance sheet to risk management to business model diversification JNJ’s dividend is slightly safer.
- 97% safety score vs. 85% for ABBV.
What does that actually mean from the perspective of dividend cut risk in an average or severe recession?
In an average or mild recession, the risk of a cut from either JNJ or ABBV is approximately 0.5%.
In a severe recession, like the Pandemic or Great Recession, it’s approximately 1.15% for JNJ.
For ABBV, severe recession dividend cut risk is approximately 1.75%.
However, while there is no questioning JNJ’s superior cash flow stability and balance sheet, there is more to quality than just dividend growth streaks and credit ratings.
For example, ABBV’s long-term risk management rating is in the top 100 companies on earth, according to S&P. That’s mostly due to CEO Rick Gonzalez’s impeccable execution of the Humira diversification plan.
Besides Stemcentryx, AbbVie hasn’t stepped a foot wrong in 10 years, according to S&P.
And let’s not forget about Wall Street’s favorite quality proxy, profitability.
Johnson & Johnson Historical Profitability
GuruFocus Premium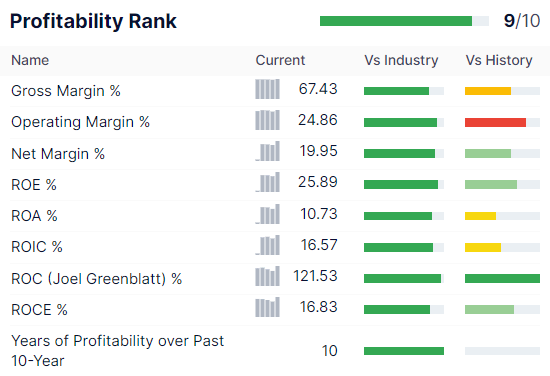
JNJ’s 20% net margin and 122% return on capital are in the top 10% of its peers historically.
But ABBV’s concentrated approach to high-margin drugs makes its profitability even better.
AbbVie Historical Profitability
GuruFocus Premium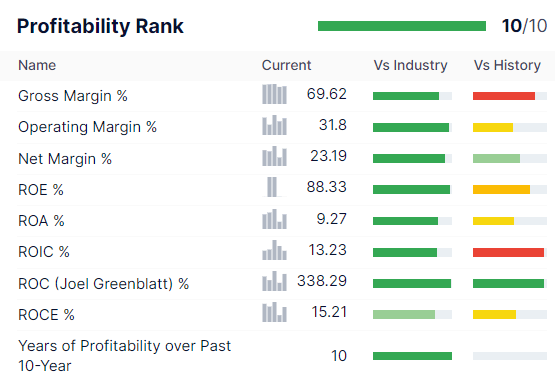
AbbVie’s 23% net margins are slightly better than JNJ’s 20% but its 338% return on capital is vastly superior.
What is return on capital? It’s Joel Greenblatt’s favorite proxy for moatiness and quality.
- Greenblatt delivered 40% annual returns for 21 years at Gotham Capital
- one of the greatest investors in history.
For context, the S&P’s ROC is about 15%, and the dividend aristocrats’ 105%.
Or, to put it another way, based on Greenblatt’s favorite quality metric, ABBV is about 3X higher quality than JNJ and 23X higher quality than the average S&P company.
Ycharts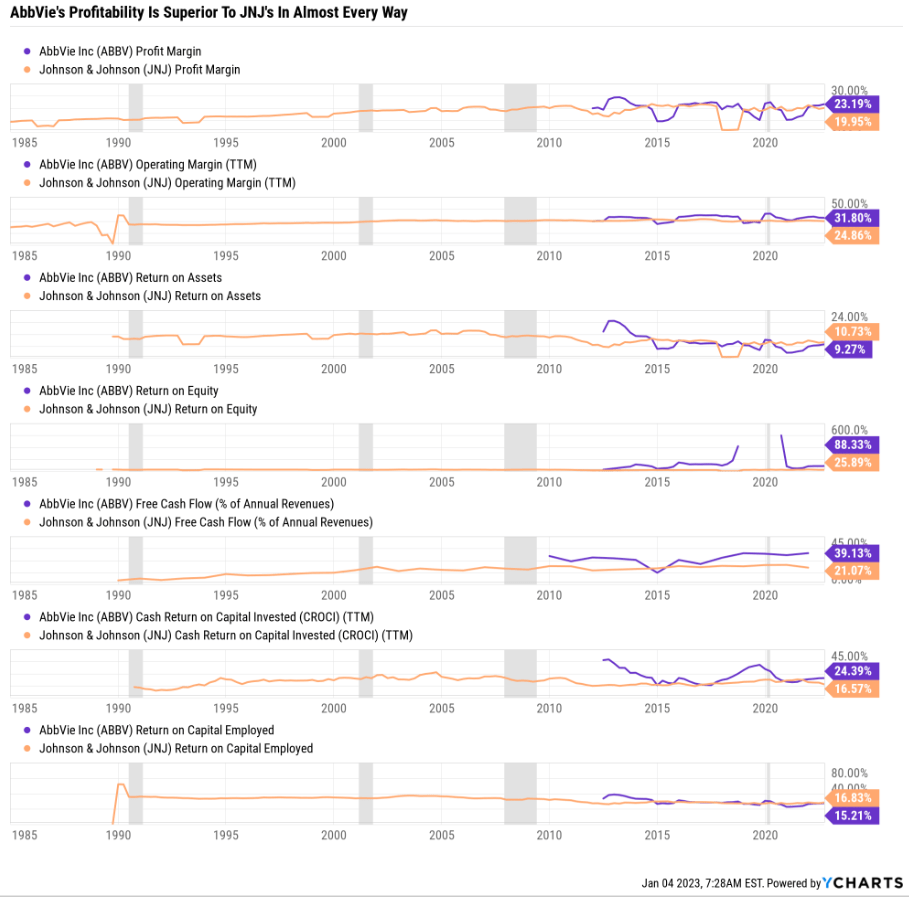
ABBV’s other margins are also superior to JNJ, especially when it comes to free cash flow margin, which was 39% over the past year.
For context, that’s in the top 5% of all companies on earth.
AbbVie Is A Free Cash Flow Minting Machine
FactSet Research Terminal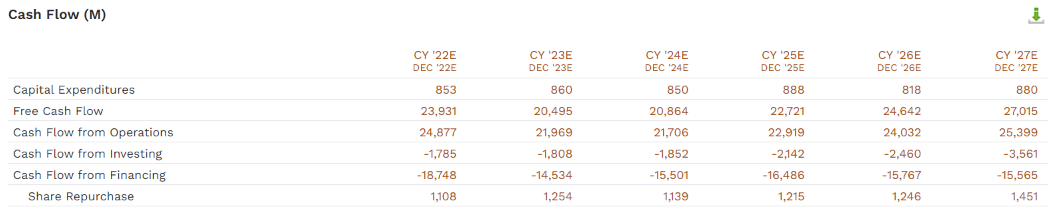
AbbVie’s free cash flow is expected to fall from $24 billion in 2022 to a trough of $20.5 billion in 2023, the peak Humira patent cliff year. But by 2027, new drugs brought on from the Allergen acquisition, as well as Syndesi Therapeutics (ABBV’s 2022 acquisition), are expected to raise it to record highs of $27 billion.
- 44% FCF margin consensus in 2027
- a record high
- top 1% of all companies on earth.
AbbVie spends $10.5 billion per year on its dividend, so that’s approximately a 50% free cash flow (“FCF”) payout ratio in 2023’s Humira patent cliff trough. That’s in line with management’s policy of targeting a 40% to 50% FCF payout ratio.
- Rating agencies consider a 60% FCF payout ratio safe for drug makers.
Many investors have worried Humira was a cliff AbbVie could never overcome, becoming the next Gilead (GILD).
- GILD’s Hep C drugs caused profits to rocket, but they have never overcome that patent cliff.
But as you can see, ABBV’s brilliant management team has overcome that challenge and turned this dividend king into a fast-growing dividend powerhouse.
One whose long-term return potential is far superior to JNJ’s.
Long-Term Return Potential: ABBV Runs Circles Around JNJ
What kind of returns do analysts expect from JNJ and ABBV in the future?
| Investment Strategy | Yield | LT Consensus Growth | LT Consensus Total Return Potential | Long-Term Risk-Adjusted Expected Return |
| AbbVie | 3.6% | 8.7% | 12.3% | 8.6% |
| Vanguard Dividend Appreciation ETF | 1.9% | 10.2% | 12.1% | 8.5% |
| Nasdaq | 0.8% | 10.9% | 11.7% | 8.2% |
| Schwab US Dividend Equity ETF | 3.4% | 7.6% | 11.0% | 7.7% |
| Dividend Aristocrats | 1.9% | 8.5% | 10.4% | 7.3% |
| S&P 500 | 1.8% | 8.5% | 10.3% | 7.2% |
| Johnson & Johnson | 2.5% | 4.3% | 6.8% | 4.8% |
(Source: DK Research Terminal, FactSet, Morningstar, Ycharts.)
AbbVie has delivered 21% annual returns over the last decade, almost double JNJ’s 12%.
In the future, it’s expected to deliver about 6% higher inflation-adjusted returns, thanks to its more concentrated patented drug approach.
You might not think that 8.7% growth is that impressive, but it’s more than 2X the 4% growth rate Moody’s expects from big pharma.
JNJ is so large that it’s expected to basically keep up with the industry, resulting in decent, if not underwhelming, returns of about 7% over time.
Inflation-Adjusted Consensus Return Potential: $1,000 Starting Investment
| Time Frame (Years) | 7.8% CAGR Inflation-Adjusted S&P 500 Consensus | 4.4% Inflation-Adjusted JNJ Consensus | 9.9% CAGR Inflation-Adjusted ABBV Consensus | Difference Between Inflation-Adjusted ABBV Consensus And S&P Consensus |
| 5 | $1,453.75 | $1,240.23 | $1,603.20 | $149.45 |
| 10 | $2,113.39 | $1,538.17 | $2,570.26 | $456.87 |
| 15 | $3,072.33 | $1,907.69 | $4,120.65 | $1,048.31 |
| 20 | $4,466.40 | $2,365.97 | $6,606.23 | $2,139.83 |
| 25 | $6,493.02 | $2,934.35 | $10,591.13 | $4,098.11 |
| 30 | $9,439.23 | $3,639.28 | $16,979.73 | $7,540.50 |
(Source: DK Research Terminal, FactSet.)
AbbVie could deliver 5% higher annual inflation-adjusted returns than JNJ in the coming years and decades.
| Time Frame (Years) | Ratio Inflation-Adjusted ABBV Consensus/JNJ Consensus | Ratio Inflation-Adjusted ABBV Consensus vs. S&P consensus |
| 5 | 1.29 | 1.10 |
| 10 | 1.67 | 1.22 |
| 15 | 2.16 | 1.34 |
| 20 | 2.79 | 1.48 |
| 25 | 3.61 | 1.63 |
| 30 | 4.67 | 1.80 |
(Source: DK Research Terminal, FactSet.)
ABBV offers almost 5X more inflation-adjusted return potential than JNJ over the next 30 years. And almost 2X more than the S&P 500.
- ABBV offers 2X the very safe yield of the market today
- and almost 2X more wealth potential in the future.
And even if you’re a pure income investor, keep in mind one important fact. Long-term income growth tracks total returns very closely.
Want proof? Let’s consider JNJ and ABBV’s historical total returns and income growth.
| Company | Total Return Since 2013 | Yield 2013 | Yield On Cost 2022 | Annual Income Growth |
Income Growth/Total Return |
| Johnson & Johnson | 12.7% | 3.7% | 8.2% | 9.24% | 73% |
| AbbVie | 21.3% | 4.6% | 23.8% | 20.04% | 94% |
| S&P | 12.3% | 2.4% | 5.3% | 9.20% | 75% |
| Average | 81% |
(Source: Portfolio Visualizer Premium.)
Income growth from stocks tracks total returns, with a historical margin of error of about 20% to 30%.
That’s also the margin of error for the Gordon Dividend Growth model, the most accurate total return model ever devised.
This means if you tell me the yield today and the long-term consensus growth forecast, I can tell you the long-term income growth of a stock with a 36% to 51% margin of error over decades.
Future Income Growth Forecast
| Company | Yield | Growth | Total Return | Long-Term Income Growth (Conservative Estimate) |
Long-Term Income Growth (Bullish Estimate) |
| Johnson & Johnson | 2.5% | 4.3% | 6.8% | 3.3% | 10.3% |
| AbbVie | 3.6% | 8.7% | 12.3% | 6.0% | 18.6% |
| S&P | 1.8% | 8.5% | 10.3% | 5.0% | 15.6% |
(Source: DK Research Terminal, FactSet.)
As long as a company’s conservative long-term income growth exceeds the bond market’s long-term inflation expectations of 2.4%, it’s a potentially good income investment.
JNJ is thus a fine long-term dividend growth investment as long as you realize that about 7% long-term returns are the current base case.
- 4.7% to 8.8% is the long-term margin-of-error return potential for JNJ
- 8.6% to 16.0% for ABBV.
So that means that ABBV is the clear winner, and you should buy it today, right? No.
Valuation: Where JNJ Is The Clear Winner Over AbbVie
| Company | Historical Fair Value | Current Price |
Discount To Fair Value |
| Johnson & Johnson | $177.84 | $178.19 | -0.2% |
| AbbVie | $141.64 | $162.38 | -14.6% |
| S&P | $3,872.16 | $3,824.14 | 1.2% |
(Source: DK Research Terminal, FactSet, JPMorgan Asset Management.)
The market and JNJ are pretty fairly valued, while ABBV is trading at a 15% historical premium.
What happens if you buy a slow-growing Ultra SWAN like JNJ at fair value? You shouldn’t expect strong returns in the coming years.
Johnson & Johnson 2025 Consensus Return Potential
(Source: FAST Graphs, FactSet)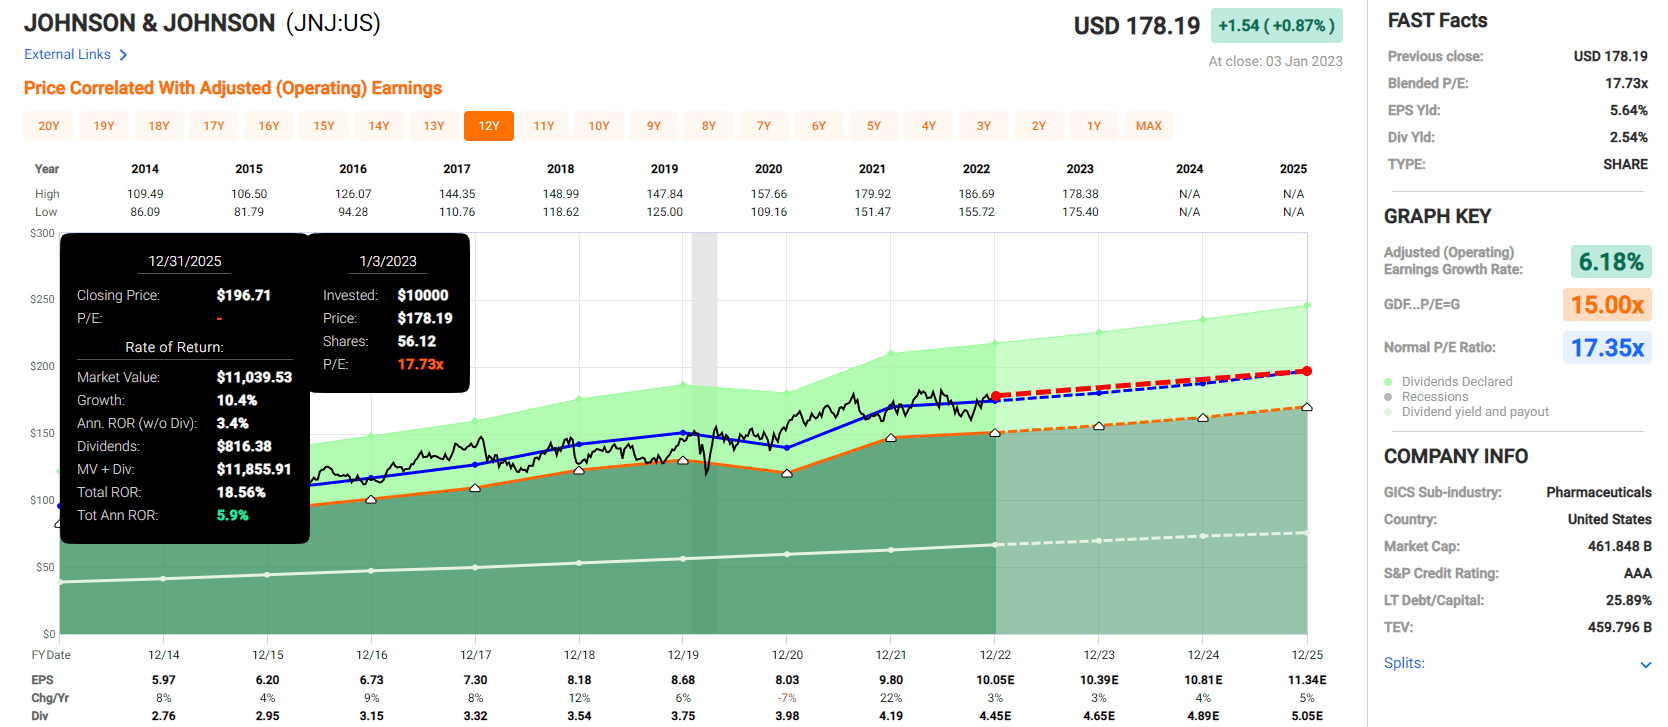
Buy JNJ today, and you can reasonably expect about 6% annual returns for the next three years.
Johnson & Johnson 2028 Consensus Return Potential
(Source: FAST Graphs, FactSet)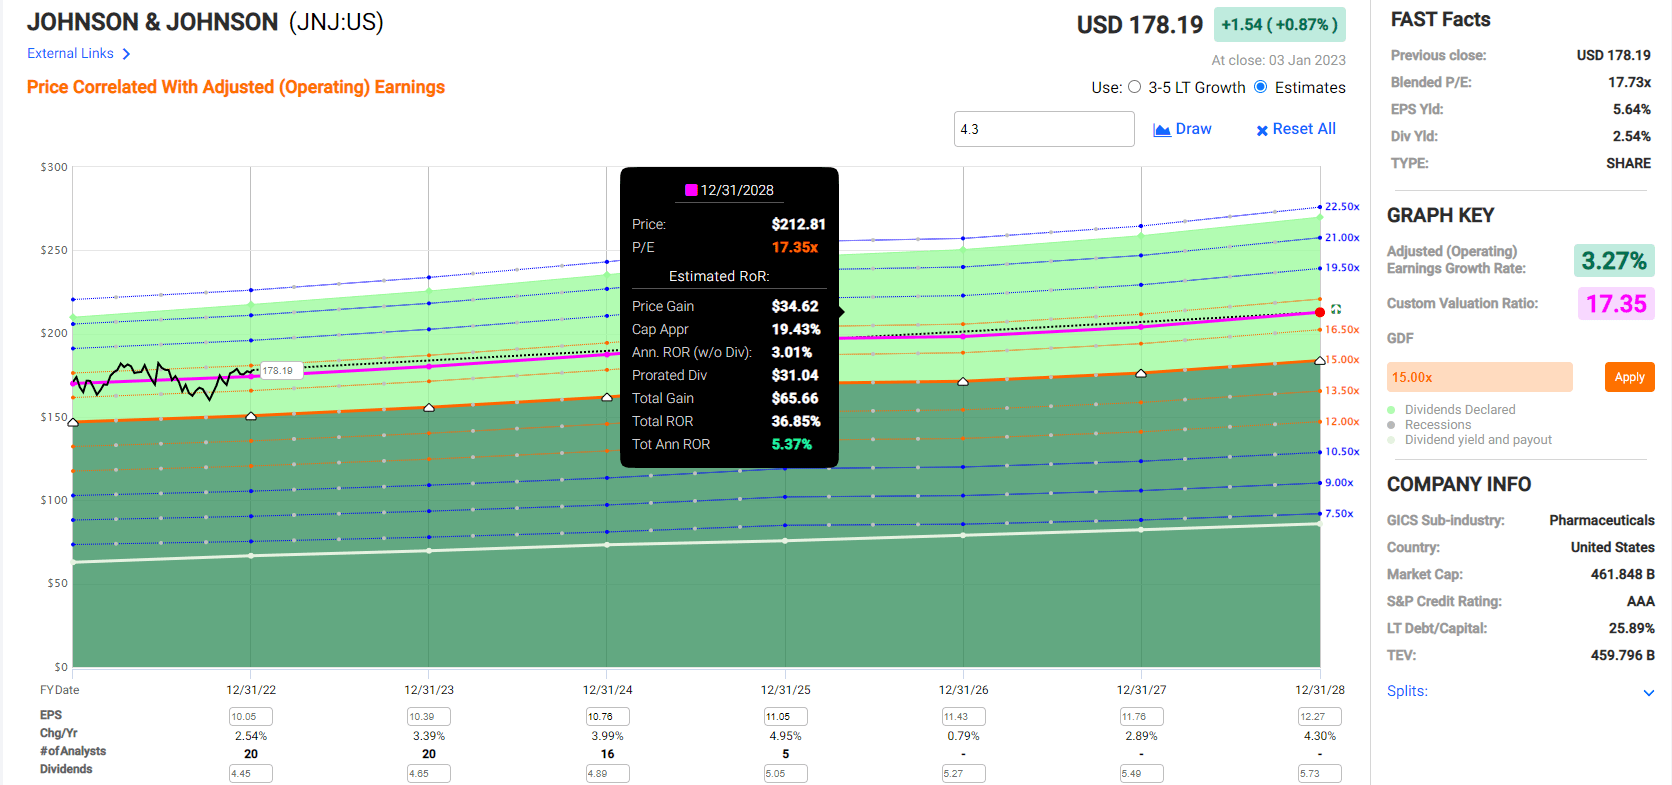
Buy JNJ today, and you can reasonably expect about 5% to 6% annual returns in the next five years.
AbbVie 2025 Consensus Return Potential
(Source: FAST Graphs, FactSet)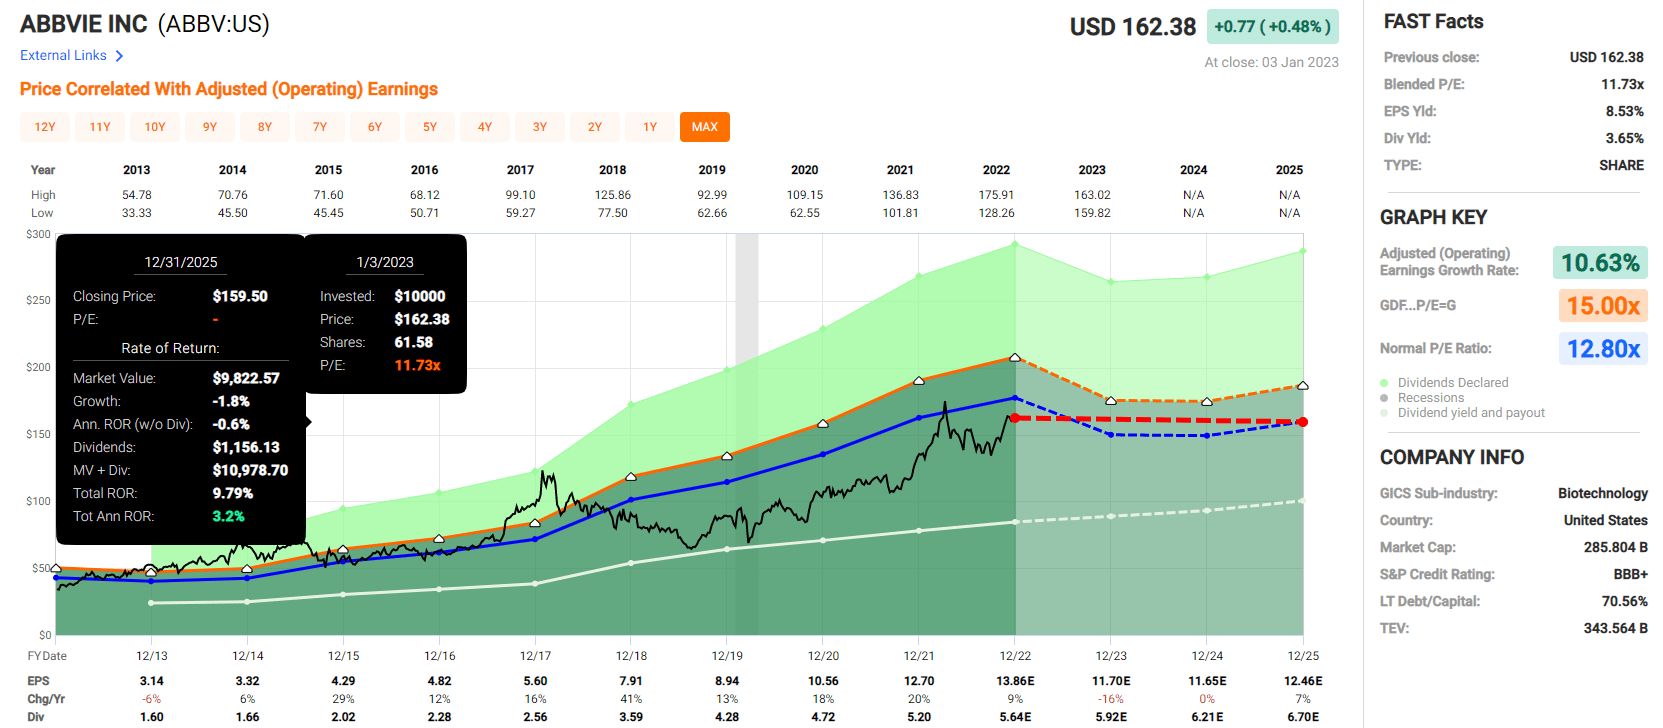
Due to two negative years of growth from the Humira patent cliff, anyone buying ABBV today can reasonably expect 3% to 4% annual returns over the next three years.
AbbVie 2028 Consensus Return Potential
(Source: FAST Graphs, FactSet)
If you buy ABBV today, you can reasonably expect 5% to 9% annual returns over the next five years, with a base case of 7%.
So even though ABBV is more overvalued than JNJ, its superior yield and growth still offer slightly superior returns and far better long-term income.
Bottom Line: Both JNJ and ABBV Are Defensive Aristocrats For What’s Coming Next, But AbbVie Is Likely The Better Long-Term Buy
Should you expect JNJ or ABBV to go up in the coming downturn? While both stocks have gone up in previous bear markets, the answer is no.
JNJ and ABBV (or ABT Pre 2013) Bear Market Peak Declines Since 1985
| Bear Market | JNJ | ABBV/ABT (Pre-2013) | 60/40 | S&P |
| 2022 Stagflation | 7% | 24% | -21% | -28% |
| Pandemic Crash | -11% | -13% | -13% | -34% |
| 2018 | -6% | -2% | -9% | -21% |
| 2011 | -1% | 0% | -16% | -22% |
| Great Recession | -28% | -26% | -44% | -58% |
| Tech Crash | -19% | -35% | -22% | -50% |
| July 1998 to October 1998 | -6% | 7% | -10% | -22% |
| 1990 Recession | 0% | 11% | NA | -20% |
| 1987 Black Monday Period | -26% | -31% | NA | -36% |
| Average | -10% | -7% | -19% | -32% |
| Peak Decline Vs. S&P 500 | -69% | -78% | -40% | 0% |
(Sources: Portfolio Visualizer Premium, Charlie Bilello.)
JNJ and ABBV are low-volatility defensive dividend kings that are historically more defensive than a 60/40 retirement portfolio. They are quintessential Ultra SWANs, but you should expect modest declines in the coming weeks.
But that’s not necessarily bad, given that JNJ is fairly valued right now and ABBV is 15% overvalued.
Long-term, both companies will make you money; I can say that with 80% confidence. But AbbVie, thanks to its far superior growth prospects and higher yield, is what I recommend for most conservative income investors.
Because while JNJ’s quality and balance sheet safety are impeccable, ultimately, safety and quality keep you from losing money, not making money.
JPMorgan Asset Management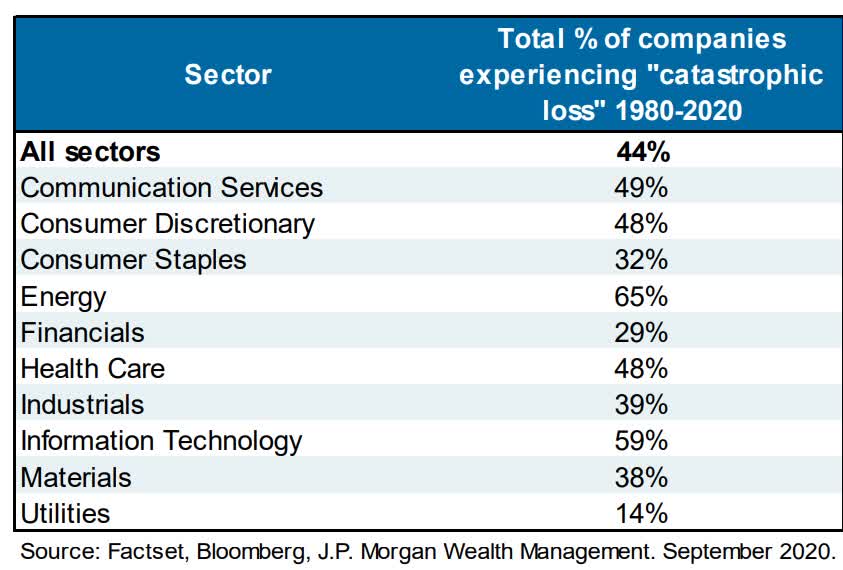
In other words, JNJ’s Ultra SWAN dividend king quality and AAA-credit ratings mean it’s highly unlikely to become one of the 44% of U.S. stocks that suffer permanent catastrophic 70+% declines.
But safety and quality don’t drive returns, just yield, growth, and valuation do.
Ploutos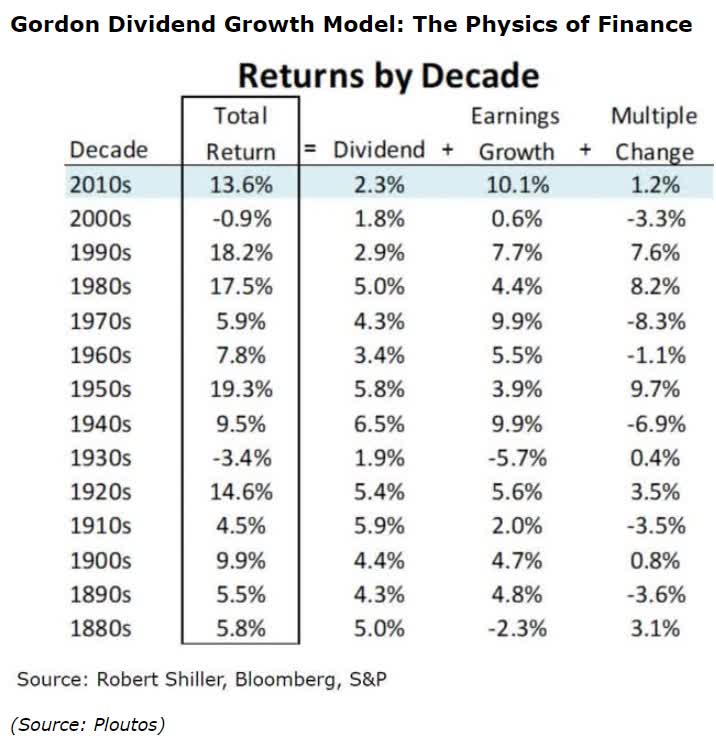
Johnson & Johnson’s 2.5% yield and 4.3% long-term growth prospects mean that long-term investors can expect about 7% returns from this ultimate SWAN stock.
But ABBV’s 3.6% yield and 8.7% growth potential means it could deliver closer to 13% long-term returns.
- potentially 4X to 5X more inflation-adjusted income and wealth of JNJ.
If you’re looking to sleep well at night during bear markets and earn superior income and returns to what most ETFs offer, AbbVie Inc., once it returns to its fair value of $142 or better, is the superior choice for most conservative income growth investors.
Be the first to comment